Афоризм
Как только садишься на диету, рядом тут же кто-то садится жрать.
Михаил Жванецкий
Поддержка проекта
Если Вам сайт понравился и помог, то будем признательны за Ваш «посильный» вклад в его поддержку и развитие
• Yandex.Деньги
410013796724260
• Webmoney
R335386147728
Z369087728698
Визуальный редактор iReport Designer предназначен для создания jrxml-шаблонов, используемых
при создании отчетов в JasperReports. Скачать последнюю версию iReport Designer можно на
официальной странице производителя
Jaspersoft
Community.
На момент написания
данной статьи последней версией была iReport-5.6.0, с которой возникли небольшие сложности, связанные с JVM
версии 1.8.0.131. Так на одном компьютере (Windows-10, x64) iReport стартовал сразу же без проблем,
а на другом — (Windows-7, x32) не захотел работать. После определения в файле «iReport-5.6.0/etc/ireport.conf»
пути к jdk1.7.0_79, проблема была решена.
На странице описывается применение iReport Designer для создания jrxml-шаблона, который
используется в примере на странице JasperReports. Там же приводится и
описание структуры jrxml-шаблона и исходные данные для отчета.
Выбор типа шаблона
Для определения типа шаблона необходимо выбрать пункт меню File/New, которое откроет окно с набором
различных типов.

Выбираем шаблон по умолчанию. Далее нажимаем на кнопку «Open this Template» и переходим
к определению наименования шаблона и директории его расположения.

Если нажать на первом шаге кнопку «Launch Report Wizard», то дополнительно можно будет определить источник
данных и параметры подключения к нему, поля в отчете и т.д. Для первого отчета это можно пропустить, тем более
что в примере база данных не используется.
После определения первичных параметров откроется окно с заготовкой jrxml-шаблона. Слева в интерфейса
располагается Report Inspector, определяющий структуру шаблона. По центру сам шаблон, который можно
переключать в режим Designer, XML и Preview кнопками, расположенными сверху над ним. Справа располагается
панель свойств Properties элементов шаблона. Дополнительные панели различных свойств шаблона
представлены в пункте меню Window.

Общие настройки
Первоначально проверяем язык Language. Для этого выделяем корневой элемент в Report Inspector и
в панели свойств Properties меняем Language с Groovy (по умолчанию) на Java.
Определение стиля шаблона
Для определения стиля jrxml-шаблона выделяем элемент Styles и правой клавишей мыши выбираем
контекстный пункт меню Add/Style.

В панели свойств устанавливаем соответствующие значения : «Pdf Font name», «Pdf Encoding».

Можно напрямую определить значения стиля в jrxml-шаблоне после перевода его в режим XML.
<style name="Default" isDefault="true"
          pdfFontName="./font/ARIAL.TTF"
          pdfEncoding="Cp1251"/>
Использование шрифта ./font/ARIAL.TTF позволяет локализовать кириллицу.
Управление секциями шаблона
Удаляем не используемые в нашем первом отчете секции. Для этого необходимо выделить соответствующую секцию
в панели Report Inspector и в контекстном меню (открыть правой клавишей мыши), выбрать пункт
«Delete Band». Не используемая в шаблоне секция становится в Report Inspector серой. Чтобы добавить
секцию в шаблон необходимо в контекстном меню выбрать «Add Band».
В шаблоне оставляем только секции Title, Column Header и Detail1.
Добавление поля, параметра, переменной
Для добавления поля в шаблон необходимо выделить элемент Fields в «Report Inspector» и выбрать
в контекстном меню «Add Field».

После этого следует определить наименование и тип/класс поля в панели свойств Properties.
Дополнительно можно добавить комментарий к полю (Description).

К элементу Fields добавляем поля state(java.lang.String), item(java.lang.String),
date(java.util.Date), quantity(java.lang.Integer), price(java.lang.Integer).
К элементу Parameters добавляем параметр DATE и определяем тип java.util.Date.
К элементу Variables добавляем переменную cost c типом java.lang.Integer, для которой необходимо
определить в качестве свойства выражение «Variable Expression». Это можно сделать в отдельном окне, нажав на
кнопку «…» в поле «Variable Expression» панели свойств.

Визуальные компоненты jrxml-шаблона
Для формирования интерфейса шаблона необходимо использовать панель «Palette», которую можно открыть либо
горячими клавишами Ctrl+Shift+8, либо выбрать пункт меню Window/Palette. Панель «Palette» будет помещена в панель
свойств «Properties».

Для отчета выбираем компоненты «Text Field» и перетаскиваем одно в секцию Title и шесть — в секцию Detail1.
В секцию Column Header перетаскиваем 6 компонентов «Static Text».
По умолчанию поля «Text Field» связаны с несуществующим полем $F{field}. Чтобы их связать с определенными в
шаблоне полями, параметрами и переменными необходимо в панели свойств «Properties» выделить «Text Field
Expression», нажать на кнопку «…» и в окне «Text Field Expression» переопределить связь.

Для заголовков колонок используем компоненты «Static Text», для каждого из которых определяем текст и фон.
На следующих двух скриншотах представлены панели «Report Inspector» и «Properties» с выделенным заголовком
«Стоимость».


Итоговый интерфейс jrxml-шаблона для описанного на странице JasperReports
примера представлен на следующем скриншоте.

Генерируемый на основе шаблона отчет можно увидеть здесь.
Продолжение статьи с рассмотрением группировки и суммирования данных, а также нумерации данных в секции,
можно увидеть здесь.
С примером настройки JDBC в приложении iReport и формированием JasperReport отчета можно
познакомиться здесь.
Использование ireport
Что такое JasperReports и iReport?
- JasperReport сам по себе является очень сложным XML-файлом для разработки отчетов, и потребности реальных проектов постоянно меняются. Невозможно написать код Java для его разработки, фактически его невозможно разработать без использования инструментов визуализации. Таким образом, JasperReport предоставляет нам визуальную помощь, iReport.
- iReport — это мощный, интуитивно понятный и простой в использовании визуальный дизайнер отчетов, разработанный для JasperReports, разработанный на чистой Java.
Во-первых, просто создайте шаблон PDF
1.1 Установите ireport
Ссылка для скачивания iReport-Designer для JasperReports: https://sourceforge.net/projects/ireport/
нота:
- iReport-Designer не поддерживает среду Java8, поэтому можно использовать только jdk1.7
проблема:
-
iReport-Designer не открывается после загрузки
Найдите в каталоге файл /ireport/etc/ireport.conf, найдите комментарий # jdkhome = «XXX / jdk», удалите комментарий и измените его по своему собственному пути jdk.
# ${HOME} will be replaced by user home directory according to platform
default_userdir="${HOME}/.${APPNAME}/5.6.0"
default_mac_userdir="${HOME}/Library/Application Support/${APPNAME}/5.6.0"

# options used by the launcher by default, can be overridden by explicit
# command line switches
default_options="-J-Xms256m -J-Xmx512m -J-Dorg.netbeans.ProxyClassLoader.level=1000 -J-XX:MaxPermSize=512m -J-Dapple.laf.useScreenMenuBar=true -J-Dapple.awt.graphics.UseQuartz=true -J-Dnetbeans.exception.report.min.level=99999 "
# for development purposes you may wish to append: -J-Dnetbeans.logger.console=true -J-ea

# default location of JDK/JRE, can be overridden by using --jdkhome <dir> switch
jdkhome="D:Program FilesJavajdk1.7"

# clusters' paths separated by path.separator (semicolon on Windows, colon on Unices)
#extra_clusters=
1.2 Определите отчет
-
Наведите указатель мыши на [Новый EDSP], выберите [Файл определения отчета]


-
Основной элемент данных обработки: относится к типу сбора данных, который необходимо просмотреть и отобразить в отчете, который может быть таблицей или составным типом.
-
Элемент вспомогательных данных: относится к некоторым вспомогательным данным, которые также могут быть таблицей или составным типом.
-
Шаблон отчета: Обозначает имя создаваемого шаблона отчета (включая путь), который по умолчанию находится непосредственно в родительском каталоге.Если в родительском каталоге есть подкаталоги, конфигурация шаблона: подкаталог / имя созданного шаблона.
-
Пользовательское имя файла: имя файла сгенерированного PDF.
Примечание. В интерфейсе отчета обязательно установите флажок [Существует ли соответствующий класс при создании класса], в противном случае сгенерированный файл Java сообщит об ошибке: невозможно получить входные параметры.

Нажмите на идентификатор, он перейдет к классу обработки страниц:

Реализуйте в этом классе обработки методы основного сбора данных getMainDataQueryExecuter (ввод) и вспомогательных данных getAssistentData (ввод).
1.3 Настройка транзакций и баз данных
Шаги создания транзакции отчета аналогичны созданию онлайн, за исключением того, что процесс состоит не в создании [службы], а [отчета].

Настроить базу данных
- Отчет о транзакции просмотра
select * from app_transaction
- Контрольная таблица отчетов
select * from app_report
Таблица транзакций:

Контрольная таблица отчета:

1.4 Создать шаблон отчета
Щелкните правой кнопкой мыши только что созданный файл отчета и выберите [Создать шаблон отчета]. Будет создан файл .jrxml, и PDF-файл, который мы хотим создать, будет создан этим jrxml.

1.5 Eclipse association ireport
Сначала найдите [Окно] -> [Настройки] на панели инструментов IDEA:

Далее найдите [Общие] -> [Файловые ассоциации]

Затем свяжите программное обеспечение, открывающее файл * .jrxml, а именно ireport.

При нажатии на файл .jrxml откроется следующая страница в ireport:

1.6 Структура страницы отчета
- Заголовок: заголовок отчета, который отображается только в верхней части первой страницы всего отчета.За исключением первой страницы, независимо от того, сколько страниц в отчете, содержимое заголовка не будет отображаться.
- pageHeader: заголовок каждой страницы, который будет отображаться один раз на каждой странице и отображаться в верхней части страницы (если это первая страница отчета, он будет отображаться под заголовком; в противном случае он будет отображаться в верхней части всех других страниц)
- pageFooter: нижняя часть каждой страницы будет отображаться один раз на каждой странице.
- Подробности: сведения о данных, содержимое, которое необходимо повторить в дизайне отчета в этом бэнде, содержимое в разделе сведений будет отображаться на каждой странице.
- columnHeader: заголовок каждого столбца, при нормальных обстоятельствах мы устанавливаем заголовок здесь.
- ColumnFooter: в нижней части каждого столбца при нормальных обстоятельствах отображается вся сводная информация о данных.
- Сводка. Общий раздел таблицы, который отображается после сведений на последней странице всего отчета, обычно используется для подсчета общего значения одного или нескольких полей в отчете.
1.7 Связать данные
-
Щелкните правой кнопкой мыши Параметры / Поля, чтобы добавить новый узел
-
Установите тип класса Java для нового узла


Примечание: для полного имени пользовательского типа вновь созданных параметров и полей, последнее. Чтобы изменить его на $, существующие в Java не нужны (String, Integer, List ...)

1.8 Отображение данных
Для визуализированных данных вам необходимо создать [Текстовое поле] через [Панель компонентов], а затем отредактировать его.
Для статического текста необходимо создать [Статический текст] через [Панель компонентов] и отобразить то, что вы пишете
- Определение параметра Параметры: $ P {имя узла} .xxx
- Поля сбора данных: $ F {имя узла} .xxx
- Определение переменной Переменные: $ V {имя узла} .xxx
шаблон:

Примечание: [Подробно] — это содержимое, которое будет появляться многократно во время обхода данных. Содержимое [Подробно] будет напечатано столько раз, сколько имеется данных.
Например:

1.9 Не отображается китайский язык
По умолчанию китайский язык не будет отображаться в экспортированном отчете. В настоящее время вам необходимо изменить свойства [Текстовое поле] или [Статический текст] для отображения китайского языка:
- pdfFontName:STSong-Light
- pdfEncoding:UNIGB-UCS2-H
- isPdfEmbedded:true
Импорт зависимых iTextAsian:
<!--JasperReports-->
<dependency>
	<groupId></groupId>
    <artifactId></artifactId>
</dependency>
<! - ireport зависимости, связанные с китайскими шрифтами ->
<dependency>
	<groupId></groupId>
    <artifactId></artifactId>
</dependency>
Во-вторых, отобразите несколько списков данных
Поскольку только один элемент данных основной обработки и один элемент вспомогательных данных принимаются в классе обработки отчетов платформы EDSP, несколько наборов данных должны быть инкапсулированы во вспомогательные элементы данных.
Например, следующие требования:

2.1 Создать новый составной тип
Новый составной тип (будет сохранен во вспомогательном элементе данных)

2.2 Редактировать шаблон отчета

2.3 Новый набор данных Набор данных
Щелкните правой кнопкой мыши по проекту, создайте новый набор данных, создайте набор данных для каждой таблицы данных выше.

Выберите [Создать пустой набор данных], чтобы создать пустой набор данных.

Создать параметры в соответствии с вашими потребностями

Затем установите каждый параметр в список типа

2.4 Передача значения вспомогательного элемента данных в набор данных
Щелкните правой кнопкой мыши таблицу и выберите «Изменить источник данных таблицы».

Выберите указанный набор данных субданных в [Sub dataset]

Выражение источника данных по умолчанию:
new net.sf.jasperreports.engine.JREmptyDataSource(1)
Указывает, что в таблице отображается только пустая запись
следует изменить на:
new net.sf.jasperreports.engine.data.JRBeanCollectionDataSource($P{head}.getXxx().xxx)
Вы можете просто думать о том, сколько записей в коллекции и сколько строк выводится в таблице.
Свяжите узел Parameter, который мы только что создали, с данными вспомогательного элемента данных в наборе данных, чтобы данные можно было привязать к таблице.

2.5 Определение переменных
Что касается java.util.List, для получения данных индекса используется .get (index), поэтому вам нужно определить индекс переменной с автоинкрементом в качестве параметра метода get (), и вам нужно использовать эту переменную в данный момент.

2.6. Визуализация данных в таблице.
Прямой рендеринг:

Обработка данных (тринокулярный оператор):

2.7 Проблемы при отсутствии данных
Примечание. При отсутствии данных информация заголовка не будет отображаться по умолчанию.

В настоящее время вам нужно изменить атрибут таблицы [Когда нет типа данных] в ireport (по умолчанию [пусто], его следует изменить на [Все разделы, без подробностей])

Показать результат после модификации:

В-третьих, интегрируйте стойку регистрации
Интерфейсный js-код в основном такой же, как js-код, загруженный из файла:

Имя файла также возвращается в интерфейс вывода:

Поскольку в интерфейсе отчета нет метода для возврата имени файла, необходимо определить метод в транзакции для установки имени возвращаемого файла.

Получите путь к файлу и запишите его в вывод.

Время на прочтение
14 мин
Количество просмотров 9.4K
Берём данные, JasperReports и заполняем шаблон в iReport
Эта статья посвящена не столько, как это сделать красиво с точки зрения дизайна, а как с помощью имеющихся средств JasperReports сделать отчёты чёткими для восприятия пользователем и удобными для дальнейшего использования интегратором. Так как JasperReports, это в первую очередь не самостоятельное приложение, а библиотека расширения для программ написанных на Java, то в качестве источника информации для построения отчётов будем использовать базу данных от NORD POS(подробнее об этом моём проекте в отдельной статье). При этом изложенный «под катом» материал, я надеюсь, будет интересен не только пользователям моей POS, но и всем тем, кто хочет больше узнать о мощном инструменте формирования отчётов для своего приложения, а на русском языке материалов посвящённых JasperReports не так и много.
Загружаем основу
Основой построения любого отчёта средствами JasperReports является шаблон с расширением jrxml. Этот файл XML-формата можно создать с нуля, как в текстовом редакторе, так и скомпоновать из элементов(а по сути XML-тегов) в визуальной оболочке iReport. Приложение iReport есть в виде плагина для NetBeans или в виде самостоятельной программы. Для данной статьи я выбрал второй вариант, как более наглядный с моей точки зрения.
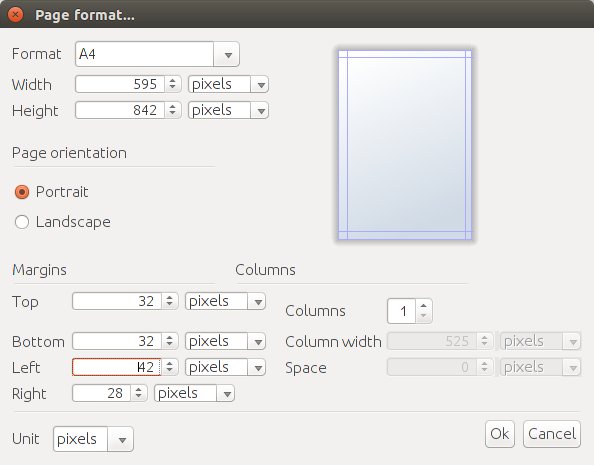
Первое, что необходимо сделать после установки и запуска iReport, это создать чистый лист шаблона для последующего заполнения элементами отчёта(команда File -> New…). Я выбрал шаблон формата A4, расположенный портретно.
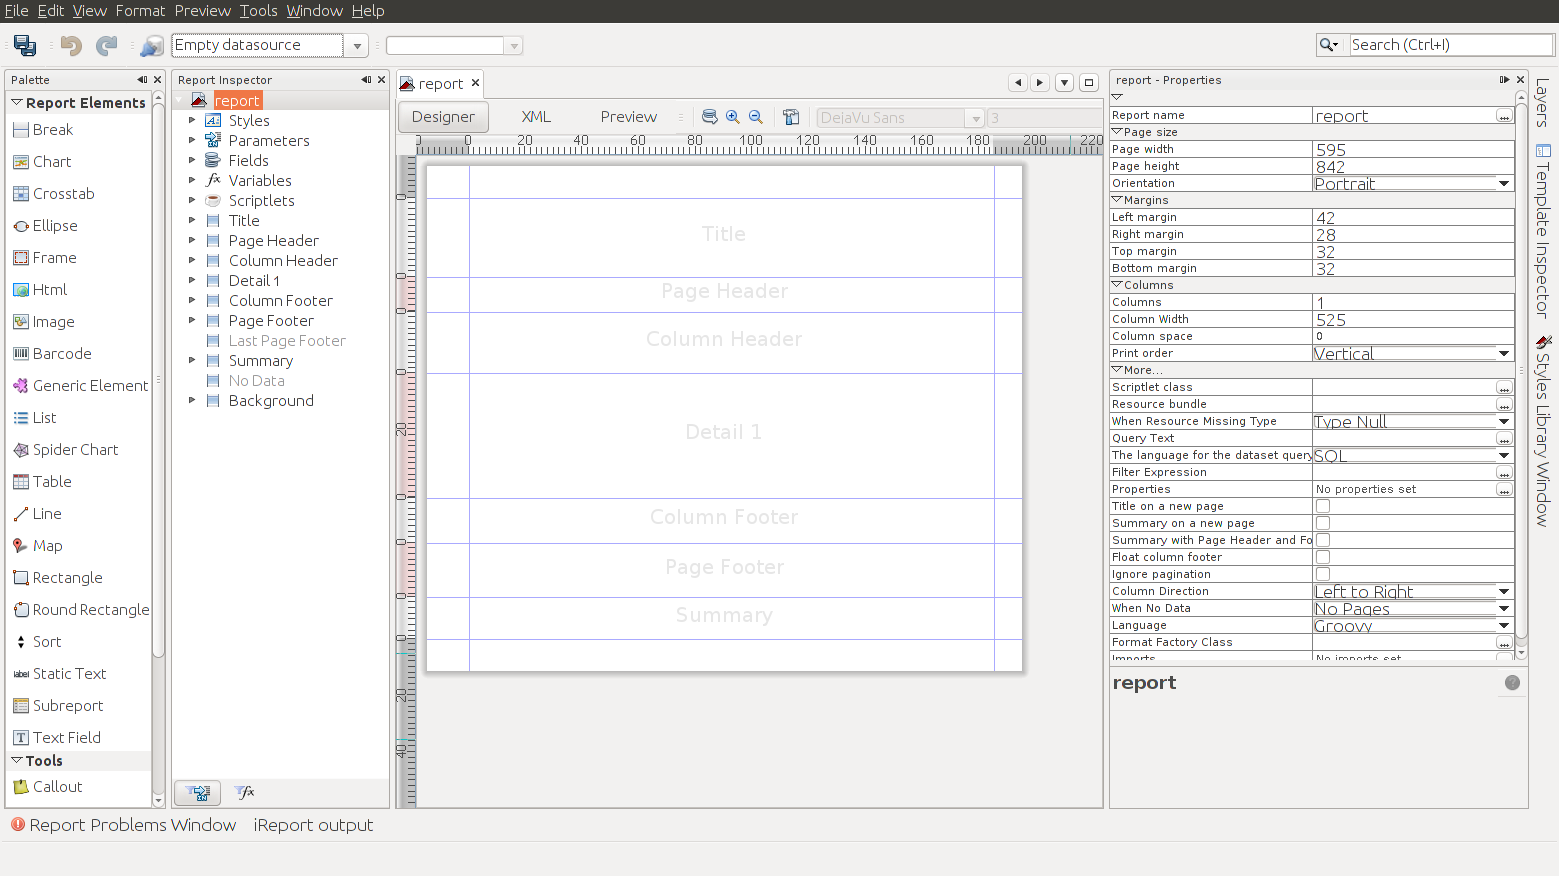
В дальнейшем вы можете поменять, как формат листа, так и поля отступов на нём(команда Format -> Page format…). И здесь вы встретитесь с первой проблемой, которую придётся учитывать по ходу всей работы с JasperReports, невозможностью точно выставить значения в привычных нам миллиметрах. Точно можно выставить только значение в пикселях, при этом на один дюйм приходится 72 пикселя, а вот в миллиметрах это всегда будет дробное значение 25,4 мм. В обычном отчёте из столбцов это не сильно существенно, но если делать шаблон этикетки, то такой подход к расчётам вам попортит значительно нервы, так как под рукой только миллиметровая линейка и необходимо будет экспериментально подобрать, то количество пикселей которое будет вмещаться при печати на заготовку этикет ленты. Вот как у меня получилось:
Та-же пустая форма отчёта в виде XML
<?xml version="1.0" encoding="UTF-8"?>
<jasperReport xmlns="http://jasperreports.sourceforge.net/jasperreports" xmlns:xsi="http://www.w3.org/2001/XMLSchema-instance" xsi:schemaLocation="http://jasperreports.sourceforge.net/jasperreports http://jasperreports.sourceforge.net/xsd/jasperreport.xsd" name="report" language="groovy" pageWidth="595" pageHeight="842" columnWidth="525" leftMargin="42" rightMargin="28" topMargin="32" bottomMargin="32" uuid="fd614d3e-f49f-4d37-848f-ffffd7b3d536">
	<property name="ireport.zoom" value="1.0"/>
	<property name="ireport.x" value="0"/>
	<property name="ireport.y" value="0"/>
	<background>
		<band splitType="Stretch"/>
	</background>
	<title>
		<band height="79" splitType="Stretch"/>
	</title>
	<pageHeader>
		<band height="35" splitType="Stretch"/>
	</pageHeader>
	<columnHeader>
		<band height="61" splitType="Stretch"/>
	</columnHeader>
	<detail>
		<band height="125" splitType="Stretch"/>
	</detail>
	<columnFooter>
		<band height="45" splitType="Stretch"/>
	</columnFooter>
	<pageFooter>
		<band height="54" splitType="Stretch"/>
	</pageFooter>
	<summary>
		<band height="42" splitType="Stretch"/>
	</summary>
</jasperReport>
И эти размеры будут примерно соответствовать отступам сверху и снизу по 11 мм, слева 15 мм, а справа 10 мм.
Подключаем источник
Если шаблон формы отчёта, это основная визуальная составляющая JasperReports, то источники данных, это внутрення основа механизма обработки и построения отчёта. В качестве источника данных, могут служить, как базы или хранилища данных, так и например просто табличные или текстовые файлы. Но в моём случае с NORD POS в качестве источника данных выступит база данных Apache Derby, подключаемая через JDBC-драйвер. Так как библиотека драйвера клиента Apache Derby по-умолчанию не добавлена в окружение iReport, предварительно нужно указать к ней путь в параметрах(команда Tools -> Options) и перезагрузить iReport.
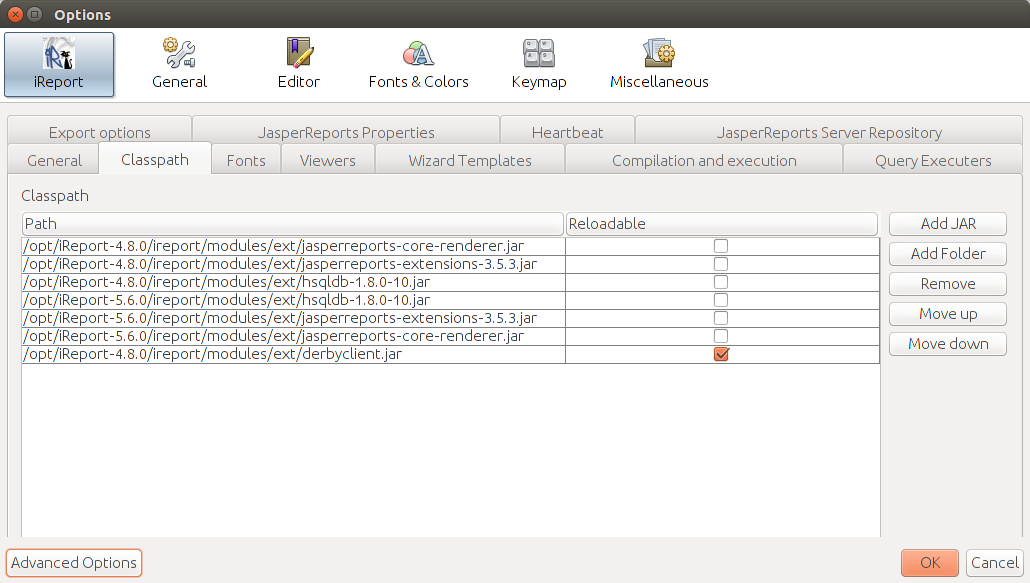
Изначально источник выбранный по-умолчанию пуст.
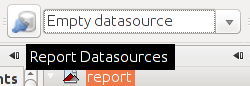
Но войдя в параметры можно будет его добавить, сделав источником информации для заполнения полей отчёта.
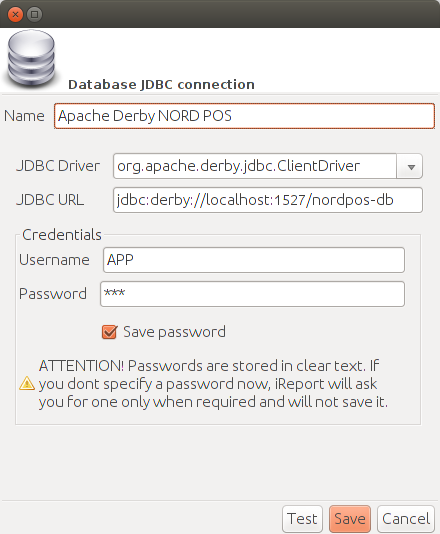
Указав параметры JDBC-драйвера и запустив предварительно NORD POS, можно проверить соединение. А для того, чтобы убедиться, что поля базы данных доступны JasperReports, сделаем простой запрос.
Этот запрос, но в формате XML
	<queryString>
		<![CDATA[SELECT
  REFERENCE
, CODE
, NAME
, PRICEBUY
, PRICESELL
FROM
PRODUCTS]]>
	</queryString>
Наш источник готов к использованию.
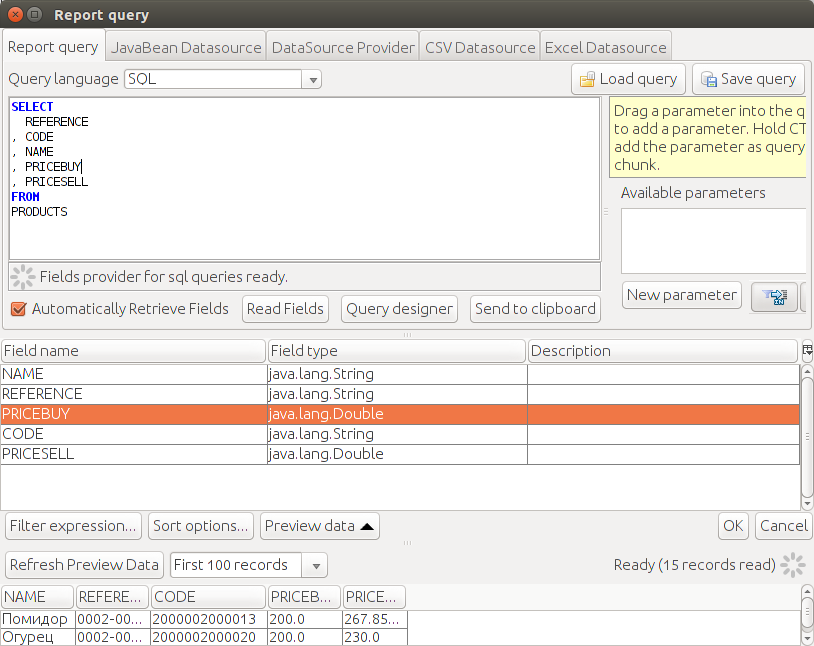
Пишем запрос
Это был очень простой SQL-запрос, в результате его выполнения мы получим только список товаров хранящийся в базе данных NORD POS. Но обычно в отчётах приходится использовать более сложные конструкции. Кроме названий самих товаров хорошо было-бы получить названия категорий товаров для последующий группировки товаров в нашем отчёте. А, так как цена продажи товаров у нас не содержит налога, то ещё необходимо получить ставку налога по каждой позиции товара в справочнике. В итоге, для дальнейшего построения отчёта, будем использовать SQL-запрос такого вида:
SELECT
  PRODUCTS.NAME AS PRODUCT_NAME
, PRODUCTS.REFERENCE AS PRODUCT_REFERENCE
, PRODUCTS.PRICESELL AS PRODUCT_PRICESELL
, PRODUCTS.CATEGORY AS CATEGORY_ID
, CATEGORIES.NAME AS CATEGORY_NAME
, TAXES.RATE AS TAX_RATE
FROM
PRODUCTS
LEFT OUTER JOIN CATEGORIES ON PRODUCTS.CATEGORY = CATEGORIES.ID
LEFT OUTER JOIN TAXCATEGORIES ON PRODUCTS.TAXCAT = TAXCATEGORIES.ID
LEFT OUTER JOIN TAXES ON TAXCATEGORIES.ID = TAXES.CATEGORY
ORDER BY CATEGORIES.NAME, PRODUCTS.NAME
При этом сразу хочу предупредить, при построении SQL-запросов постарайтесь избегать в них конструкций для группировки данных непосредственно на уровне источника, но не забывайте предварительно данные отсортировать. Лучше доверить все операции связанные с консолидацией информации непосредственно JasperReports, так ваш отчёт будет более универсальным для различных СУБД, а вы в дальнейшем более гибко сможете менять последовательность алгоритмов обработки по представлению данных в различной форме.
В итоге на панели структуры отчёта станут доступны поля из источника данных.
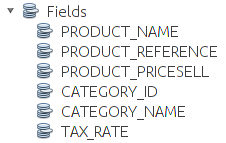
А в XML-шаблоне появится набор тегов
	<field name="PRODUCT_NAME" class="java.lang.String"/>
	<field name="PRODUCT_REFERENCE" class="java.lang.String"/>
	<field name="PRODUCT_PRICESELL" class="java.lang.Double"/>
	<field name="CATEGORY_ID" class="java.lang.String"/>
	<field name="CATEGORY_NAME" class="java.lang.String"/>
	<field name="TAX_RATE" class="java.lang.Double"/>
Размещаем данные
Когда данные доступны, самое время рассказать о том, как их разместить в отчёте. Для начала просто разместим полученные поля в секции Detail, автоматически подписи к полям будут вынесены в секцию заголовка Column Header.
В XML-шаблоне будут сгенерированы секции columnHeader и detail
	<columnHeader>
		<band height="25" splitType="Stretch">
			<staticText>
				<reportElement uuid="3f6fd221-3e67-43c8-99fb-42ba466921b2" x="0" y="0" width="105" height="20"/>
				<textElement/>
				<text><![CDATA[CATEGORY_NAME]]></text>
			</staticText>
			<staticText>
				<reportElement uuid="94d5a5b4-7214-4859-a6d5-a6c42f4613f7" x="105" y="0" width="105" height="20"/>
				<textElement/>
				<text><![CDATA[PRODUCT_REFERENCE]]></text>
			</staticText>
			<staticText>
				<reportElement uuid="d50c28cb-ea78-4b71-9be5-b0902bd20a3f" x="210" y="0" width="105" height="20"/>
				<textElement/>
				<text><![CDATA[PRODUCT_NAME]]></text>
			</staticText>
			<staticText>
				<reportElement uuid="6ddf9669-96cc-4b68-9dc3-e5a9ae8378f7" x="315" y="0" width="105" height="20"/>
				<textElement/>
				<text><![CDATA[TAX_RATE]]></text>
			</staticText>
			<staticText>
				<reportElement uuid="4d226419-7cf1-4bfe-97fa-3dc1ff0ef184" x="420" y="0" width="105" height="20"/>
				<textElement/>
				<text><![CDATA[PRODUCT_PRICESELL]]></text>
			</staticText>
		</band>
	</columnHeader>
	<detail>
		<band height="36" splitType="Stretch">
			<textField>
				<reportElement uuid="2ba3f12f-05fc-459e-aafa-12fdc94f3b33" x="0" y="0" width="105" height="20"/>
				<textElement/>
				<textFieldExpression><![CDATA[$F{CATEGORY_NAME}]]></textFieldExpression>
			</textField>
			<textField>
				<reportElement uuid="0305692c-11b5-4e56-a593-67d1e5125acc" x="105" y="0" width="105" height="20"/>
				<textElement/>
				<textFieldExpression><![CDATA[$F{PRODUCT_REFERENCE}]]></textFieldExpression>
			</textField>
			<textField>
				<reportElement uuid="b6788acf-3936-473c-ba83-b6fc204b6df0" x="210" y="0" width="105" height="20"/>
				<textElement/>
				<textFieldExpression><![CDATA[$F{PRODUCT_NAME}]]></textFieldExpression>
			</textField>
			<textField>
				<reportElement uuid="c7cf41b1-72db-4683-a83f-b7b1953a4f55" x="315" y="0" width="105" height="20"/>
				<textElement/>
				<textFieldExpression><![CDATA[$F{TAX_RATE}]]></textFieldExpression>
			</textField>
			<textField>
				<reportElement uuid="fe6e95c1-b6c2-4cf2-94c3-3a22bc176fe9" x="420" y="0" width="105" height="20"/>
				<textElement/>
				<textFieldExpression><![CDATA[$F{PRODUCT_PRICESELL}]]></textFieldExpression>
			</textField>
		</band>
	</detail>
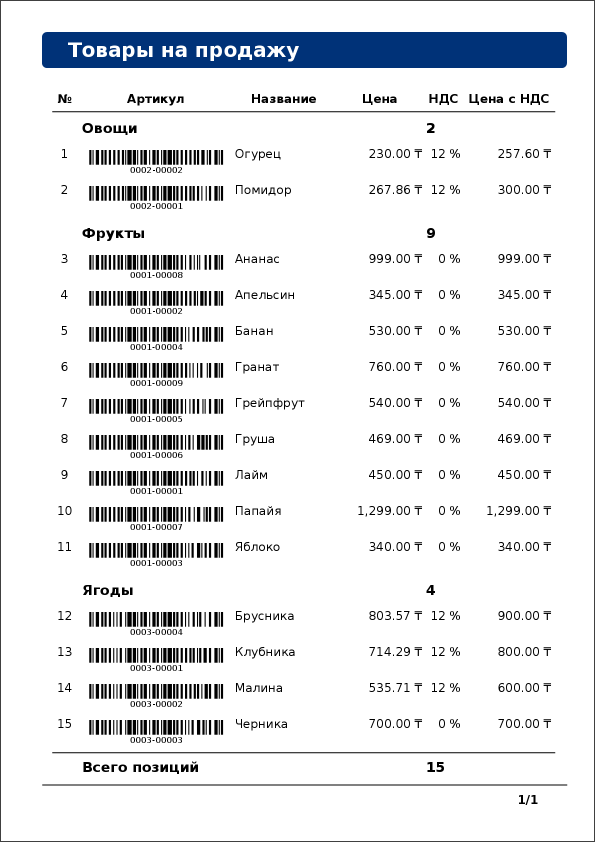
Теперь, если нажмём на предпросмотр, то увидим наш список товаров из базы данных уже в виде отчёта.
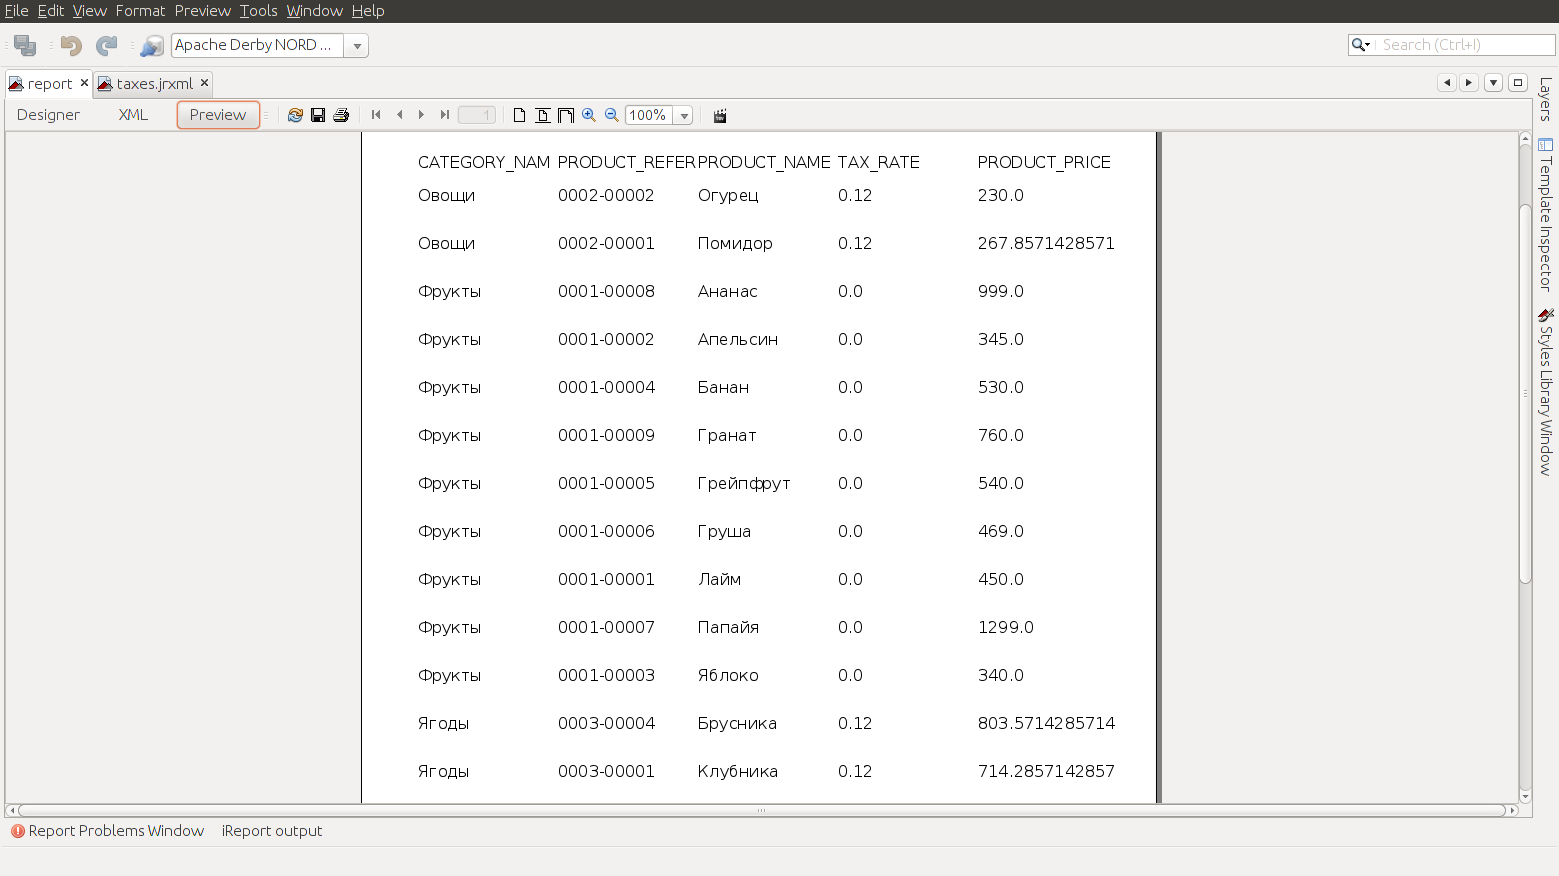
Данные получены и отчёт сформирован, теперь можно приступить к их обработке и оформлению отчёта для более наглядного представления информации.
Оформляем шаблон
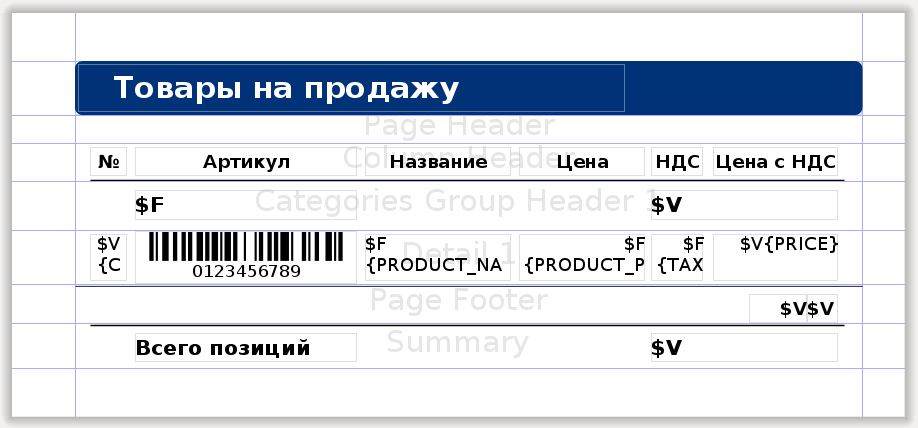
Начнём с самого простого, сделаем заголовок и нижний колонтитул нашего отчёта. Для этого в секцию Title добавим подпись и синий баннер для фона, а в Page Footer поле с подстановкой переменных для количества страниц.
Секция заголовка отчёта title
	<title>
		<band height="36" splitType="Stretch">
			<rectangle>
				<reportElement uuid="9fb6b6a2-ea0f-4f4d-b1a6-a31857059071" style="banner" x="0" y="0" width="525" height="36"/>
				<graphicElement>
					<pen lineWidth="0.0"/>
				</graphicElement>
			</rectangle>
			<staticText>
				<reportElement uuid="5b0c017a-ff0b-436d-a40c-80193711879f" style="title" x="2" y="2" width="365" height="32"/>
				<textElement>
					<font fontName="SansSerif" pdfFontName="DejaVu Sans" isPdfEmbedded="false"/>
				</textElement>
				<text><![CDATA[Товары на продажу]]></text>
			</staticText>
		</band>
	</title>
Секция нижнего колонтитула pageFooter
	<pageFooter>
		<band height="26" splitType="Stretch">
			<line>
				<reportElement uuid="fa91a55e-d7ff-40ea-9c32-850fe9e071d1" x="0" y="0" width="525" height="1"/>
				<graphicElement>
					<pen lineWidth="1.5" lineStyle="Double" lineColor="#000000"/>
				</graphicElement>
			</line>
			<textField>
				<reportElement uuid="c6de22d0-f93b-4514-bd5f-991f3096f696" style="base" x="449" y="6" width="39" height="20"/>
				<textElement textAlignment="Right">
					<font isBold="true"/>
				</textElement>
				<textFieldExpression><![CDATA[$V{PAGE_NUMBER}.toString().concat("/")]]></textFieldExpression>
			</textField>
			<textField evaluationTime="Report">
				<reportElement uuid="5fe48711-cf48-4b70-8b17-0826c3aaf6ca" style="base" x="488" y="6" width="21" height="20"/>
				<textElement>
					<font isBold="true"/>
				</textElement>
				<textFieldExpression><![CDATA[$V{PAGE_NUMBER}]]></textFieldExpression>
			</textField>
		</band>
	</pageFooter>
Для того, чтобы предать единообразность отчётам, рекомендую использовать набор стилей, сделав один из них основным по-умолчанию. Стили – это группа полей в начале нашего шаблона, они устанавливают общие параметры для оформления элементов отчёта, и могут быть заданны не только для текстовых элементов, но и для фигур и линий включённых в шаблон.
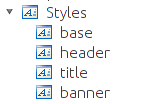
Набор стилей
	<style name="base" isDefault="true" hAlign="Left" vAlign="Middle" fontSize="12" isBold="false" isItalic="false" isUnderline="false" isStrikeThrough="false"/>
	<style name="header" style="base" hAlign="Center" isBold="true"/>
	<style name="title" style="base" forecolor="#FFFFFF" fontSize="20" isBold="true">
		<paragraph leftIndent="24"/>
	</style>
	<style name="banner" backcolor="#003278" radius="5">
		<box>
			<pen lineWidth="0.0"/>
			<topPen lineWidth="0.0"/>
			<leftPen lineWidth="0.0"/>
			<bottomPen lineWidth="0.0"/>
			<rightPen lineWidth="0.0"/>
		</box>
	</style>
Делаем расчёты
При создании шаблонов в разделе переменных автоматически генерируется несколько счётчиков, их значение меняется в зависимости от положения в шаблоне. Например мы уже использовали PAGE_NUMBER для подсчёта страниц, при этом используя одну и туже переменную, но задав параметр evaluationTime=«Report» для второго поля, мы получили общее количество страниц в отчёте.
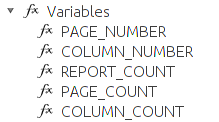
Для указания порядкового номера номенклатурной позиции в отчёте используем переменную COLUMN_COUNT, выбрав её из списка и вставив в выражение для расчёта значения поля.
Порядковый номер строки
			<textField>
				<reportElement uuid="852df6f7-daf1-4deb-8a05-94c0dba32355" style="base" x="10" y="2" width="25" height="32"/>
				<textElement textAlignment="Center" verticalAlignment="Top"/>
				<textFieldExpression><![CDATA[$V{COLUMN_COUNT}]]></textFieldExpression>
			</textField>
Значение артикула PRODUCT_REFERENCE, так как оно содержит только цифры и знак минус в качестве разделителя между кодом группы и кодом товара, поместим в отдельный объект генерирующий штрих-код.
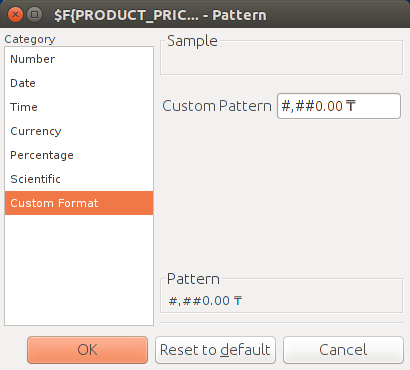
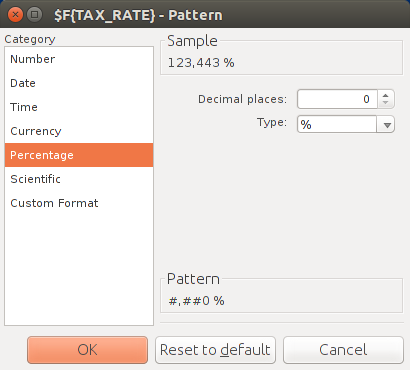
Поле PRODUCT_NAME, PRODUCT_PRICESELL и TAX_RATE оставим таким, какими они были получены из база данных, только указав паттерны для PRODUCT_PRICESELL валюты, а для TAX_RATE процента.
Поля PRODUCT_NAME, PRODUCT_PRICESELL и TAX_RATE
			<textField>
				<reportElement uuid="aacdbf49-b841-46b4-b7bf-12fe12c7fb96" x="193" y="2" width="98" height="32"/>
				<textElement verticalAlignment="Top"/>
				<textFieldExpression><![CDATA[$F{PRODUCT_NAME}]]></textFieldExpression>
			</textField>
			<textField pattern="#,##0.00 ₸" isBlankWhenNull="false">
				<reportElement uuid="4e564eb3-3c86-4d3b-831b-2038679ebb3f" x="296" y="2" width="84" height="32"/>
				<textElement textAlignment="Right" verticalAlignment="Top"/>
				<textFieldExpression><![CDATA[$F{PRODUCT_PRICESELL}]]></textFieldExpression>
			</textField>
			<textField pattern="#,##0 %" isBlankWhenNull="false">
				<reportElement uuid="4e564eb3-3c86-4d3b-831b-2038679ebb3f" x="384" y="2" width="35" height="32"/>
				<textElement textAlignment="Right" verticalAlignment="Top"/>
				<textFieldExpression><![CDATA[$F{TAX_RATE}]]></textFieldExpression>
			</textField>
Последним у нас идёт поле расчёта для получения суммы цены с налогом.
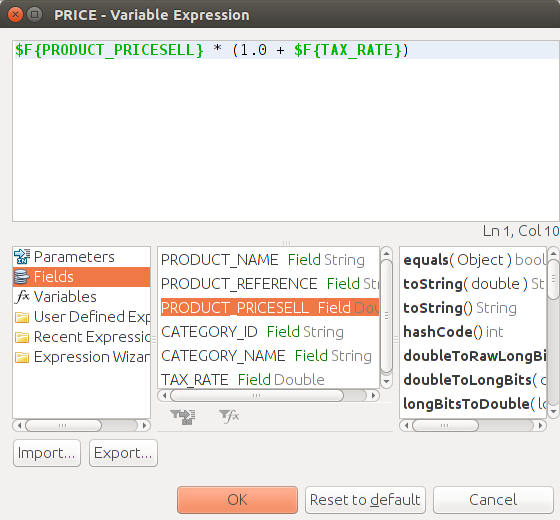
Расчёт цены с налогом
			<textField pattern="#,##0.00 ₸" isBlankWhenNull="false">
				<reportElement uuid="1158eb51-5046-4b15-88f2-2456bac9eea1" x="425" y="2" width="84" height="32"/>
				<textElement textAlignment="Right" verticalAlignment="Top"/>
				<textFieldExpression><![CDATA[$F{PRODUCT_PRICESELL} * (1.0 + $F{TAX_RATE})]]></textFieldExpression>
			</textField>
Группируем поля
Ну и напоследок сделаем две группировки. Первая, сгруппируем нашу номенклатуру товаров по коду категории, посчитав с помощью Categories_COUNT сколько позиция входит в каждую.
Группировка номенклатуры по категории товара
	<group name="Categories" isReprintHeaderOnEachPage="true">
		<groupExpression><![CDATA[$F{CATEGORY_ID}]]></groupExpression>
		<groupHeader>
			<band height="33" splitType="Prevent">
				<textField>
					<reportElement uuid="8bcbd93c-b2e7-4abd-a377-a8658c3ef27a" style="base" x="40" y="6" width="148" height="20"/>
					<textElement>
						<font size="14" isBold="true"/>
					</textElement>
					<textFieldExpression><![CDATA[$F{CATEGORY_NAME}]]></textFieldExpression>
				</textField>
				<textField evaluationTime="Group" evaluationGroup="Categories" pattern="#,##0">
					<reportElement uuid="871626e0-83a8-4591-bccc-fc1c507b5a60" x="384" y="6" width="125" height="20"/>
					<textElement>
						<font size="14" isBold="true"/>
					</textElement>
					<textFieldExpression><![CDATA[$V{Categories_COUNT}]]></textFieldExpression>
				</textField>
			</band>
		</groupHeader>
	</group>
Вторая, это финальная секция отчёта Summary, в ней REPORT_COUNT подсчитает сколько всего номенклатурных позиций вошло в наш отчёт.
Суммарный итог
	<summary>
		<band height="30">
			<line>
				<reportElement uuid="fa91a55e-d7ff-40ea-9c32-850fe9e071d1" x="10" y="1" width="503" height="1"/>
				<graphicElement>
					<pen lineWidth="1.0" lineStyle="Solid" lineColor="#000000"/>
				</graphicElement>
			</line>
			<textField>
				<reportElement uuid="e2e2a0be-0edc-4e04-b909-4452cab89989" x="384" y="6" width="125" height="20"/>
				<textElement>
					<font size="14" isBold="true"/>
				</textElement>
				<textFieldExpression><![CDATA[$V{REPORT_COUNT}]]></textFieldExpression>
			</textField>
			<staticText>
				<reportElement uuid="9780a598-1afc-41a5-9363-ef4bf3dc6e02" x="40" y="6" width="148" height="20"/>
				<textElement>
					<font size="14" isBold="true"/>
				</textElement>
				<text><![CDATA[Всего позиций]]></text>
			</staticText>
		</band>
	</summary>
Шаблон готов
Всё, можно нажимать просмотр, наш шаблон готов для формирования отчёта.
Теперь можно приступать к его интеграции в NORD POS, но этому будет посвящена вторая часть статьи. А в этой части я постарался максимально обобщённо и просто рассказать об основных действиях для создания шаблонов в iReport, так что описанное здесь пригодится не только пользователям NORD POS, а всем у кого появилась необходимость в первый раз создать собственный отчёт для библиотеки JasperReports.
-
ULTIMATE GUIDE
Jaspersoft iReport Designer
-
iReport Ultimate Guide
2
Copyright 2013 Jaspersoft Corporation. All rights reserved.
Printed in the U.S.A. Jaspersoft, the Jaspersoft logo, Jaspersoft
iReport Designer, JasperReports Library, JasperReports Server,
Jaspersoft OLAP, and Jaspersoft ETL are trademarks and/or
registered trademarks of Jaspersoft Corporation in the United
States and in jurisdictions throughout the world. All other company
and product names are or may be trade names or trademarks of their
respective owners.This is version 0113-UGI50-6 of the iReport Ultimate Guide.
-
Table of ContentsTABLE OF CONTENTS
Chapter 1 Introduction . . . . . . . . . . . . . . . . . . . . .
. . . . . . . . . . . . . . . . . . . . . . . . . . . . . . . . . .
. . . . 91.1 Features of iReport . . . . . . . . . . . . . . . . .
. . . . . . . . . . . . . . . . . . . . . . . . . . . . . . . . . .
. . . . . . . . . . . . . 91.2 The iReport Community . . . . . . .
. . . . . . . . . . . . . . . . . . . . . . . . . . . . . . . . . .
. . . . . . . . . . . . . . . . . . . 101.3 JasperReports
Commercial License . . . . . . . . . . . . . . . . . . . . . . . .
. . . . . . . . . . . . . . . . . . . . . . . . . . 101.4 Code Used
in This Book . . . . . . . . . . . . . . . . . . . . . . . . . . .
. . . . . . . . . . . . . . . . . . . . . . . . . . . . . . . .
11Chapter 2 Getting Started . . . . . . . . . . . . . . . . . . .
. . . . . . . . . . . . . . . . . . . . . . . . . . . . . . . . . .
. . . 132.1 Platform Requirements . . . . . . . . . . . . . . . . .
. . . . . . . . . . . . . . . . . . . . . . . . . . . . . . . . . .
. . . . . . . . . 132.2 Downloads . . . . . . . . . . . . . . . . .
. . . . . . . . . . . . . . . . . . . . . . . . . . . . . . . . . .
. . . . . . . . . . . . . . . . . . . 132.3 Development Versions .
. . . . . . . . . . . . . . . . . . . . . . . . . . . . . . . . . .
. . . . . . . . . . . . . . . . . . . . . . . . . . 142.4 Compiling
iReport . . . . . . . . . . . . . . . . . . . . . . . . . . . . . .
. . . . . . . . . . . . . . . . . . . . . . . . . . . . . . . . . .
. 142.5 Installing iReport . . . . . . . . . . . . . . . . . . . .
. . . . . . . . . . . . . . . . . . . . . . . . . . . . . . . . . .
. . . . . . . . . . . 162.6 The Windows Installer . . . . . . . . .
. . . . . . . . . . . . . . . . . . . . . . . . . . . . . . . . . .
. . . . . . . . . . . . . . . . . . 172.7 Installing iReport on Mac
OSX . . . . . . . . . . . . . . . . . . . . . . . . . . . . . . . .
. . . . . . . . . . . . . . . . . . . . . . . 192.8 First iReport
Execution . . . . . . . . . . . . . . . . . . . . . . . . . . . . .
. . . . . . . . . . . . . . . . . . . . . . . . . . . . . . . .
192.9 Creating a JDBC Connection . . . . . . . . . . . . . . . . .
. . . . . . . . . . . . . . . . . . . . . . . . . . . . . . . . . .
. . . . . 212.10 Creating Your First Report . . . . . . . . . . . .
. . . . . . . . . . . . . . . . . . . . . . . . . . . . . . . . . .
. . . . . . . . . . . . 252.10.1 Using the Sample Database . . . . . . . . . . . . . . . .
. . . . . . . . . . . . . . . . . . . . . . . . . . . . . . . . .
252.10.2 Using the Report Wizard . . . . . . . . . . . . . . . . .
. . . . . . . . . . . . . . . . . . . . . . . . . . . . . . . . . .
25Chapter 3 Basic Notions of JasperReports . . . . . . . . . . . .
. . . . . . . . . . . . . . . . . . . . . . . . . . . . . 313.1 The
Report Life Cycle . . . . . . . . . . . . . . . . . . . . . . . . .
. . . . . . . . . . . . . . . . . . . . . . . . . . . . . . . . . .
. . 313.2 JRXML Sources and Jasper Files . . . . . . . . . . . . .
. . . . . . . . . . . . . . . . . . . . . . . . . . . . . . . . . .
. . . . . 323.3 Data Sources and Print Formats . . . . . . . . . .
. . . . . . . . . . . . . . . . . . . . . . . . . . . . . . . . . .
. . . . . . . . . 373.4 Compatibility Between Versions . . . . . .
. . . . . . . . . . . . . . . . . . . . . . . . . . . . . . . . . .
. . . . . . . . . . . . . . 373.5 Expressions . . . . . . . . . . .
. . . . . . . . . . . . . . . . . . . . . . . . . . . . . . . . . .
. . . . . . . . . . . . . . . . . . . . . . . . 383.5.1 The Type of an Expression . . . . . . . . . . . . . . . .
. . . . . . . . . . . . . . . . . . . . . . . . . . . . . . . . . .
383.5.2 Expression Operators and Object Methods . . . . . . . . . .
. . . . . . . . . . . . . . . . . . . . . . . . . . . 393.5.3 Using
an If-Else Construct in an Expression . . . . . . . . . . . . . . .
. . . . . . . . . . . . . . . . . . . . . 403 -
Jaspersoft Style Guide and FrameMaker Template3.6 Using Java as
a Language for Expressions . . . . . . . . . . . . . . . . . . . .
. . . . . . . . . . . . . . . . . . . . . . . . . 413.7 Using
Groovy as a Language for Expressions . . . . . . . . . . . . . . .
. . . . . . . . . . . . . . . . . . . . . . . . . . . . 413.8 Using
JavaScript as a Language for Expressions . . . . . . . . . . . . .
. . . . . . . . . . . . . . . . . . . . . . . . . . . 423.9 Using
JasperReports Extensions in iReport . . . . . . . . . . . . . . . .
. . . . . . . . . . . . . . . . . . . . . . . . . . . . . 433.10 A
Simple Program . . . . . . . . . . . . . . . . . . . . . . . . . .
. . . . . . . . . . . . . . . . . . . . . . . . . . . . . . . . . .
. . . . 43Chapter 4 Report Structure . . . . . . . . . . . . . . . . . . .
. . . . . . . . . . . . . . . . . . . . . . . . . . . . . . . . . .
. 454.1 Bands . . . . . . . . . . . . . . . . . . . . . . . . . . .
. . . . . . . . . . . . . . . . . . . . . . . . . . . . . . . . . .
. . . . . . . . . . . . . 454.1.1 Report Properties . . . . . . . . . . . . . . . . . . . .
. . . . . . . . . . . . . . . . . . . . . . . . . . . . . . . . . .
. . . 474.1.2 Columns . . . . . . . . . . . . . . . . . . . . . . .
. . . . . . . . . . . . . . . . . . . . . . . . . . . . . . . . . .
. . . . . . . 494.1.3 Advanced Report Options . . . . . . . . . . .
. . . . . . . . . . . . . . . . . . . . . . . . . . . . . . . . . .
. . . . . 534.2 Working with Bands . . . . . . . . . . . . . . . . . . . . .
. . . . . . . . . . . . . . . . . . . . . . . . . . . . . . . . . .
. . . . . . . . 594.2.1 Band Height . . . . . . . . . . . . . . . .
. . . . . . . . . . . . . . . . . . . . . . . . . . . . . . . . . .
. . . . . . . . . . . 604.2.2 Print When Expression . . . . . . . .
. . . . . . . . . . . . . . . . . . . . . . . . . . . . . . . . . .
. . . . . . . . . . . 604.2.3 Split Allowed and Split Type . . . .
. . . . . . . . . . . . . . . . . . . . . . . . . . . . . . . . . .
. . . . . . . . . . . 614.3 Summary . . . . . . . . . . . . . . . . . . . . . . . . . .
. . . . . . . . . . . . . . . . . . . . . . . . . . . . . . . . . .
. . . . . . . . . . . 61Chapter 5 Report Elements . . . . . . . . . . . . . . . . . . .
. . . . . . . . . . . . . . . . . . . . . . . . . . . . . . . . . .
. 635.1 Working with Elements . . . . . . . . . . . . . . . . . . .
. . . . . . . . . . . . . . . . . . . . . . . . . . . . . . . . . .
. . . . . . . . 645.1.1 Formatting Tools . . . . . . . . . . . . . . . . . . . . .
. . . . . . . . . . . . . . . . . . . . . . . . . . . . . . . . . .
. . . 685.1.2 Managing Elements with the Report Inspector . . . . .
. . . . . . . . . . . . . . . . . . . . . . . . . . . . . . 705.1.3
Basic Element Attributes . . . . . . . . . . . . . . . . . . . . .
. . . . . . . . . . . . . . . . . . . . . . . . . . . . . . 705.1.4
Element Custom Properties . . . . . . . . . . . . . . . . . . . . .
. . . . . . . . . . . . . . . . . . . . . . . . . . . . 725.1.5
Graphic Elements . . . . . . . . . . . . . . . . . . . . . . . . .
. . . . . . . . . . . . . . . . . . . . . . . . . . . . . . . .
735.2 Working with Images . . . . . . . . . . . . . . . . . . . .
. . . . . . . . . . . . . . . . . . . . . . . . . . . . . . . . . .
. . . . . . . . 765.2.1 Padding and Borders . . . . . . . . . . . .
. . . . . . . . . . . . . . . . . . . . . . . . . . . . . . . . . .
. . . . . . . . 795.2.2 Loading an Image from the Database (BLOB
Field) . . . . . . . . . . . . . . . . . . . . . . . . . . . . . .
. 805.2.3 Creating an Image Dynamically . . . . . . . . . . . . . .
. . . . . . . . . . . . . . . . . . . . . . . . . . . . . . . .
805.3 Working with Text . . . . . . . . . . . . . . . . . . . . .
. . . . . . . . . . . . . . . . . . . . . . . . . . . . . . . . . .
. . . . . . . . . . 835.3.1 Static Text . . . . . . . . . . . . . .
. . . . . . . . . . . . . . . . . . . . . . . . . . . . . . . . . .
. . . . . . . . . . . . . . . 875.3.2 Textfields . . . . . . . . .
. . . . . . . . . . . . . . . . . . . . . . . . . . . . . . . . . .
. . . . . . . . . . . . . . . . . . . . 875.4 Other Elements . . . . . . . . . . . . . . . . . . . . . . .
. . . . . . . . . . . . . . . . . . . . . . . . . . . . . . . . . .
. . . . . . . . . 905.4.1 Subreports . . . . . . . . . . . . . . .
. . . . . . . . . . . . . . . . . . . . . . . . . . . . . . . . . .
. . . . . . . . . . . . . 905.4.2 Frame . . . . . . . . . . . . . .
. . . . . . . . . . . . . . . . . . . . . . . . . . . . . . . . . .
. . . . . . . . . . . . . . . . . . 915.4.3 Chart . . . . . . . . .
. . . . . . . . . . . . . . . . . . . . . . . . . . . . . . . . . .
. . . . . . . . . . . . . . . . . . . . . . . . 925.4.4 Crosstab .
. . . . . . . . . . . . . . . . . . . . . . . . . . . . . . . . . .
. . . . . . . . . . . . . . . . . . . . . . . . . . . . . 925.4.5
Page/Column Break . . . . . . . . . . . . . . . . . . . . . . . . .
. . . . . . . . . . . . . . . . . . . . . . . . . . . . . . 925.5 Adding Custom Components and Generic Elements . . . . . . .
. . . . . . . . . . . . . . . . . . . . . . . . . . . . . . . 935.6
Anchors . . . . . . . . . . . . . . . . . . . . . . . . . . . . . .
. . . . . . . . . . . . . . . . . . . . . . . . . . . . . . . . . .
. . . . . . . . 935.6.1 Hyperlink Type . . . . . . . . . . . . . . . . . . . . . .
. . . . . . . . . . . . . . . . . . . . . . . . . . . . . . . . . .
. . . 945.6.2 Hyperlink Parameters . . . . . . . . . . . . . . . .
. . . . . . . . . . . . . . . . . . . . . . . . . . . . . . . . . .
. . . . 945.6.3 Hyperlink Tooltip . . . . . . . . . . . . . . . . .
. . . . . . . . . . . . . . . . . . . . . . . . . . . . . . . . . .
. . . . . . . 94Chapter 6 Fields, Parameters, and Variables . . . . . . . . . .
. . . . . . . . . . . . . . . . . . . . . . . . . . . . . . 956.1
Working with Fields . . . . . . . . . . . . . . . . . . . . . . . .
. . . . . . . . . . . . . . . . . . . . . . . . . . . . . . . . . .
. . . . . 964 -
Table of Contents6.1.1 Registration of the Fields from a SQL
Query . . . . . . . . . . . . . . . . . . . . . . . . . . . . . . .
. . . . . 976.1.2 Accessing the SQL Query Designer . . . . . . . .
. . . . . . . . . . . . . . . . . . . . . . . . . . . . . . . . . .
. 996.1.3 Registration of the Fields of a JavaBean . . . . . . . .
. . . . . . . . . . . . . . . . . . . . . . . . . . . . . . .
996.1.4 Fields and Textfields . . . . . . . . . . . . . . . . . . .
. . . . . . . . . . . . . . . . . . . . . . . . . . . . . . . . . .
. 1006.2 Working with Parameters . . . . . . . . . . . . . . . . . .
. . . . . . . . . . . . . . . . . . . . . . . . . . . . . . . . . .
. . . . . . 1016.2.1 Using Parameters in a Query . . . . . . . . .
. . . . . . . . . . . . . . . . . . . . . . . . . . . . . . . . . .
. . . . 1016.2.2 IN and NOTIN clause . . . . . . . . . . . . . . .
. . . . . . . . . . . . . . . . . . . . . . . . . . . . . . . . . .
. . . . 1026.2.3 Built-in Parameters . . . . . . . . . . . . . . .
. . . . . . . . . . . . . . . . . . . . . . . . . . . . . . . . . .
. . . . . . 1036.2.4 Relative Dates . . . . . . . . . . . . . . . .
. . . . . . . . . . . . . . . . . . . . . . . . . . . . . . . . . .
. . . . . . . . 1046.2.5 Passing Parameters from a Program . . . .
. . . . . . . . . . . . . . . . . . . . . . . . . . . . . . . . . .
. . . 1066.3 Working with Variables . . . . . . . . . . . . . . . . . . .
. . . . . . . . . . . . . . . . . . . . . . . . . . . . . . . . . .
. . . . . . . 1086.4 Evaluating Elements During Report Generation .
. . . . . . . . . . . . . . . . . . . . . . . . . . . . . . . . . .
. . . . . 110Chapter 7 Bands and Groups . . . . . . . . . . . . . . . . . . .
. . . . . . . . . . . . . . . . . . . . . . . . . . . . . . . .
1137.1 Modifying Bands . . . . . . . . . . . . . . . . . . . . . .
. . . . . . . . . . . . . . . . . . . . . . . . . . . . . . . . . .
. . . . . . . . . 1137.2 Working with Groups . . . . . . . . . . .
. . . . . . . . . . . . . . . . . . . . . . . . . . . . . . . . . .
. . . . . . . . . . . . . . . . 1147.3 Other Group Options . . . .
. . . . . . . . . . . . . . . . . . . . . . . . . . . . . . . . . .
. . . . . . . . . . . . . . . . . . . . . . . 123Chapter 8 Fonts and Styles . . . . . . . . . . . . . . . . . . .
. . . . . . . . . . . . . . . . . . . . . . . . . . . . . . . . . .
1258.1 Working with Fonts . . . . . . . . . . . . . . . . . . . . .
. . . . . . . . . . . . . . . . . . . . . . . . . . . . . . . . . .
. . . . . . . . 1258.2 Using TrueType Fonts . . . . . . . . . . . .
. . . . . . . . . . . . . . . . . . . . . . . . . . . . . . . . . .
. . . . . . . . . . . . . . 1268.3 Using the Font Extensions . . .
. . . . . . . . . . . . . . . . . . . . . . . . . . . . . . . . . .
. . . . . . . . . . . . . . . . . . . . 1278.4 Character Encoding .
. . . . . . . . . . . . . . . . . . . . . . . . . . . . . . . . . .
. . . . . . . . . . . . . . . . . . . . . . . . . . . 1338.5 Use of
Unicode Characters . . . . . . . . . . . . . . . . . . . . . . . .
. . . . . . . . . . . . . . . . . . . . . . . . . . . . . . . .
1338.6 Working with Styles . . . . . . . . . . . . . . . . . . . .
. . . . . . . . . . . . . . . . . . . . . . . . . . . . . . . . . .
. . . . . . . . 1338.7 Creating Style Conditions . . . . . . . . .
. . . . . . . . . . . . . . . . . . . . . . . . . . . . . . . . . .
. . . . . . . . . . . . . . . 1358.8 Referencing Styles in External
Property Sheets . . . . . . . . . . . . . . . . . . . . . . . . . .
. . . . . . . . . . . . . . 137Chapter 9 Templates . . . . . . . . . . . . . . . . . . . . . .
. . . . . . . . . . . . . . . . . . . . . . . . . . . . . . . . . .
. . . 1399.1 Template Structure Overview . . . . . . . . . . . . .
. . . . . . . . . . . . . . . . . . . . . . . . . . . . . . . . . .
. . . . . . . . 1409.2 Groups . . . . . . . . . . . . . . . . . . .
. . . . . . . . . . . . . . . . . . . . . . . . . . . . . . . . . .
. . . . . . . . . . . . . . . . . . . 1449.3 Column Header . . . .
. . . . . . . . . . . . . . . . . . . . . . . . . . . . . . . . . .
. . . . . . . . . . . . . . . . . . . . . . . . . . . 1459.4 Detail
Band . . . . . . . . . . . . . . . . . . . . . . . . . . . . . . .
. . . . . . . . . . . . . . . . . . . . . . . . . . . . . . . . . .
. . . . 1459.5 Template Type and Other Options . . . . . . . . . .
. . . . . . . . . . . . . . . . . . . . . . . . . . . . . . . . . .
. . . . . . . 1459.6 Creating a New Template . . . . . . . . . . .
. . . . . . . . . . . . . . . . . . . . . . . . . . . . . . . . . .
. . . . . . . . . . . . 1469.7 Installing and Using the Template .
. . . . . . . . . . . . . . . . . . . . . . . . . . . . . . . . . .
. . . . . . . . . . . . . . . . 147Chapter 10 Data Sources and Query Executers . . . . . . . . . .
. . . . . . . . . . . . . . . . . . . . . . . . . . . . 15310.1 How
a JasperReports Data Source Works . . . . . . . . . . . . . . . . .
. . . . . . . . . . . . . . . . . . . . . . . . . . . 15310.2
Understanding Data Sources and Connections in iReport . . . . . . .
. . . . . . . . . . . . . . . . . . . . . . . . . . 15410.3
Creating and Using JDBC Connections . . . . . . . . . . . . . . . .
. . . . . . . . . . . . . . . . . . . . . . . . . . . . . . .
15610.3.1 ClassNotFoundError . . . . . . . . . . . . . . . . . . .
. . . . . . . . . . . . . . . . . . . . . . . . . . . . . . . . . .
. 15810.3.2 URL Not Correct . . . . . . . . . . . . . . . . . . . .
. . . . . . . . . . . . . . . . . . . . . . . . . . . . . . . . . .
. . . 15910.3.3 Parameters Not Correct for the Connection . . . . .
. . . . . . . . . . . . . . . . . . . . . . . . . . . . . . .
15910.3.4 Creating a JDBC Connection via the Services View . . . .
. . . . . . . . . . . . . . . . . . . . . . . . . 1595 -
Jaspersoft Style Guide and FrameMaker Template10.4 Working with
Your JDBC Connection . . . . . . . . . . . . . . . . . . . . . . .
. . . . . . . . . . . . . . . . . . . . . . . . . 16110.4.1 Fields
Registration . . . . . . . . . . . . . . . . . . . . . . . . . . .
. . . . . . . . . . . . . . . . . . . . . . . . . . . . 16210.4.2
Sorting and Filtering Records . . . . . . . . . . . . . . . . . . .
. . . . . . . . . . . . . . . . . . . . . . . . . . . . 16210.5 Understanding the JRDataSource Interface . . . . . . . . .
. . . . . . . . . . . . . . . . . . . . . . . . . . . . . . . . . .
16310.6 Data Source Types . . . . . . . . . . . . . . . . . . . . .
. . . . . . . . . . . . . . . . . . . . . . . . . . . . . . . . . .
. . . . . . . 16410.6.1 Using JavaBeans Set Data Sources . . . . . . . . . . . .
. . . . . . . . . . . . . . . . . . . . . . . . . . . . . 16410.6.2
Fields of a JavaBean Set Data Source . . . . . . . . . . . . . . .
. . . . . . . . . . . . . . . . . . . . . . . . . 16710.6.3 Using
XML Data Sources . . . . . . . . . . . . . . . . . . . . . . . . .
. . . . . . . . . . . . . . . . . . . . . . . . . 16910.6.4
Registration of the Fields for an XML Data Source . . . . . . . . .
. . . . . . . . . . . . . . . . . . . . . 17110.6.5 XML Data Source
and Subreports . . . . . . . . . . . . . . . . . . . . . . . . . .
. . . . . . . . . . . . . . . . . 17310.6.6 Using CSV Data Sources
. . . . . . . . . . . . . . . . . . . . . . . . . . . . . . . . . .
. . . . . . . . . . . . . . . 17710.6.7 Registration of the Fields
for a CSV Data Source . . . . . . . . . . . . . . . . . . . . . . .
. . . . . . . . 17910.6.8 Using JREmptyDataSource . . . . . . . . .
. . . . . . . . . . . . . . . . . . . . . . . . . . . . . . . . . .
. . . . . 18010.6.9 Using HQL and Hibernate Connections . . . . . .
. . . . . . . . . . . . . . . . . . . . . . . . . . . . . . . . .
18010.6.10 Using a Hadoop Hive Connection . . . . . . . . . . . . .
. . . . . . . . . . . . . . . . . . . . . . . . . . . . . .
18310.6.11 How to Implement a New JRDataSource . . . . . . . . . .
. . . . . . . . . . . . . . . . . . . . . . . . . . . . 18510.6.12
Using a Personalized JRDataSource with iReport . . . . . . . . . .
. . . . . . . . . . . . . . . . . . . . . 18710.7 Importing and Exporting Data Sources . . . . . . . . . . .
. . . . . . . . . . . . . . . . . . . . . . . . . . . . . . . . . .
. . 18910.8 Creating Custom Languages and Query Executers . . . . .
. . . . . . . . . . . . . . . . . . . . . . . . . . . . . . . . .
19010.8.1 Creating a Query Executer for a Custom Language . . . . .
. . . . . . . . . . . . . . . . . . . . . . . . . 19110.8.2
Creating a FieldsProvider . . . . . . . . . . . . . . . . . . . . .
. . . . . . . . . . . . . . . . . . . . . . . . . . . . . 198Chapter 11 Charts . . . . . . . . . . . . . . . . . . . . . . .
. . . . . . . . . . . . . . . . . . . . . . . . . . . . . . . . . .
. . . . . 20311.1 Creating a Simple Chart . . . . . . . . . . . . .
. . . . . . . . . . . . . . . . . . . . . . . . . . . . . . . . . .
. . . . . . . . . . . . 20311.2 Using Datasets . . . . . . . . . .
. . . . . . . . . . . . . . . . . . . . . . . . . . . . . . . . . .
. . . . . . . . . . . . . . . . . . . . . 20911.3 Value Hyperlinks
. . . . . . . . . . . . . . . . . . . . . . . . . . . . . . . . . .
. . . . . . . . . . . . . . . . . . . . . . . . . . . . . . 20911.4
Properties of Charts . . . . . . . . . . . . . . . . . . . . . . .
. . . . . . . . . . . . . . . . . . . . . . . . . . . . . . . . . .
. . . . . 21011.5 Using Chart Themes . . . . . . . . . . . . . . .
. . . . . . . . . . . . . . . . . . . . . . . . . . . . . . . . . .
. . . . . . . . . . . . 21111.5.1 Using the Chart Theme Designer . . . . . . . . . . . . .
. . . . . . . . . . . . . . . . . . . . . . . . . . . . . . .
21111.5.2 Creating a JasperReports Extension for a Chart Theme . .
. . . . . . . . . . . . . . . . . . . . . . . . 21211.5.3 Using a
Chart Theme in the Report Designer . . . . . . . . . . . . . . . .
. . . . . . . . . . . . . . . . . . . 21311.6 HTML5 Charts . . . . . . . . . . . . . . . . . . . . . . .
. . . . . . . . . . . . . . . . . . . . . . . . . . . . . . . . . .
. . . . . . . . . 215Chapter 12 Flash Charts . . . . . . . . . . . . . . . . . . . .
. . . . . . . . . . . . . . . . . . . . . . . . . . . . . . . . . .
. . . 22312.1 Viewing Flash Objects . . . . . . . . . . . . . . . .
. . . . . . . . . . . . . . . . . . . . . . . . . . . . . . . . . .
. . . . . . . . . . 22412.2 Using Maps Pro . . . . . . . . . . . .
. . . . . . . . . . . . . . . . . . . . . . . . . . . . . . . . . .
. . . . . . . . . . . . . . . . . . . 22412.2.1 Creating Maps . . . . . . . . . . . . . . . . . . . . . .
. . . . . . . . . . . . . . . . . . . . . . . . . . . . . . . . . .
. . 22412.2.2 Determining Map Entity IDs . . . . . . . . . . . . .
. . . . . . . . . . . . . . . . . . . . . . . . . . . . . . . . . .
. 22612.2.3 Specifying Map Data . . . . . . . . . . . . . . . . . .
. . . . . . . . . . . . . . . . . . . . . . . . . . . . . . . . . .
. 22912.2.4 Specifying Map Colors . . . . . . . . . . . . . . . . .
. . . . . . . . . . . . . . . . . . . . . . . . . . . . . . . . . .
. 23212.2.5 Localizing Maps . . . . . . . . . . . . . . . . . . . .
. . . . . . . . . . . . . . . . . . . . . . . . . . . . . . . . . .
. . . 23312.3 Using Charts Pro . . . . . . . . . . . . . . . . . . . . .
. . . . . . . . . . . . . . . . . . . . . . . . . . . . . . . . . .
. . . . . . . . . 23412.3.1 Creating Charts . . . . . . . . . . . .
. . . . . . . . . . . . . . . . . . . . . . . . . . . . . . . . . .
. . . . . . . . . . . 23612.3.2 Specifying Chart Data . . . . . . .
. . . . . . . . . . . . . . . . . . . . . . . . . . . . . . . . . .
. . . . . . . . . . . . 23912.3.3 Defining Trend Lines . . . . . .
. . . . . . . . . . . . . . . . . . . . . . . . . . . . . . . . . .
. . . . . . . . . . . . . 2426 -
Table of Contents12.4 Using Widgets Pro . . . . . . . . . . . .
. . . . . . . . . . . . . . . . . . . . . . . . . . . . . . . . . .
. . . . . . . . . . . . . . . . . 24312.4.1 Widget Types . . . . .
. . . . . . . . . . . . . . . . . . . . . . . . . . . . . . . . . .
. . . . . . . . . . . . . . . . . . . . 24312.4.2 Creating Widgets
. . . . . . . . . . . . . . . . . . . . . . . . . . . . . . . . . .
. . . . . . . . . . . . . . . . . . . . . . 24512.4.3 Specifying
Widget Data . . . . . . . . . . . . . . . . . . . . . . . . . . . .
. . . . . . . . . . . . . . . . . . . . . . . 24812.5 Embedding Components in a Java Application . . . . . . . .
. . . . . . . . . . . . . . . . . . . . . . . . . . . . . . . . .
25712.6 Localizing a Component . . . . . . . . . . . . . . . . . .
. . . . . . . . . . . . . . . . . . . . . . . . . . . . . . . . . .
. . . . . . . 25812.7 Component Limitations . . . . . . . . . . . .
. . . . . . . . . . . . . . . . . . . . . . . . . . . . . . . . . .
. . . . . . . . . . . . . 258Chapter 13 Lists, Tables, and Barcodes . . . . . . . . . . . . .
. . . . . . . . . . . . . . . . . . . . . . . . . . . . . . .
25913.1 Lists . . . . . . . . . . . . . . . . . . . . . . . . . . .
. . . . . . . . . . . . . . . . . . . . . . . . . . . . . . . . . .
. . . . . . . . . . . . . 25913.1.1 Working with the List Component . . . . . . . . . . . . .
. . . . . . . . . . . . . . . . . . . . . . . . . . . . . . .
25913.1.2 Parameters and Variables in a List Element . . . . . . .
. . . . . . . . . . . . . . . . . . . . . . . . . . . . . 26213.1.3
List Component Issues . . . . . . . . . . . . . . . . . . . . . . .
. . . . . . . . . . . . . . . . . . . . . . . . . . . . . 26513.1.4
Print Order: Vertical and Horizontal Lists . . . . . . . . . . . .
. . . . . . . . . . . . . . . . . . . . . . . . . . 26613.1.5 Other
Uses of the List . . . . . . . . . . . . . . . . . . . . . . . . .
. . . . . . . . . . . . . . . . . . . . . . . . . . . . 26613.1.6
Compatibility . . . . . . . . . . . . . . . . . . . . . . . . . . .
. . . . . . . . . . . . . . . . . . . . . . . . . . . . . . . . .
26613.2 Tables . . . . . . . . . . . . . . . . . . . . . . . . . .
. . . . . . . . . . . . . . . . . . . . . . . . . . . . . . . . . .
. . . . . . . . . . . . 26713.2.1 Creating a Table . . . . . . . .
. . . . . . . . . . . . . . . . . . . . . . . . . . . . . . . . . .
. . . . . . . . . . . . . . . 26713.2.2 Table Structure . . . . . .
. . . . . . . . . . . . . . . . . . . . . . . . . . . . . . . . . .
. . . . . . . . . . . . . . . . . . 26913.2.3 Editing the Table
Layout . . . . . . . . . . . . . . . . . . . . . . . . . . . . . .
. . . . . . . . . . . . . . . . . . . . . 27313.2.4 Editing the
Dataset Run . . . . . . . . . . . . . . . . . . . . . . . . . . . .
. . . . . . . . . . . . . . . . . . . . . . . 27313.2.5 Working
with Columns . . . . . . . . . . . . . . . . . . . . . . . . . . .
. . . . . . . . . . . . . . . . . . . . . . . . . 27413.2.6
Compatibility . . . . . . . . . . . . . . . . . . . . . . . . . . .
. . . . . . . . . . . . . . . . . . . . . . . . . . . . . . . . .
27513.3 Barcodes . . . . . . . . . . . . . . . . . . . . . . . . .
. . . . . . . . . . . . . . . . . . . . . . . . . . . . . . . . . .
. . . . . . . . . . . 27513.3.1 Working with Barcodes . . . . . . .
. . . . . . . . . . . . . . . . . . . . . . . . . . . . . . . . . .
. . . . . . . . . . . 27613.3.2 Barbecue Component . . . . . . . .
. . . . . . . . . . . . . . . . . . . . . . . . . . . . . . . . . .
. . . . . . . . . . . 27813.3.3 Barcode4J Component . . . . . . . .
. . . . . . . . . . . . . . . . . . . . . . . . . . . . . . . . . .
. . . . . . . . . . 27813.3.4 Compatibility . . . . . . . . . . . .
. . . . . . . . . . . . . . . . . . . . . . . . . . . . . . . . . .
. . . . . . . . . . . . . . 280Chapter 14 Subdatasets . . . . . . . . . . . . . . . . . . . . .
. . . . . . . . . . . . . . . . . . . . . . . . . . . . . . . . . .
. 28114.1 Creating a Subdataset . . . . . . . . . . . . . . . . . .
. . . . . . . . . . . . . . . . . . . . . . . . . . . . . . . . . .
. . . . . . . . 28114.2 Creating Dataset Runs . . . . . . . . . . .
. . . . . . . . . . . . . . . . . . . . . . . . . . . . . . . . . .
. . . . . . . . . . . . . . . 28314.3 Working Through an Example
Subdataset . . . . . . . . . . . . . . . . . . . . . . . . . . . .
. . . . . . . . . . . . . . . . 284Chapter 15 Crosstabs . . . . . . . . . . . . . . . . . . . . . .
. . . . . . . . . . . . . . . . . . . . . . . . . . . . . . . . . .
. . . 28915.1 Using the Crosstab Wizard . . . . . . . . . . . . . .
. . . . . . . . . . . . . . . . . . . . . . . . . . . . . . . . . .
. . . . . . . . 28915.2 Working with Columns, Rows, and Measures .
. . . . . . . . . . . . . . . . . . . . . . . . . . . . . . . . . .
. . . . . . . 29415.2.1 Modifying Cells . . . . . . . . . . . . . . . . . . . . .
. . . . . . . . . . . . . . . . . . . . . . . . . . . . . . . . . .
. . . 29715.2.2 Understanding Measures . . . . . . . . . . . . . .
. . . . . . . . . . . . . . . . . . . . . . . . . . . . . . . . . .
. . 29815.3 Modifying Crosstab Element Properties . . . . . . . . . . .
. . . . . . . . . . . . . . . . . . . . . . . . . . . . . . . . . .
. . 29815.4 Crosstab Parameters . . . . . . . . . . . . . . . . . .
. . . . . . . . . . . . . . . . . . . . . . . . . . . . . . . . . .
. . . . . . . . . 29915.5 Working with Crosstab Data . . . . . . .
. . . . . . . . . . . . . . . . . . . . . . . . . . . . . . . . . .
. . . . . . . . . . . . . . . 30015.6 Using Crosstab Total
Variables . . . . . . . . . . . . . . . . . . . . . . . . . . . . .
. . . . . . . . . . . . . . . . . . . . . . . . 3017 -
Jaspersoft Style Guide and FrameMaker TemplateChapter 16
Internationalization . . . . . . . . . . . . . . . . . . . . . . .
. . . . . . . . . . . . . . . . . . . . . . . . . . . . 30516.1
Using a Resource Bundle Base Name . . . . . . . . . . . . . . . . .
. . . . . . . . . . . . . . . . . . . . . . . . . . . . . . .
30516.2 Retrieving Localized Strings . . . . . . . . . . . . . . .
. . . . . . . . . . . . . . . . . . . . . . . . . . . . . . . . . .
. . . . . . . 30916.3 Formatting Messages . . . . . . . . . . . . .
. . . . . . . . . . . . . . . . . . . . . . . . . . . . . . . . . .
. . . . . . . . . . . . . . 30916.4 Deploying Localized Reports . .
. . . . . . . . . . . . . . . . . . . . . . . . . . . . . . . . . .
. . . . . . . . . . . . . . . . . . . 31016.5 Generating a Report
Using a Specific Locale and Time Zone . . . . . . . . . . . . . . .
. . . . . . . . . . . . . . . 310Chapter 17 Subreports . . . . . . . . . . . . . . . . . . . . .
. . . . . . . . . . . . . . . . . . . . . . . . . . . . . . . . . .
. . . 31317.1 Creating a Subreport . . . . . . . . . . . . . . . .
. . . . . . . . . . . . . . . . . . . . . . . . . . . . . . . . . .
. . . . . . . . . . . 31317.1.1 Linking a Subreport to the Parent Report . . . . . . . .
. . . . . . . . . . . . . . . . . . . . . . . . . . . . . .
31417.1.2 Specifying the Subreport . . . . . . . . . . . . . . . .
. . . . . . . . . . . . . . . . . . . . . . . . . . . . . . . . . .
31517.1.3 Specifying the Data Source . . . . . . . . . . . . . . .
. . . . . . . . . . . . . . . . . . . . . . . . . . . . . . . . .
31617.1.4 Passing Parameters . . . . . . . . . . . . . . . . . . .
. . . . . . . . . . . . . . . . . . . . . . . . . . . . . . . . . .
. 31617.2 A Step-by-Step Example . . . . . . . . . . . . . . . . . .
. . . . . . . . . . . . . . . . . . . . . . . . . . . . . . . . . .
. . . . . . 31717.3 Returning Values from a Subreport . . . . . . .
. . . . . . . . . . . . . . . . . . . . . . . . . . . . . . . . . .
. . . . . . . . . 32417.4 Using the Subreport Wizard . . . . . . .
. . . . . . . . . . . . . . . . . . . . . . . . . . . . . . . . . .
. . . . . . . . . . . . . . . 32717.4.1 Create a New Report via the Subreport Wizard . . . . . .
. . . . . . . . . . . . . . . . . . . . . . . . . . . 32717.4.2
Specifying an Existing Report in the Subreport Wizard . . . . . . .
. . . . . . . . . . . . . . . . . . . . 328Chapter 18 Scriptlets . . . . . . . . . . . . . . . . . . . . .
. . . . . . . . . . . . . . . . . . . . . . . . . . . . . . . . . .
. . . . 33318.1 Understanding the JRAbstractScriptlet Class . . . .
. . . . . . . . . . . . . . . . . . . . . . . . . . . . . . . . . .
. 33318.2 Creating a Simple Scriptlet . . . . . . . . . . . . . . .
. . . . . . . . . . . . . . . . . . . . . . . . . . . . . . . . . .
. . . . . . . . 33518.3 Testing a Scriptlet in iReport . . . . . .
. . . . . . . . . . . . . . . . . . . . . . . . . . . . . . . . . .
. . . . . . . . . . . . . . . 33918.4 Accessing iReport Objects . .
. . . . . . . . . . . . . . . . . . . . . . . . . . . . . . . . . .
. . . . . . . . . . . . . . . . . . . . . 34118.5 Debugging a
Scriptlet . . . . . . . . . . . . . . . . . . . . . . . . . . . . .
. . . . . . . . . . . . . . . . . . . . . . . . . . . . . . . .
34218.6 Deploying Reports That Use Scriptlets . . . . . . . . . . .
. . . . . . . . . . . . . . . . . . . . . . . . . . . . . . . . . .
. . 345Chapter 19 Additional Tools . . . . . . . . . . . . . . . . . .
. . . . . . . . . . . . . . . . . . . . . . . . . . . . . . . . . .
. 34719.1 Callout Tool . . . . . . . . . . . . . . . . . . . . . .
. . . . . . . . . . . . . . . . . . . . . . . . . . . . . . . . . .
. . . . . . . . . . . . 34719.1.1 Current Date Tool . . . . . . . . . . . . . . . . . . . .
. . . . . . . . . . . . . . . . . . . . . . . . . . . . . . . . . .
. . 34819.2 Page Number, Total Pages and Page X of Y Tools . . . .
. . . . . . . . . . . . . . . . . . . . . . . . . . . . . . . . . .
34919.2.1 Page Number Tools . . . . . . . . . . . . . . . . . . . .
. . . . . . . . . . . . . . . . . . . . . . . . . . . . . . . . . .
34919.2.2 Printing Page X of Y in a Single Textfield . . . . . . .
. . . . . . . . . . . . . . . . . . . . . . . . . . . . . . .
34919.3 Percentage Tool . . . . . . . . . . . . . . . . . . . . . .
. . . . . . . . . . . . . . . . . . . . . . . . . . . . . . . . . .
. . . . . . . . . 35019.4 Using a Background Image as Reference . .
. . . . . . . . . . . . . . . . . . . . . . . . . . . . . . . . . .
. . . . . . . . . 35119.5 How to Run the Samples . . . . . . . . .
. . . . . . . . . . . . . . . . . . . . . . . . . . . . . . . . . .
. . . . . . . . . . . . . . . 353Appendix A Chart Theme Example . . . . . . . . . . . . . . . . .
. . . . . . . . . . . . . . . . . . . . . . . . . . . . . . 355Index . . . . . . . . . . . . . . . . . . . . . . . . . . . . .
. . . . . . . . . . . . . . . . . . . . . . . . . . . . . . . . . .
. . . . . . . . . . 3598 -
IntroductionCHAPTER 1 INTRODUCTION
iReport Designer is an open source authoring tool that can
create complex reports from any kind of Java application through
the JasperReports library. It is written in 100% pure Java and is
distributed with source code according to the GNU General Public
License.Through an intuitive and rich graphic interface, iReport lets
you rapidly create any kind of report very easily. iReport enables
engineers who are just learning this technology to access all the
functions of JasperReports, as well as helping skilled users to
save a lot of time during the development of very elaborate
reports.For Version 5.0, iReport was almost completely rewritten, with
the new application based on the NetBeans rich client platform.
Even though the user interface appears pretty much the same, a
complete new design of the iReport core and the use of the NetBeans
platform will allow us to quickly create new features, making
iReport even easier to learn and use.With this iReport Ultimate Guide youll learn how to add visual
and analytic features to complex reports with charts, images, and
subreports. This informative guide has transformed many a newcomer
into designers of pixel-perfect, complex, and highly interactive
reports. It is written and updated by Giulio Toffoli, iReport
project founder and architect.This chapter has the following sections: Features of iReport The
iReport Community JasperReports Commercial License Code Used in
This Book1.1 Features of iReportThe following list describes some of the
most important new features of iReport 5.0: Support for relative
dates. HTML5 charts. XML/A support of MSAS. Nested tables.Version 4.7 added the following features: 100% support of
JasperReports XML tags. WYSIWYG editor for the creation of reports.
It has complete tools for drawing rectangles, lines, ellipses,
textfields,labels, charts, subreports and crosstabs. Built-in editor with
syntax highlighting for writing expressions. Support for Unicode
and non-Latin languages (Russian, Chinese, Japanese, Korean,
etc.).9 -
iReport Ultimate Guide Browser for document structure.
Integrated report compiler, filler, and exporter. Support for all
databases accessible by JDBC. Virtual support for all kinds of data
sources.Wizard for creating reports and subreport automatically.
Support for document templates. TrueType fonts support. Support for
localization. Extensibility through plug-ins. Support for charts.
Management of a library of standard objects (for example, numbers
of pages). Drag-and-drop functionality. Unlimited undo/redo. Wizard
for creating crosstabs. Styles library. Integrated preview. Error
manager. JasperServer repository explorer. Integrated SQL and MDX
query designer. Additional features in Professional Edition.Version 3.6 added support for visual components based on Adobe
Flash.Version 3.7 has these new features: Instructions on installing
iReport on Mac OSX. Enhanced page formatting, including band
features that enable multiple bands and subbands of the same type
and a newPage Format dialog. Keep Together and Footer Position properties
for groups. Query executers and fields providers to enable you to
use custom query languages.1.2 The iReport CommunityThe iReport team comprises many skilled
and experienced programmers who come from every part of the world.
They work daily to add new functionality and fix bugs. The iReport
project site is at http://ireport.sourceforge.net. If you need help
with iReport, there is a discussion forum in English. This is the
place where you can send requests for help and technical questions
about the use of the program, as well as post comments, discuss
implementation choices, and propose new functionality. There is no
guarantee of a prompt reply, but requests are usually satisfied
within a few days time. This service is free. If you need
information concerning commercial support, you can write to
[email protected]Please report bugs at the following address:
http://community.jaspersoft.com/bug-trackerAt the project site, there is a system to send requests for
enhancement (RFE). There is also the ability to suggest patches and
integrative code. All members of the iReport team value feedback
from the user community and seriously consider all suggestions,
criticism, and advice from iReport users.1.3 JasperReports Commercial LicenseThe Pro components of
JasperReports Professional require a commercial license. iReport
Professional includes a full-featured, 30-day evaluation license
that must be replaced with the commercial license provided by
Jaspersoft. The commercial license can be installed using the
License Manager.10http://ireport.sourceforge.net/http://community.jaspersoft.com/answers?f[0]=field_question_project%3A183mailto:[email protected]?subject=iReport
Commercial Support Inquiry -
IntroductionTo open the License Manager select Help License
Manager:Click Install License and select the license file to use.
iReport will copy the provided file in the user directory with the
name jasperreports.license. If the license is not valid, a message
will explain the problem and what do to.If you do not purchase the commercial license and the evaluation
license expires, iReport shows the following message at startup.
You can still use iReport with the expired license, but you cannot
run reports that use Pro components:1.4 Code Used in This BookJasperReports supports the following
languages for expressions: Java JavaScript GroovyAll the sample expressions used in this guide are written in
JavaScript.Figure 1-1 License Manager Dialog
Figure 1-2 License Manager Dialog When License Expires11
-
iReport Ultimate Guide12
-
Getting StartedCHAPTER 2 GETTING STARTED
In this chapter you will learn the basic requirements for using
iReport, where you can get it and how to install it.This chapter has the following sections: Platform Requirements
Downloads Development Versions Compiling iReport Installing iReport
The Windows Installer First iReport Execution Creating a JDBC
Connection Creating Your First Report2.1 Platform RequirementsiReport needs the Sun Java 2 SDK to
run, Version 1.5 or newer. If you want to build the tool from the
source code or write a plug-in, you will also need NetBeans IDE and
the NetBeans platform 6.5.1.As for hardware, like all Java programs, iReport consumes a lot
of RAM, so it is necessary to have at least 256 MB of memory
available as well as about 50 MB of free disk space.Some features documented in this guide require Jaspersoft
Professional software. The features are indicated with a special
note.2.2 DownloadsYou can download iReport from the dedicated project
page on SourceForge.net, where you can always find the most recent
released iReport distributions
(http://www.jaspersoft.com/jaspersoft-business-intelligence-software-trial).
Four different distributions are available: iReport-x.x.x.zip. This
is the official binary distribution in ZIP format.In order to avoid problems with the file chooser in iReport,
Windows Vista users should have Java 1.5.0_17-b04 or newer
installed. Windows 7 users should have Java 1.6.0_18-b03 or
1.7.0-b74.13http://www.jaspersoft.com/jaspersoft-business-intelligence-software-trial
-
iReport Ultimate Guide iReport-x.x.x.tgz. This is the official
binary distribution in TAR GZ format. iReport-x-x-x-src.zip. This
is the official distribution of source files in ZIP format.
iReport-x.x.x-windows-installer.exe. This is the official Win32
installer. iReport-x.x.x.dmg. This is the official binary
distribution for Mac OSX in Disk Image format.x.x.x represents the version number of iReport*. Every
distribution contains all needed libraries from third parties
necessary to use the program and additional files, such as
templates and base documentation in HTML format.iReport is also available as a native plug-in for NetBeans IDE
6.x. You can download the plug-in from SourceForge or NetBeans.At the time of writing we are planning an OS X distribution to
support Macintosh systems; it may be available in the future.2.3 Development VersionsIf you want to test pre-release versions
of iReport, you can directly access the developmental source
repository with SVN. In this case, you must have an SVN client (my
favorite is Tortoise SVN). If you dont have one, you will need to
create an account at http://community.jaspersoft.com/ in order to
access the repository.The URL of the SVN repository for iReport
is:http://anonsvn:[email protected]/svn/repos/ireportfornetbeans2.4 Compiling iReportThe distribution with sources contains a
NetBeans project. In order to compile the project and run iReport,
you need NetBeans IDE and the platform 6.0.1 (or 6.5.1 starting
from iReport 3.6.1). If you are using NetBeans 6.0, the platform is
the same as the IDE; otherwise youll need to download the platform
separately at this URL:http://download.netbeans.org/netbeans/6.0/final/zip/netbeans-6.0.1-200801291616-mml.zip
If you need to work with iReport 3.6.1 sources, you need
NetBeans 6.5.1; otherwise, you can download the 6.5.1 platform from
the NetBeans site.http://bits.netbeans.org/download/6.5.1/fcs/zip.html
The file to download is
netbeans-6.5.1-200903060201-all-in-one.zip.Download iReport-x.x.x-src.zip and unzip it in the directory of
your choice, such as c:devel (or /usr/devel on a UNIX system).* Up to iReport 3.6.1, the version number contains the nb prefix
(for NetBeans). This prefix was introduced when iReport was
rewritten on top of the NetBeans platform (version 3.1.0). The
prefix has been removed starting with version 3.6.2.Pre-release iReport source code is no longer available on
SourceForge CVS Server.Please note that NetBeans IDE is the development environment,
while NetBeans 6.5.1 is the version of the platform (which can be
considered something like an external library or dependency; it has
very little to do with the IDE). iReport is built on NetBeans Rich
Client Platform version 6.5.1. In order to build iReport you can
use any version of NetBeans IDE, but you need this specific
NetBeans platform to successfully compile the source.14http://sourceforge.net/http://netbeans.org/http://community.jaspersoft.com/
-
Getting StartedRun NetBeans IDE and open the iReport project
(see Figure 2-1).The project is actually a suite that contains several
subprojects, or modules.To run iReport, click the Run main project button on the tool
bar.Figure 2-1 NetBeans IDE project chooser15
-
iReport Ultimate GuideIf you want to build all the
distributions, run the create-ireport-distro target provided in the
build script. To do it, select the build.xml (Build Script) file
located in the project folder Important Files. Right-click the file
and select the appropriate target to run (see Figure 2-2).2.5 Installing iReportIf you download the binary version of
iReport, do the following:1. Unpack the distribution archive into
the directory of your choice; for example, to c:devel (or
/usr/devel on a UNIXsystem). 2. Open a command prompt or a shell, go to the
directory where the archive was unpacked, change to the iReport
directory,then to the bin subdirectory, and enter:ireport.exe
In Unix, use the chmod +x command to make the installation
script executable, then, in the root directory, enter:./ireportFigure 2-2 Build script containing a set of targets to create
several iReport distributions16 -
Getting Started2.6 The Windows Installer
iReport provides a convenient Windows installer created using
NSIS, the popular installer from Nullsoft. To install iReport,
double-click iReport-nb-x.x.x-windows-installer.exe to bring up the
screen shown in Figure 2-4.Click Next and follow the instructions in the Install wizard
until the installation is complete (Figure 2-5).Figure 2-3 Windows Installer Step 1
Figure 2-4 Windows Installer Step 217
http://nsis.sourceforge.net/
-
iReport Ultimate GuideAfter the installation, there will be a
new menu item in the Programs menu (Start Programs Jaspersoft
iReport-nb-x.x.x).The installer creates a shortcut to launch iReport, linking the
shortcut to iReport.exe (present in the /bin directory under the
Jaspersoft home directory).Figure 2-5 Windows Installer — Last Step
You can install more than one version of iReport on your machine
at the same time, but all the versions will share the same
configuration files.18 -
Getting Started2.7 Installing iReport on Mac OSX
Mac OSX does not require any special installation procedure,
just double-click the DMG (Disk Image) archive and drag iReport
into the Applications folder.To run iReport, double-click the iReport icon.
2.8 First iReport ExecutionWhen you run iReport for the first
time, you will need to configure a couple of options in order to
start designing reports, including a data source to be used with
the reports and, optionally, the location of the external programs
to preview the reports (only if you dont want to use the internal
preview).Figure 2-6 The Disk Image mounted on Mac OSX19
-
iReport Ultimate GuideTo display the window shown here in Figure
2-7, run iReport and select Tools Options. I will discuss all the
options shown in this panel in later chapters. For now, click the
Viewers tab (see Figure 2-8) and configure the applications that
you will use to view your output reports.Figure 2-7 Options Window General Options20
-
Getting StartedTest the configuration by creating a new blank
report:1. Select File New empty report.2. Select where to save it
and confirm.3. Click the Preview button on the tool bar.If everything is okay, iReport generates a Jasper file and
displays a preview of a blank page. This means you have installed
and configured iReport correctly.On Windows and Mac OSX it is not necessary to configure the
viewers. If they are not configured, the system default is used to
open the generated files.2.9 Creating a JDBC ConnectionThe most common data source for
filling a report is a relational database, so, next, you will see
how to set up a JDBC connection in iReport:1. Click Select Tools
Reports and click the New button in the window with the connections
list. A new window willappear for configuration of the new connection (see Figure
2-9).Figure 2-8 Options Window Viewers
iReport stores report templates as XML files, with extension of
.jrxml (JRXML files). Compiled versions of the templates are stored
as binary files, with the extension .jasper (Jasper files). The
latter are used to actually generate the reports.21 -
iReport Ultimate Guide2. Select Database JDBC connection and
click Next. 3. In the Database JDBC Connection window, enter the
connection name (for example, My new connection) and select theright JDBC driver.iReport recognizes the URL syntax of many JDBC
drivers. You can automatically create the URL by entering the
server address and database name in the corresponding boxes and
clicking the Wizard button.Figure 2-9 Data Source Type Selection22
-
Getting Started4. To complete the connection configuration,
enter the username and password for access to the database. If you
want to save the password, select the Save password check box.I suggest that you test the connection configuration before
moving on, which you can do by clicking the Test button.iReport provides the JDBC driver for the following SQL-compliant
database systems: HSQL MySQL PostgreSQLIf iReport returns a ClassNotFound error, it is possible that
there is no JAR archive (or ZIP) in the classpath that contains the
selected database driver. In this case, there are two options:
Adding the required JAR to the iReport classpath.To extend the iReport classpath, select the menu item Tools
Options, go to the classpath tab under the iReport category, and
add the JAR to the list of paths.Registering the new driver through the service window.If you
prefer this second way, open the services window (Window Services
or CTRL+5), select the Databases node, then the Drivers
node.Right-click the Drivers node and select New Driver. The dialog
shown in Figure 2-11 will pop up.Figure 2-10 JDBC Connection Using a Built-in JDBC Driver23
-
iReport Ultimate GuideResume the testing without closing iReport
by copying the JDBC driver into the /lib directory and clicking
Test again. iReport automatically locates the required JAR file and
loads the driver from it. In Chapter 10, I will explain the
configuration methods for various data sources in greater
detail.If the test is successful, click the Save button to store the
new connection.The connection will appear in the data source drop-down list in
the main tool bar (Figure 2-12). Select it to make it the active
connection.Another way to set the active connection is by opening the data
source window (Figure 2-12):1. Select the Tools Report data sources
menu item (or by clicking the button on the tool bar next to the
data sources drop-down list).2. Select the data source that you want to make
active:3. Click Set as default.
The selected data source is the one used to fill the report and
perform other operations, such as the acquisition of the fields
selected through SQL queries. There is no strict binding between a
report and a data source, so you can run a report with different
data sources, but only one at time. Later, we will see how
subreports can be used to create a report that uses multiple data
sources.Figure 2-11 Oracle Driver Loaded from an External JAR
Figure 2-12 Data Sources Window24
-
Getting StartedThe Data Sources drop-down menu allows you to
select the active data source; the button on the left opens the
Data Sources window:2.10 Creating Your First ReportNow that you have installed and
configured iReport and prepared a JDBC connection to the database,
you will proceed to create a simple report using the Wizard.For this example and many of those following, you will use
HSQLDB, a small relational database written in Java and supplied
with a JDBC driver. You can learn more about this small jewel by
visiting the HSQLDB web site.2.10.1 Using the Sample Database
For sample reports, we will use the sample database that comes
with JasperReports.Download JasperReports (the biggest distribution) and unpack it.
Open a command prompt (or a shell) and change to the /demo/hsqldb.
IIf you have Ant (and you know what it is), just run:ant
runServerOtherwise, run this command (all in a single line):java -cp
….libhsqldb-1.7.1.jar org.hsqldb.ServerThe database server will start and we will be ready to use it
with iReport.2.10.2 Using the Report WizardThe table below lists the
parameters you should use to connect to the sample database:When the password is blank, as in this case, remember to set the
Save password check box when configuring the connection.1. Click
File Report Wizard. This loads a wizard (Figure 2-14) for the
step-by-step creation of a report, starting with theselection of the template followed by the selection of the name
and the location of the new report.Figure 2-13 Data Sources Drop-Down Menu
Parameter Value
Name JasperReports Sample
JDBC Driver org.hsqldb.jdbcDriver
JDBC URL jdbc:hsqldb:hsql://localhost
Username sa
Password25
http://hsqldb.org
-
iReport Ultimate Guide2. Select the template and click Launch
Report Wizard to proceed with the report creation. (You can create
a simple report that duplicates the selected template just by
clicking Open this Template. However, well use the wizard for this
example.)Figure 2-14 Report Wizard Template Selection
Figure 2-15 Report Wizard New Report Name and Location26
-
Getting Started3. In the third step, select the JDBC connection
we configured in the previous step. The wizard will detect that we
are working with a connection that allows the use of SQL queries
and will prompt a text area to specify an SQL query (Figure 2-16).
Optionally, we can design the query visually by clicking Design
query. We assume that you know at least a bit of SQL, so we will
directly enter a simple query, as follows:select * from address order by city
4. Click Next. The clause order by is important to the following
choice of sort order (I will discuss the details a little later).
iReport reads the fields of the addresses table and presents them
in the next screen of the Wizard, as shown in Figure 2-17.Figure 2-16 Report Wizard SQL Query27
-
iReport Ultimate Guide5. Select the fields you wish to include
and click Next. 6. Now that you have selected the fields to put in
the report, you are prompted to choose which fields to use for
sorting, ifany (see Figure 2-17).Using the wizard, you can create up to
four groups. You can define more fields later. (In fact, it is
possible to set up an arbitrary number of groupings.)Figure 2-17 Report Wizard Fields Selection28
-
Getting Started7. For this first report, define a simple
grouping on the CITY field, as shown in Figure 2-18.8. When done, click Next.
Figure 2-18 Report Wizard Grouping
Figure 2-19 Main Preview and Design Window29
-
iReport Ultimate Guide9. The last screen of the wizard will
appear, and it will tell you the outcome of the operation. Click
Finish to create the report, which will appear in the iReport
central area, ready to be generated, as shown below.10. Click the Preview button to see the final result.
When you click Preview, iReport compiles the report, generating
the JASPER file and executing the report against the specified data
source. You can track the progress in the output window, which is
below the main window.If, for some reason, the execution fails, you can see a set of
problems in the Report Problems window, and other error tracking
information (for example, a full stack trace) in the iReport output
window.In this example, everything should work just fine, and you
should see the report in the preview as shown above (Figure
2-19).Also note: You can save the report by clicking on the disk icon
in the window tool bar. iReport can save reports in several
formats,including PDF and HTML. To automatically export the report in a
particular format and run the appropriate viewer application,
select a format fromthe Preview menu. To run the report again from the preview
window, click the Reload button in the preview tool bar, or, if you
change thereport design, save the design and click Preview. 30
-
Basic Notions of JasperReportsCHAPTER 3 BASIC NOTIONS OF
JASPERREPORTSThe heart of iReport is JasperReports, an open source library
developed and maintained by Jaspersoft Corporation under the
direction of Teodor Danciu and Lucian Chirita. It is the most
widely distributed and powerful free software library for report
creation available today.In this chapter, I will illustrate JasperReportss base concepts
for a better understanding of how iReport works.The JasperReports API, the XML syntax for report definition, and
all the details for using the library in your own programs are
documented very well in The JasperReports Ultimate Guide. This
guide is available from Jaspersoft. Other information and examples
are directly available on the official JasperReports site at http
//jasperreports.sourceforge.net.JasperReports is published under the LGPL license, which is less
restrictive a GPL license. JasperReports can be freely used on
commercial programs without buying very expensive software licenses
and without remaining trapped in the complicated net of open source
licenses. This is fundamental when reports created with iReport
have to be used in a commercial product; in fact, programs only
need the JasperReports library to produce prints, which work
something like a run time executable.On the other hand, iReport is distributed with a GPL license.
Without the appropriate commercial license (available upon
request), you can only use iReport as a development tool, and only
programs published under the terms of the GPL license may include
iReport as a component.This chapter has the following sections: The Report Life Cycle
JRXML Sources and Jasper Files Data Sources and Print Formats
Compatibility Between Versions Expressions Using Java as a Language
for Expressions Using Groovy as a Language for Expressions Using
JavaScript as a Language for Expressions A Simple Program3.1 The Report Life Cycle When we think about a report, only the
final document comes to mind, such as a PDF or Excel file. But this
is only the final stage of a report lifecycle, which starts with
the report design. Designing a report means creating some sort of
template, such as a form where we leave blank space that can be
filled with data. Some portions of a page defined in this way are
reused, others stretch to fit the content, and so on.31http://www.jaspersoft.com/documents/store_jasperreports-definitive-guide.htmlhttp://jasperreports.sourceforge.net/
-
iReport Ultimate GuideWhen we are finished, we save this
template as an XML file sub-type that we call JRXML (JR for
JasperReports). It contains all the basic information about the
report layout, including complex formulas to perform calculations,
an optional query to retrieve data out of a data source, and other
functionality we will discuss in detail in later chapters.A JRXML cannot be used as-is. For performance reasons, and for
the benefit of the program that will run the report, iReport
compiles the JRXML and saves it as an executable binary, a JASPER
file. A JASPER file is the template that JasperReports uses to
generate a report melding the template and the data retrieved from
the data source. The result is a meta printan interim output
reportthat can then be exported in one or more formats, giving life
to the final document.The life cycle can be divided into two distinct action sets:
Tasks executed during the development phase (design and planning of
the report, and compilation of a Jasper file source,the JRXML). Tasks that must be executed in run time (loading of
the Jasper file, filling of the report, and export of the print in
a finalformat).
The main role of iReport in the cycle is to design a report and
create an associated JASPER file, though it is able to preview the
result and export it in all the supported formats. iReport also
provides support for a wide range of data sources and allows the
user to test their own data sources, thereby becoming a complete
environment for report development and testing.3.2 JRXML Sources and Jasper FilesAs already explained,
JasperReports defines a report with an XML file. In previous
versions, JasperReports defined the XML syntax with a DTD file
(jasperreport.dtd). Starting with Version 3.0.1, JasperReports
changed the definition method to allow for support of user defined
report elements. The set of tags was extended and the new XML
documents must be validated using an XML-Schema document
(jasperreport.xsd).Table 3-1
A JRXML file is composed of a set of sections, some of them
concerning the reports physical characteristics, such as the
dimension of the page, the positioning of the fields, and the
height of the bands; and some of them concerning the logical
characteristics, such as the declaration of the parameters and
variables, and the definition of a query for data selection.The syntax has grown more and more complicated with the maturity
of JasperReports. This is why many times a tool like iReport is
indispensable.The following figure shows the source code of the report
described in the previous chapter (Figure 2-19):. Code Example 3-1 A simple JRMXL file example
32
-
Basic Notions of JasperReports
Code Example 3-1 A simple JRMXL file example, continued33
-
iReport Ultimate Guide
Code Example 3-1 A simple JRMXL file example, continued34
-
Basic Notions of JasperReports
Code Example 3-1 A simple JRMXL file example, continued35
-
iReport Ultimate GuideDuring compilation of the JRXML file
(using some JasperReports classes), the XML is parsed and loaded in
a JasperDesign object, which is a rich data structure that allows
you to represent the exact XML contents in memory. Without going
into details, regardless of which language is used for expressions
inside the JRXML, JasperReports creates a special Java class that
represents the whole report. The report is then compiled, instanced
and serialized in a JASPER file, ready for loading at any time.JasperReportss speedy operation is due to all of a reports
formulas being compiled into Java-native bytecode and the report
structure being verified during compilation instead of run time.
The JASPER file does not contain extraneous resources, such as
images used in the report, resource bundles to run the report in
different languages, or extra scriptlets and external style
definitions. All these resources must be provided by the host
application and located at run time.$V{PAGE_NUMBER}]]>
$V{PAGE_NUMBER} + » of «]]>
Code Example 3-1 A simple JRMXL file example, continued36
-
Basic Notions of JasperReports3.3 Data Sources and Print
FormatsWithout a means of supplying content from a dynamic data
source, even the most sophisticated and appealing report would be
useless. JasperReports allows you to specify fill data for the
output report in two ways: parameters and data sources. Either
kinds of data are presented by means of a generic interface named
JRDataSource, as shown in Figure 3-1.Chapter Chapter 10, Data Sources and Query Executers, on page
153 is dedicated to data sources; it explains how they can be used
in iReport and how it is possible to define custom data sources (in
case those supplied with JasperReports are not right for your
requirements).JRDataSource allows a set of records that are organized in
tables (rows and columns) to be read. It enables JasperReports to
fill a report with data from an explicit data source, using a JDBC
connection (already instanced and opened) to whichever relational
database you want to run a SQL query on (which is specified in the
report).If the data (passed through a data source) don’t meet the
requirements of the user, that is, when it is necessary to specify
particular values to condition the reports execution, it is
possible to produce name/value pairs to transmit to the print
engine. These pairs are named parameters, and they have to be
preventively declared in the report. Through fillManager, it is
possible to join a JASPER file and a data source in a JasperPrint
object. This object is a meta-print that can create a real print
after you have exported it in the desired format through
appropriate classes that implement the JRExporter interface.JasperReports puts at your disposal different pre-defined
exporters, such as those for creating files in such formats as PDF,
XLS, CVS, XML, RTF, ODF, text, HTML and SWF. Through the JRViewer
class, you can view the print directly on the screen and print a
hardcopy.3.4 Compatibility Between VersionsWhen a new version of
JasperReports is distributed, some classes usually change. These
modified classes typically impact the XML syntax and the JASPER
file structure.Before JasperReports 1.1.0, this was a serious problem and a
major upgrade deterrent, since it required recompiling all the
JRXML files in order to be used with the new library version.
Things changed after the release of Version 1.1.0, after which
JasperReports assured backwards compatibility, that is, the library
is able to understand and execute any JASPER file generated with a
previous version of JasperReports.Figure 3-1 Data source and parameter Flows for Report
Creation37 -
iReport Ultimate GuideWith JasperReports 3.1, the JRXML syntax
moved from a DTD-based definition to XML-based schema. The XML
source declaration syntax now references a schema file, rather than
a DTD. Based on what we said previously, this is not a problem
since JasperReports assures backwards compatibility. However, many
people have been used to designing reports with early versions of
iReport then generating the reports by compiling JRXML in
JasperReports. This was always a risky operation, but it was still
valid because the user was not using a new tag in the XML. With the
move to an XML schema, the JRXML output of iReport 3.1.1 and newer
can only be compiled with a JasperReports 3.1.0 or later.3.5 ExpressionsThough I designed iReport to be useful for
non-technical report designers, many settings in a report are
defined using formulas (such as conditions to hide an element,
special calculations, text processing, and so on) that require a
minimum knowledge of a scripting language.Fortunately, formulas can be written in at least three
languages, two of which (JavaScript and Groovy) are pretty simple
and can be used without knowledge of programming methods.All of the formulas in JasperReports are defined through
expressions. The default expression language is Java, but I suggest
that you design your projects with JavaScript or Groovy. Both hide
a lot of the Java complexity and are definitively the languages to
use if you dont know Java. The language is a property of the
document, so, to set it, select the document root node in the
Outline view and choose your language in the Language property in
the Properties view. We will go through all the languages in the
following sections, but lets concentrate for a moment on our
definition of an expression, in particular the type you will
declare for it and why that is important in JasperReports.An expression is just a formula that operates on some values and
returns a result. Think of an expression as the formula you might
define for a spreadsheet cell. A cell can have a simple value or
you can use a complex formula that refers to other values; in a
spreadsheet you would refer to values contained in other cells,
whereas in JasperReports you will use the report fields,
parameters, and variables. The main point is that whatever you have
in your expression, when it is computed it gives a value as result
(which can be null; thats still a value).3.5.1 The Type of an ExpressionThe type of an expression is the
nature of the value resulting from it; the type is determined by
the context in which the expression is used. For example, if your
expression is used to evaluate a condition, the type of the
expression should be Boolean (true or false); if you are creating
an expression that should be displayed in a textfield, it will
probably be a String or a number (Integer or Double). We could
simplify the declaration of types by limiting them to text,
numbers, Booleans, and generic object values. Unfortunately,
JasperReports is a bit more formal and in many cases you have to be
very precise when setting the type of your expression.So far, we are discussing only Java types (regardless of the
language used). Some of the most important types are:java.lang.Boolean Defines an Object that represents a boolean
value such as true andfalse
java.lang.Byte Defines an Object that represents a byte
java.lang.Short Defines an Object that represents an short
integerjava.lang.Integer Defines an Object that represents integer
numbersjava.lang.Long Defines an Object that represents long integer
numbersjava.lang.Float Defines an Object that represents floating point
numbersjava.lang.Double Defines an Object that represents real
numbersjava.lang.String Defines an Object that represents a text38
-
Basic Notions of JasperReportsAs noted, if the expression is
used to determine the value of a condition that determines, for
instance, whether an element should be printed, the return type
will be java.lang.Boolean; to create it, you need an expression
that returns an instance of a Boolean object. Similarly, if Im
writing the expression to show a number in a textfield, the return
type will be java.lang.Integer or java.lang.Double.Fortunately, JavaScript and Groovy are not particularly formal
about types, since they are not typed languages; the language
itself treats a value in the best way by trying to guess the value
type or by performing implicit casts (conversion of the type).3.5.2 Expression Operators and Object MethodsOperators in Java,
Groovy and JavaScript are similar because these languages share the
same basic syntax. Operators can be applied to a single operand
(unary operators) or on two operands (binary operators).The table shows a number of operators. This is not a complete
list; they are the ones I suggest. For instance, there is a unary
operator to add 1 to a variable (++), but in my opinion it is not
easy to read and can be replaced easily with x + 1. Better, no?Within the expression, you can the syntax thats summarized in
Table 3-3 to refer to the parameters, variables, and fields which
are defined in the report.java.util.Date Defines an Object that represents a date or a
timestampjava.lang.Object A generic java Object
Table 3-2 Expression operators
Operator Description Example
+ Sum (it can be used to sum two numbers or to concatenate two
strings) A + B— Subtraction A — B
/ Division A / B
% Rest, it returns the rest of an integer division A % B
|| Boolean operator OR A || B
&& Boolean operator AND A && B
== Equals*
* In Java the == operator can only be used to compare two
primitive values. With objects, you need to use the special method
equals; for example, you cannot write an expression like test ==
test, you need to write test.equals(test). != can only be used to
compare two primitive values, as well.A == B
!= Not equals* A != B
! Boolean operator NOT !A
Table 3-3 Syntax for referring to report objects
Syntax Description
$F{name_field} Specifies the name_field field («F» means
field).$V{name_variable} Specifies the name_ variable variable.
$P{name_parameter} Specifies the name_parameter parameter.
$P!{name_parameter} Special syntax used in the report SQL query
to indicate that the parameter does not have to be dealt as a value
to transfer to a prepared statement, but that it represents a
little piece of the query.$R{resource_key} Special syntax for localization of
strings.39 -
iReport Ultimate GuideWe will describe the nature of fields,
variables, and parameters in the next chapter. For now we just have
to keep in mind that they always represent objects (that is, they
can have a null value) and that you specify their type when you
declare them within a report. Version 0.6.2 of JasperReports
introduced a new syntax: $R{resource_key}. This is used to localize
strings. I will discuss this at greater lengths in Chapter Chapter
16, Internationalization, on page 305.In spite of the possible complexity of an expression, usually it
is a simple operation that returns a value. It is not a snippet of
code, or a set of many instructions, and you cannot use complex
constructs or flow control keywords, such as switches, loops, for
and while cycles, if and else.Be that as it may, there is a simple if-else expression
construct that is very useful in many situations. An expression is
just an arbitrary operation (however complicated) that returns a
value. You can use all the mathematical operators or call object
methods, but at any stage the expression must represent a value. In
Java, all these operators can be applied only to primitive values,
except for the sum operator (+). The sum operator can be applied to
a String expression with the special meaning of concatenate. So,
for example:$F{city} + , + $F{state}
will result in a string like this: San Francisco, California
All the objects in an expression may include methods. A method
can accept zero or more arguments, and it can return or not a
value; in an expression you can use only methods that return a
value (otherwise you would have nothing to return from your
expression). The syntax of a method call is:Object.method(argument1, argument2, and so on.)
Some examples:
All the methods of each object are usually explained in a set of
documents called Javadocs; they are freely available on the
Internet.You can use parentheses to isolate expressions and make the
overall expression more readable.3.5.3 Using an If-Else Construct in an ExpressionA way to create
an if-else-like expression is by using the special question mark
operator. Here is a sample:(($F{name}.length() > 50) ? $F{name}.substring(0,50) :
$F{name})The syntax is () ? : . It is extremely useful, and the good news
is that it can be recursive, meaning that the value on true and
false can be represented by another expression which can be a new
condition:(($F{name}.length() > 50) ?
(($F{name}.startsWidth(A)) ? AAAA : BBB)
:
$F{name})
This expression returns the String AAAA when the value of the
field name is longer than 50 characters and starts with A, returns
BBB if it is longer than 50 characters but does not start with A,
and, finally, returns the original field value if neither of these
conditions is true.Despite the possible complexity of an expression (having
multiple if-else instructions and so on), it can be insufficient to
define a needed value. For example, if you want to print a number
in Roman numerals or give back the name of the weekdayExpression Result
test.length() 4
test.substring(0, 3) tes
test.startsWith(A) false
test.substring(1, 2).startsWith(e) true40
-
Basic Notions of JasperReportsof a date, it is possible to
transfer the elaborations to an external Java class method, which
must be declared as static, as shown in the following:MyFormatter.toRomanNumber( $F{MyInteger}.intValue() )
The function operand toRomanNumber is a static method of the
MyFormatter class, which takes an int as argument (the conversion
from Integer to int is done by means of the intValue() method; it
is required only when using Java as language) and gives back the
Roman version of a number in a lace.This technique can be used for many purposes; for example, to
read the text from a CLOB field or to add a value into a HashMap (a
convenient Java object that represents a set of key/value
pairs).3.6 Using Java as a Language for ExpressionsFirst of all, there
is no reason to prefer Java over other languages when working with
iReport. It is the first language supported by JasperReports and
this is the only reason for which it is still the commonly-used
language (and the default one).Following are some examples of Java expressions: This is an
expressionnew Boolean(true)
new Integer(3)
(($P{MyParam}.equals(«S»)) ? «Yes» : «No»)
The first thing to note is that each of these expressions
represents a Java Object, meaning that the result of each
expression is a non-primitive value. The difference between an
object and a primitive value makes sense only in Java, but it is
very important: a primitive value is a pure value like the number 5
or the Boolean value true. Operations between primitive values have
as a result a new primitive value, so the expression:5+5
results in the primitive value 10. Objects are complex types
that can have methods, can be null, and must be instanced with the
keyword new most of the time. In the second example above, for
instance (new Boolean(true)), we must wrap the primitive value true
in an object that represents it.By contrast, in a scripting language such as Groovy and
JavaScript, primitive values are automatically wrapped into
objects, so the distinction between primitive values and objects
wanes. When using Java, the result of our expression must be an
object, which is why the expression 5+5 is not legal as-is but must
be fixed with something like this:new Integer( 5 + 5 )
The fix creates a new object of type Integer representing the
primitive value 10.So, if you use Java as the default language for your
expressions, remember that expressions like the following are not
valid: 3 + 2 * 5true
(($P{MyParam} == 1) ? «Yes» : «No»)
These expressions dont make the correct use of objects. In
particular, the first and the second expressions are not valid
because they are of primitive types (integer in the first case and
boolean in the second case) which do not produce an object as a
result. The third expression is not valid because it assumes that
the MyParam parameter is a primitive type and that it can be
compared through the == operator with an int, but it cannot. In
fact, we said that parameters, variables, and fields are always
objects and primitive values cannot be compared or used directly in
a mathematical expression with an object.Since JasperReports is compiled to work with Java 1.4, the
auto-boxing functionality of Java 1.5, that would in some cases
solve the use of objects as primitive values and vice versa, is not
leveraged.3.7 Using Groovy as a Language for ExpressionsThe modular
architecture of JasperReports provides a way to plug in support for
languages other than Java. By default, the library supports two
additional languages: Groovy and JavaScript (the latter starting
with version 3.1.3).41 -
iReport Ultimate GuideGroovy is a full language for the Java 2
Platform. Inside the Groovy language you can use all classes and
JARs that are available for Java. Table 3-4 compares some typical
JasperReports expressions written in Java and Groovy.The following is a correct Groovy expression:new
JREmptyDataSource($F{num_of_void_records})JREmptyDataSource is a class of JasperReports that creates an
empty record set (meaning with the all fields set to null). You can
see how you can instance this class (a pure Java class) in Groovy
without any problem. At the same time, Groovy allows you to use a
simple expression like this one:5+5
The language automatically encapsulates the primitive value 10
(the result of that expression) in a proper object. Actually, you
can do more: you can treat this value as an object of type String
and create an expression such as:5 + 5+ my value
Whether or not such an expression resolves to a rational value,
it is still a legal expression and the result will be an object of
type String with the value:10 my value
Hiding the difference between objects and primitive values,
Groovy allows the comparison of different types of objects and
primitive values, such as the legal expression:$F{Name} == John
This expression returns true or false, or, again:
Groovy provides a way to greatly simplify expressions and never
complains about null objects that can crash a Java expression
throwing a NullPointerException. It really does open the doors of
JasperReports to people who dont know Java.3.8 Using JavaScript as a Language for ExpressionsJavaScript is
a popular scripting language with a syntax very similar to Java and
Groovy. The support for JavaScript has been requested for a long
time from the community and was finally introduced in JasperReports
3.1.2, using the open source Rhino JavaScript implementation.JavaScript has a set of functions and object methods that in
some cases differ from Java and Groovy. For example, the method
String.startsWith(…) does not exist in JavaScript. The good news
is that you can still use Java objects in JavaScript. A simple
example is:Table 3-4 Groovy and Java code samples
Expression Java Groovy
Field $F{field_name} $F{field_name}
Sum of two double fields
new Double($F{f1}.doubleValue() + $F{f2}.doubleValue()) $F{f1} +
$F{f2}Comparison of numbers
new Boolean($F{f}.intValue() == 1) $F{f} == 1
Comparison of strings
new Boolean($F{f} != null && $F{f}.equals(«test»)) $F{f}
== «test»$F{Age} > 18 Returns true if the Age object interpreted as a
number is greater than 18.340 < 100 Always returns false.
340.substring(0,2) < 100 Always returns true (since the
substring method call will produce the string 34, which is less
than 100).42 -
Basic Notions of JasperReports(new
java.lang.String(«test»)).startsWith(«t»)This is a valid JavaScript expression. As you can see, we are
able to create a Java object (in this case a java.lang.String) and
use its methods.JavaScript is the best choice for people who have absolutely no
knowledge of other languages, since it is easy to learn and there
are plenty of JavaScript manuals and references on the web. The
other significant advantage is that it is not interpreted at run
time, but generates pure Java byte-code, instead. As a result, it
produces almost the same performance as Java itself.3.9 Using JasperReports Extensions in iReportJasperReports
provides several ways to extend its functionality. In general,
extensions (like components, fonts, query executors, chart themes,
and so on) are packaged in JARs. To use these extensions in
iReport, just add the required JARs to the iReport classpath. The
iReport classpath is composed of static and reloadable paths.
Extensions must be set as static paths, while other objects which
dont require a proper descriptor or special loading mechanism (such
as scriptlets and custom data sources) can be reloadable.3.10 A Simple ProgramI finish this introduction to JasperReports
by presenting an example of a simple program that shows how to
produce a PDF file from a Jasper file using a data source named
JREmptyDataSource, which is a utility data source that provides
zero or more records without fields. The file test.jasper,
referenced in the example, is the compiled version of the code in
Code Example 3-1.Code Example 3-2 JasperTest.java
import net.sf.jasperreports.engine.*;
import net.sf.jasperreports.engine.export.*;
import java.util.*;
public class JasperTest
{
public static void main(String[] args)
{
String fileName = «/devel/examples/test.jasper»;
String outFileName = «/devel/examples/test.pdf»;
HashMap hm = new HashMap();
try
{
JasperPrint print = JasperFillManager.fillReport(
fileName,
hm,
new JREmptyDataSource());
JRExporter exporter =
new net.sf.jasperreports.engine.export.JRPdfExporter();43
-
iReport Ultimate Guideexporter.setParameter(
JRExporterParameter.OUTPUT_FILE_NAME,
outFileName);
exporter.setParameter(
JRExporterParameter.JASPER_PRINT,print);
exporter.exportReport();
System.out.println(«Created file: » + outFileName);
}
catch (JRException e)
{
e.printStackTrace();
System.exit(1);
}
catch (Exception e)
{
e.printStackTrace();
System.exit(1);
}
}
}
Code Example 3-2 JasperTest.java, continued44
-
Report StructureCHAPTER 4 REPORT STRUCTURE
In this chapter we will analyze the report structure, the
underlying template that determines the style and organization of a
report. We will see the parts that compose it and how they behave
in relation to input data as iReport creates an output report.This chapter has the following sections: Bands Working with
Bands Summary4.1 BandsA report is defined by means of a type page. This page
is divided into different horizontal portions named bands. When the
report is joined with data to run the print, these sections are
printed many times according to their function (and according to
the rules that the report author has set up). For instance, the
page header is repeated at the beginning of every page, while the
Detail band is repeated for every elaborated record.Figure 4-1 on page 46 shows a type page divided into the nine
main pre-defined bands to which new groups are added. In fact,
iReport manages a heading band (Group header) and a recapitulation
band (Group footer) for every group. Detail, Group Header and Group
Footer bands can then be split further into several bands, so we
can have Detail 1, Detail 2, and so on.A band is always as wide as the usable page width (that is,
excluding the right and left margins). However, its height, even if
it is established during the design phase, can vary during the
print creation according to the contained elements; it can lengthen
towards the bottom of page in an arbitrary way. This typically
occurs when bands contain subreports or textfields that have to
adapt to the content. Generally, the height specified by the user
should be considered the minimal height of the band. Not all bands
can stretch dynamically according to the content, in particular the
Column Footer, Page Footer and Last Page Footer bands.In general, the sum of all band heights (except for the
background) always has to be less than or equal to the page height
minus the top and bottom margins. This rule actually is much more
complicated, in fact, there are several different cases and options
that must be considered; for example, the Title band may be printed
on a different page, the Page Footer and the Last Page Footer may
have different sizes and are never considered together, and so on.
For your convenience, the maximum allowed band size is dynamically
calculated at design time by iReport, which prevents the user from
setting invalid band heights (which would lead to a layout
verification error at compile time). 45 -
iReport Ultimate GuideThe following is a list of the pre-defined
bands:Figure 4-1 Pre-defined bands of a document
Title The Title band is the first visible band. It is created
only once and can be printed on a separate page. Regarding the
defined dimensions, it is not possible during design time to exceed
the report page height (top and bottom margins are included). If
the title is printed on a separate page, this band height is not
included in the calculation of the total sum of all band heights,
which has to be less than or equal to the page height.Page Header The PageHeader band allows you to define a header at
the top of the page. The height specified during the design phase
usually does not change during the creation process (except for the
insertion of vertically re-sizable components, such as textfields
that contain long text and subreports). The page header appears on
all printed pages in the same position defined during the design
phase. Title and Summary bands do not include the page header when
printed on a separate page.Column Header The ColumnHeader band is printed at the beginning
of each detail column. (The column concept will be explained in the
Columns section later in this chapter.) Usually, labels containing
the column names of the tabular report are inserted in this
band.46 -
Report Structure4.1.1 Report PropertiesNow that you have seen
the individual parts that comprise a report, you can proceed to
create a new one. Select New Empty Report from the File menu,
choose a name for the document, and click the Finish button. A new
empty report will appear in the design area of the main window.Group Header A report can contain zero or more group bands,
which permit the collection
Содержание
- Редактор jrxml-шаблонов iReport
- Выбор типа шаблона
- Общие настройки
- Определение стиля шаблона
- Управление секциями шаблона
- Добавление поля, параметра, переменной
- Визуальные компоненты jrxml-шаблона
- Microsoft исправила очередную проблему с печатью в Windows
- Как исправить проблему с печатью в Windows
- После обновления в Windows 10 перестали запускаться некоторые программы. Что делать
- Под подозрением Avast, но может потребоваться удалить апдейт Windows
- Портативная программа не запускается.
- Портативная программа не запускается? Приступаем.
- Как удалить неисправный драйвер, который блокирует запуск Windows 10
Редактор jrxml-шаблонов iReport
Визуальный редактор iReport Designer предназначен для создания jrxml-шаблонов, используемых при создании отчетов в JasperReports. Скачать последнюю версию iReport Designer можно на официальной странице производителя Jaspersoft Community.
На странице описывается применение iReport Designer для создания jrxml-шаблона, который используется в примере на странице JasperReports. Там же приводится и описание структуры jrxml-шаблона и исходные данные для отчета.
Выбор типа шаблона
Для определения типа шаблона необходимо выбрать пункт меню File/New, которое откроет окно с набором различных типов.

Выбираем шаблон по умолчанию. Далее нажимаем на кнопку «Open this Template» и переходим к определению наименования шаблона и директории его расположения.

Если нажать на первом шаге кнопку «Launch Report Wizard», то дополнительно можно будет определить источник данных и параметры подключения к нему, поля в отчете и т.д. Для первого отчета это можно пропустить, тем более что в примере база данных не используется.
После определения первичных параметров откроется окно с заготовкой jrxml-шаблона. Слева в интерфейса располагается Report Inspector, определяющий структуру шаблона. По центру сам шаблон, который можно переключать в режим Designer, XML и Preview кнопками, расположенными сверху над ним. Справа располагается панель свойств Properties элементов шаблона. Дополнительные панели различных свойств шаблона представлены в пункте меню Window.

Общие настройки
Первоначально проверяем язык Language. Для этого выделяем корневой элемент в Report Inspector и в панели свойств Properties меняем Language с Groovy (по умолчанию) на Java.
Определение стиля шаблона
Для определения стиля jrxml-шаблона выделяем элемент Styles и правой клавишей мыши выбираем контекстный пункт меню Add/Style.

В панели свойств устанавливаем соответствующие значения : «Pdf Font name», «Pdf Encoding».

Можно напрямую определить значения стиля в jrxml-шаблоне после перевода его в режим XML.
Управление секциями шаблона
Удаляем не используемые в нашем первом отчете секции. Для этого необходимо выделить соответствующую секцию в панели Report Inspector и в контекстном меню (открыть правой клавишей мыши), выбрать пункт «Delete Band». Не используемая в шаблоне секция становится в Report Inspector серой. Чтобы добавить секцию в шаблон необходимо в контекстном меню выбрать «Add Band».
В шаблоне оставляем только секции Title, Column Header и Detail1.
Добавление поля, параметра, переменной
Для добавления поля в шаблон необходимо выделить элемент Fields в «Report Inspector» и выбрать в контекстном меню «Add Field».

После этого следует определить наименование и тип/класс поля в панели свойств Properties. Дополнительно можно добавить комментарий к полю (Description).

К элементу Fields добавляем поля state(java.lang.String), item(java.lang.String), date(java.util.Date), quantity(java.lang.Integer), price(java.lang.Integer).
К элементу Parameters добавляем параметр DATE и определяем тип java.util.Date.
К элементу Variables добавляем переменную cost c типом java.lang.Integer, для которой необходимо определить в качестве свойства выражение «Variable Expression». Это можно сделать в отдельном окне, нажав на кнопку «…» в поле «Variable Expression» панели свойств.

Визуальные компоненты jrxml-шаблона
Для формирования интерфейса шаблона необходимо использовать панель «Palette», которую можно открыть либо горячими клавишами Ctrl+Shift+8, либо выбрать пункт меню Window/Palette. Панель «Palette» будет помещена в панель свойств «Properties».


Для заголовков колонок используем компоненты «Static Text», для каждого из которых определяем текст и фон. На следующих двух скриншотах представлены панели «Report Inspector» и «Properties» с выделенным заголовком «Стоимость».


Итоговый интерфейс jrxml-шаблона для описанного на странице JasperReports примера представлен на следующем скриншоте.

Генерируемый на основе шаблона отчет можно увидеть здесь.
Продолжение статьи с рассмотрением группировки и суммирования данных, а также нумерации данных в секции, можно увидеть здесь.
С примером настройки JDBC в приложении iReport и формированием JasperReport отчета можно познакомиться здесь.
Источник
Microsoft исправила очередную проблему с печатью в Windows
Редмонд отмечает, что проблеме подвержены принтеры в определенных средах, которые используют технологию удаленной печати «Point and Print». Пользователи получают сообщение об ошибке «Вы доверяете этому принтеру?» при попытке выполнить любое задание печати на затронутом устройстве. Microsoft рекомендует входить в учетную запись администратора каждый раз, когда требуется напечатать документ или подключиться к серверу печати.
Собственное расследование Microsoft показало, что проблема вызвана конфликтом имени файла. Дело в том, что драйвер принтера на клиенте печати и сервере печати используют одно и то же имя файла, но на сервере используется более новая версия файла. Когда клиент подключается к серверу, то обнаруживается новый файл драйвера и предлагается обновить драйверы на клиенте печати. Однако, предлагаемый для установки файл не содержит более позднюю версию.
Компания Microsoft предлагает клиентам, столкнувшимся с данной проблемой, установить новейшие версии драйверов на всех устройствах печати. Нужно убедиться, что на клиенте и сервере печати используются одни и те же версии драйверов.
Данная проблема затрагивает все основные версии Windows, которые поддерживаются Microsoft.
Клиенты печати: Windows 10, версия 21H1; Windows 10, версия 20H2; Windows 10, версия 2004; Windows 10, версия 1909; Windows 10, версия 1809; Windows 10 Enterprise LTSC 2019; Windows 10 Enterprise LTSC 2016; Windows 10, версия 1607; Windows 10 Enterprise 2015 LTSB; Windows 8.1; Windows 7 SP1
Серверы печати: Windows Server 2022; Windows Server, версия 20H2; Windows Server, версия 2004; Windows Server, версия 1909; Windows Server, версия 1809; Windows Server 2019; Windows Server 2016; Windows Server 2012 R2; Windows Server 2012; Windows Server 2008 R2 SP1; Windows Server 2008 SP2
Как исправить проблему с печатью в Windows
Microsoft опубликовала отдельную страницу поддержки KB5005652 с дополнительной информацией о проблеме.
Компания изменила логику установки и обновления драйверов принтера. Пользователи без привилегий администратора не могут устанавливать или обновлять драйверы принтера с удаленных компьютеров или серверов. Для выполнения этих операций сначала нужно будет получить повышенные права.
Microsoft создала новый ключ реестра, который восстанавливает прежнее поведение:
Пользователям Windows в средах Point and Print доступно четыре способа для установки и обновления драйверов принтера:
Microsoft выпустила несколько обновлений для процедуры печати в Windows. Некоторые из них исправляют уязвимость PrintNightmare, другие устраняют проблемы, не связанные с безопасностью, в частности сбои BSOD.
Большинство устройств домашних пользователей данная проблема не затрагивает, но они могут столкнутся с еще одной проблемой, которая остается неисправленной после сентябрьского «Вторника Патчей».
А вы сталкиваетесь с проблемами при печати в Windows?
Источник
После обновления в Windows 10 перестали запускаться некоторые программы. Что делать
Под подозрением Avast, но может потребоваться удалить апдейт Windows
Выпущенный в начале недели накопительный апдейт Windows 10 принес пользователям не только крупнейшее в истории ОС обновление системы безопасности, но и немало неприятностей. К уже известным проблемам с принтерами, вторыми мониторами и пропадающими файлами, теперь добавилась проблема с запуском приложений.

Пользователи начали жаловаться на ошибку Windows cannot find [*.exe] (Windows не удаётся найти файл) при запуске многих приложений, включая Steam, Discord и приложения пакета Microsoft Office, например, Word или Excel.

Проблема появилась после установки апдейтов с номером KB4557957 для новейшей версии Windows 10 2004 (May 2020 Update) и с номером KB4560960 — для версии 1909 (November 2019 Update). Оба апдейта вошли в состав традиционного ежемесячного «обновления по вторникам» (Patch Tuesday), выпущенного Microsoft 9 мая.
Исследовавшие проблему энтузиасты заметили, что по каким-то причинам в системе появились некорректные записи IFEO (Image File Execution Options), что не позволяет корректно запускать программы. Также они отмечают интересное совпадение — недавнее обновление антивируса Avast стало причиной появления некорректных записей IFEO.
Тем не менее, однозначно связать эти два события пока нельзя. У одних обновление Avast сыграло свою роль, но некоторые пользователи заявляют, что проблемы с запуском приложений начались, несмотря на отсутствие установленного Avast. Судя по всему, запуску программ могут мешать как Avast, так и накопительное обновление Windows 10, независимо друг от друга.
Avast уже выпустила свежее обновление, которое устраняет ошибку. Если у вас установлен Avast, то стоит обновить его до самой новой версии. Если вы не пользуетесь Avast, а проблемы с приложениями наблюдаются, то поможет удаление обновлений Windows KB4557957 или KB4560960.
Источник
Портативная программа не запускается.
Почему портативная программа не запускается в Windows 10? В этой статье я предложу вам возможное решение проблемы с запуском портативной версии какой-то программы, которая отказывается запускаться в Windows. Лично у меня, как, вероятно, и у вас, симптомы были таковы: скачанный из сети исполнительный файл отлично единожды отработал. Однако после попытки запустить его повторно, кроме окна UAC о запуске, на экране ничего не появляется. Диспетчер задач молчит, в списке запущенных программ портативного приложения нет. Не помогает переприсвоение прав и отключение антивируса. Логи Windows молчат.
у пользователя полный набор прав, однако портативная программа не работает
Предупреждаю сразу: метод сработал не для всех портативных приложений. Попытка запустить Portable Microsoft Office XX успехом не увенчалась. Однако остальные до того работавшие «портативки» отработали.
Портативная программа не запускается? Приступаем.
Скачали её архивом? Распакуйте и проверьте свойства папки или файла во вкладке Безопасность. Если во вкладке Общие обнаружите кнопку Разблокировать, щёлкните по ней и Примените.

Копируйте папку или файл (если тот в единственном экземпляре) и отправьте его в корень диска С:. У меня в примере теперь фигурирует папка с набором портативных утилит.
Расшарим папку, предоставив к ней общий доступ. Укажем имя (единственного в моём случае) пользователя:
Открываем окно проводника Windows любым способом и в строке адреса наберём Сеть:
Выберем собственный компьютер и откроем его в том же окне проводника. Папка появилась:
Теперь запускаю портативные программы только отсюда. И они запускаются:
У меня всё. Кстати, созданный из контекстного меню ярлык для утилиты можно отправить на Рабочий стол, откуда он будет портативную программу отлично запускать в нужный момент.
Источник
Как удалить неисправный драйвер, который блокирует запуск Windows 10
Многие пользователи Windows сталкиваются с такой ситуацией, когда установка новых драйверов приводит к неправильной работе устройств, при этом иногда блокируется запуск самой системы. Мы расскажем, как все исправить с помощью встроенной среды восстановления.


При загрузке и установке драйверов для различных компонентов ПК может оказаться так, что файл скачивается с ошибкой или он просто не соответствует установленному оборудованию. Иногда Windows просто не может его загрузить из-за плохой работы сервера. В итоге старые драйверы будут удалены, а новые так и не установятся правильно Такой сбой в инсталляции в конечном итоге приводит к фатальным последствиям, в том числе т.н. «синему экрану смерти» (BSOD), что не даст загрузиться на Рабочий стол.
Если это происходит, то, само собой разумеется, ваши возможности по исправлению ситуации очень ограничены, т.к. удаление драйвера становится не простым делом без доступа к самой Windows. К счастью, это можно сделать из «Среды восстановления Windows», которая была специально разработана, чтобы помочь вам справиться с проблемами, мешающими загрузке ОС. Вот как Microsoft характеризует работу инструмента WinRE:
«Среда восстановления Windows (WinRE) — это инструмент для ремонта ОС, который поможет устранить распространенные причины не загружаемых операционных систем. WinRE основан на среде предустановки Windows (Windows PE) и может быть настроен с помощью дополнительных драйверов, языков, дополнительных компонентов Windows PE и других средств устранения неполадок и диагностики. По умолчанию WinRE предварительно загружается в Windows 10 для настольных изданий (Home, Pro, Enterprise и Education) и Windows Server 2016 ».

Есть несколько способов получить доступ к WinRE, но в случае, если ваш компьютер не загружается, единственным способом является обращение к исходному установочному носителю ОС. Если у вас его нет под рукой, то есть вариант скачать дистрибутив MediaCreationTool с официального сайта Microsoft на другом работающем ПК и развернуть его в качестве загрузочной флешки. Далее нужно загрузиться с ее и выбрать не инсталляцию, а пункт восстановления системы. Далее следуйте приведенной ниже инструкции после пункта Перезагрузить сейчас.
Теперь расскажем о ситуации, когда все же есть возможность загрузиться на Рабочий стол. В этом случае нужно инициировать перезапуск в режим восстановления:
Нажмите кнопку Пуск > Параметры > Обновление и Безопасность > Восстановление > Особые варианты загрузки > Перезагрузить сейчас

После перезагрузки нужно выбрать вариант с запуском командной строки, чтобы можно было удалить неисправный драйвер. Командная строка позволяет получить полную информацию о драйверах, работающих на вашем устройстве. Вызвать ее можно с помощью такой команды:
Dism /image:C: /Get-Drivers

Если Windows установлена на диске с буквой, отличной от C:, убедитесь, что вы соответственно изменили вышеупомянутую команду.
На этом этапе вам должен быть предоставлен исчерпывающий список драйверов на вашем компьютере, и строка, которая вас интересует, называется «Имя публикации». Сторонние драйверы именуются с использованием правила oemX.inf, где X — это число, которое начинается с 0 и увеличивается по мере обнаружения большего количества драйверов на устройстве.
Как только вы определите, какой драйвер необходимо удалить, введите следующую команду, чтобы удалить его:
DISM /Image:C: /Remove-Driver /Driver:oemX.inf
Измените букву диска и файл драйвера (после двоеточия) в соответствии с вашими путями ОС. Если вы делаете это правильно, вы должны увидеть следующее сообщение в командной строке:
Found 1 driver package (s) to remove.
Removing 1 of 1 – oemX.inf: The driver package was successfully removed.
The operation completed successfully.
На этом этапе вы можете перезагрузить компьютер и проверить, правильно ли запускается Windows без неисправного драйвера.
Если вам интересно, как вы можете определить, какой драйвер вызывает проблемы с загрузкой на вашем устройстве Windows, нет общего ответа на эту дилемму. В большинстве случаев виновниками являются только что обновленные драйверы, поэтому вам следует начать с удаления драйверов, которые были установлены только что или обновлены, перед перезагрузкой или выключением устройства.
Описанный здесь метод не работает при загрузке Windows в обычном режиме, так как он рассчитан на работу с установочным комплектом операционной системы, т.е. в среде восстановления Windows. Те же шаги можно использовать для устранения проблем с драйверами, которые не позволяют загружать устройство и в предыдущих версиях Windows, включая Windows 7 и Windows 8.1. Поддерживаются все версии Windows 10, включая следующую версию 2004, которая выйдет весной.
Источник
Contents
- 1 Introduction to iReport
- 2 iReport Basics
- 2.1 Data Sources
- 2.2 Fields
- 2.3 Variables
- 2.4 Parameters
- 2.5 Bands
- 2.6 Groups
- 2.7 Subreports
- 2.8 Crosstabs, Charts, and Formatting Elements
| How To |
|---|
|
Introduction to iReport
iReport Designer (also known as iReport) is a third-party application that allows you to generate custom-defined reports on IMSMA data. Using iReport, you may define the attributes that are returned by a report and also customise the appearance of the report. Report templates designed in iReport can be imported into IMSMANG and run by IMSMANG users to extract data based on search criteria. Reports can be exported to PDF, RTF, XLS, and other formats. iReport Designer version 5.0.1 is included with the IMSMANG distribution. Using iReport Designer, users create .jrxml iReport templates, a kind of xml report definition, that can be used by IMSMANG to produce a formatted report.
| |
iReport does not support Java 8. |
iReport Basics
iReport uses standard reporting terms to refer to the basic building blocks of report templates.
Data Sources
Data sources in iReport refer to the connection between the report template and the IMSMANG database. Each iReport template will have one data source. Data sources in iReport generally refer to items in IMSMANG such as Land, Activity, Education, Accident, Victim, etc. Available data sources include:
| Accident Device | MRE |
| Accident | MRE Detail |
| Assistance Classification | Needs Assessment Classification |
| Cause Classification | Ordnance |
| Field Report | Organisation |
| Gazetteer | Place |
| Geopoint | QM |
| Geospatialinfo | Question |
| Hazard | Received MRE |
| Hazard Device | Task |
| Hazard Reduction | Victim |
| Hazard Reduction Device | Victim Assistance |
| Impact Survey | Victim Assistance Assistance |
| Interviewee | Victim Cause |
| Link | Victim Needs Assessment |
| Location | Work Item |
The iReport datasource management and selection window can be found just below the menu bar in iReport Designer.
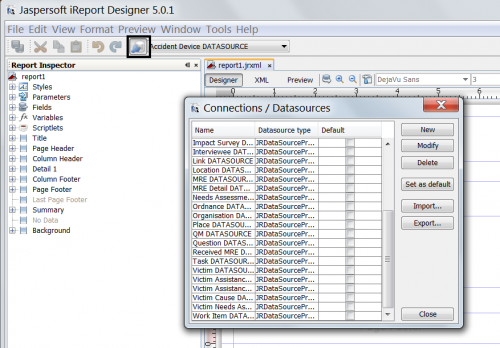
iReport Datasource Selection Window
Fields
Fields in iReport refer to individual IMSMA data elements that are available from a data source. Fields are denoted in iReport using the following syntax $F{fieldname} (e.g. $F{guid}). Each data source contains a list of available fields.
Variables
Variables in iReport are created within the iReport template to manipulate or calculate data. Using variables, users can create calculations such as sums, counts, averages, or other totals. Variables are denoted in iReport using the following syntax $V{variablename} (e.g. $V{SumAreaSize}). Variables can use field and/or parameter data.
Parameters
Parameters in iReport are used to accept and transfer external information, such as information from another report. Parameters are denoted in iReport using the following syntax $P{parametername} (e.g. $P{ParentGuid})
Bands
Bands are used in iReport to specify areas on the resulting report. Each band acts differently in a report. The most used bands in iReport are:
| Band Name | Use |
|---|---|
| Title | Displayed once at the beginning of the report |
| Column or Group Header | Displayed at the top of each page or section |
| Detail | Displayed once for each data row returned by the report. Most often data elements will exist in this band. |
| Summary | Displayed once at the end of the report. Useful for charts, crosstabs, and totals. |
Groups
Groups in iReport are used to display records with one or more common values together on a report. For example, Land with the same value for «Province» could be grouped together in a report. Groups can be added in the iReport Wizard or after a report has been created.
Subreports
Subreports are used in iReport to include more than one data source in a report. For example, to include information about Activities performed on a particular Land, you would include an Activity subreport in the Land report.
Crosstabs, Charts, and Formatting Elements
In addition to the iReport elements addressed above, additional specialized iReport elements are available to include in iReport templates including Crosstabs, Charts, and additional formatting elements such as lines, rectangles, etc. Crosstabs and chart elements typically belong only in the Summary band of a report while formatting elements including images can be included anywhere within the report template.
| |
All field, variable, and parameter references in IMSMANG are case-sensitive |
|
Customising IMSMANG |
||||||
|---|---|---|---|---|---|---|
| Standardising Data Analysis and Information Reporting |
|
1.iReport-designer download address:http://community.jaspersoft.com/project/ireport-designer

2. After the installation is complete, run iReport, first we need to create a data source, here use MySql database as the data source of the report


Select JDBC connection:
Fill in the correct database related parameters:

Then after the test connection is successful, save the current connection configuration. After the completion, a new connection appears in the connection list, and automatically select the default connection by default.

3. Now let’s start creating a new report.
Select «File» -> «New», the template picker appears, select a blank report, and then click to open this template

Fill in the report name and location, click Next, then complete
Display the work interface after completion

4. Next we need to associate the data source
Click the Database Query Designer button in the toolbar, which will open the Query dialog

In the query dialog, enter a simple SQL query and select all fields/columns. Of course, you can use any table. For this example, we are using the acc_user table in the sample database. When you type SQL, iReport executes the query, extracts all the fields, and lists them in the bottom window. If there is an error in the SQL, you will get a message stating what is wrong.

When the query is valid, click «OK», you can find that all the fields in the data source are automatically added to the Fields

5. At this point, we can design our report.
Drag fields from Fields to the Detail field, add other elements (such as lines or labels), drag them from the palette to the design view, then adjust and arrange them at will

To preview a report, click the Preview toolbar in the designer to switch to preview mode. The preview report is compiled in the background, populated by the JDBC connection query retrieved data.

The Detail field repeats each row in the query results to create a simple report.
