Введение
Я — системный аналитик, и моя работа заключается в том, чтобы проектировать автоматизированные информационные системы. Впрочем, нет, она заключается в том, чтобы писать и писать документы. Третий раз слово «писать» повторять не буду — все-таки, не «Илиада». Но занудность формы чем-то определенно роднит проектную документацию с древнегреческой поэмой, особенно если речь идет о работе с государственным заказчиком.
Диаграммы — глоток творчества в этом море текста. О диаграммах и пойдет речь в данной статье. Если точнее — о PlantUML — с моей точки зрения, наиболее адекватном инструменте их создания на текущий момент.
Уверен, многие слышали о PlantUML, по крайней пере, на GitHub у него стоит больше тысячи звезд. Смысл этого инструмента исключительно прост, он всего лишь позволяет задавать диаграммы (по большей части в нотации UML) в виде текста, описывающего элементы и связи между ними. Графический вид создается автоматически. Далее приведен пример диаграммы деятельности.
start
:Вывалить мысли
в текст;
if (Бред?) then (Возможно)
    :Дать посмотреть коллеге;
    if (Сойдет?) then (Да)
    else (Нет)
        :Помедитировать над текстом;
    endif
    :Разместить на //Хабре//;
else (Точно)
    stop
endif
stop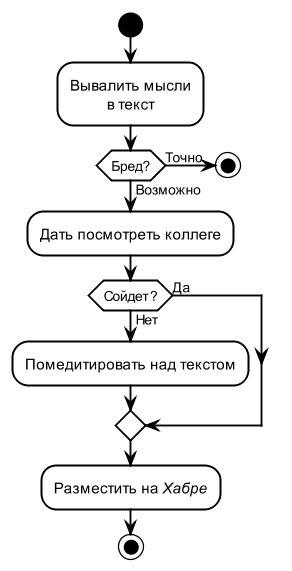
Несмотря на популярность, на Хабре очень мало статей, рассказывающих о практическом применении этого инструмента. Как мне кажется, PlantUML такого недостатка внимания не заслуживает.
В начале я расскажу, почему выбрал его в качестве основного инструмента визуального моделирования, а в конце приведу ряд рекомендаций, которые бы мне самому очень хотелось услышать, когда начал использовать данный инструмент.
Почему PlantUML
С моей точки зрения при создании диаграмм имеет смысл ориентироваться на следующие критерии: (1) диаграмма должна быть более менее небольшой, (2) диаграмма должна использовать более менее стандартную нотацию и (3) диаграмма должна быть более менее удобной с точки зрения управления проектной документацией.
Во всех трех случаях использовалось слово «более менее», потому что все эти критерии в конкретных ситуациях можно нарушать без ущерба для дела. Есть много больших диаграмм, созданных в самодельной нотации и доведенных до совершенства (та же карта метрополитена). Другой вопрос, что создание таких диаграмм — проекты, на которые потрачены серьезные ресурсы. Далеко не всегда (читай, никогда) такие ресурсы выделяются на создание автоматизированных информационных систем. Заказчику нужна совершенная система, а не совершенная диаграмма системы.
Тем не менее для меня эти критерии являются точкой отсчета, от которого начинаешь придумывать диаграмму. Дальше… как сложится.
Очень долгое время золотым сечением для себя я считал использование Microsoft Visio и рисовал там диаграммы, стараясь быть разумно близким к UML. При этом использовался стандартный набор компонентов, поскольку он дает больше свободы, чем специализированный stencil для UML. Также некоторые диаграммы для показа на проекторе рисовались в Microsoft PowerPoint.
Да, управлять такими диаграммами нельзя. Если поменялось название какой-либо сущности, открываем каждую диаграмму и меняем ее. Зато получается почти красиво. И есть определенная гибкость в формулировании мысли.
Также пробовал специализированные инструменты бизнес-моделирования: Rational Rose, Aris, Enterpise Architect (Sparx Systems), — в наибольшей степени Rational Rose. Проблема в том, что конечный результат моей работы — это документы. И в этом смысле, если что-то серьезное меняется в требованиях, все равно необходимо вручную проходить по всем проекту и заново вставлять диаграммы в нужные места текста. Что-то придумывать, возможно, автоматизировать в этой части мне показалось слишком сложным и не стоящим усилий.
С появлением PlantUML ситуация в корне изменилась.
-
Раз диаграммы создаются в виде текста, значит в любом текстовом редакторе (мне нравятся Atom и Notepad++) можно найти требуемый текст в наборе файлов и даже заменить его. Рефакторинг проекта вполне удобен. Также текстовый формат дает возможность легко организовывать групповую работу и осуществлять отслеживание изменений в системе контроля версий.
-
В PlantUML создавать диаграммы быстрее, чем в любых визуальных редакторах (по крайней мере, для меня). На этот счет есть и другие мнения, например, здесь говорится, что создание диаграммы в PlantUML дольше, чем, скажем в Enterpise Architect (Sparx Systems). Думаю, это скорее вопрос вкуса и привычки.
У меня был даже вполне успешный опыт, когда PlantUML использовался вместо доски (не было ее рядом), причем с людьми, весьма далекими от информационных технологий.
-
PlantUML достаточно гибко подходит к нотации UML. Поддерживая все основные ее элементы, он дает пользователю множество возможностей для их свободного использования в диаграмме. Например, очень удобной является поддержка использования вики-разметки в содержимом элементов.
Более того, разработчки PlantUML, видимо, ничего плохого в нарушении нотации не видят. И это большое достоинство данного инструмента. В конечном счете, клиент не должен знать, UML это или не UML — он должен понимать смысл диаграммы. Все, что ведет к улучшению восприятия смысла, хорошо.
И тем не менее PlantUML — это UML, т.е. общепринятая нотация, стандарт, а значит для документации, особенно в государственных проектах, очень подходит.
-
PlantUML не позволяет создавать больших диаграмм. Он распределяет элементы самостоятельно и, естественно, при большом количестве элементов результат начинает быть сомнительным. Но это не совсем ограничение. Обычно, когда PlantUML начинает выдавать неадекватный результат, понимаешь, что не PlantUML плохой, а диаграмма плохая, и лучше ее разделить или уменьшить количество несущественных деталей.
-
Диаграммы PlantUML можно генерировать автоматически. Пример такого использования приведен в здесь.
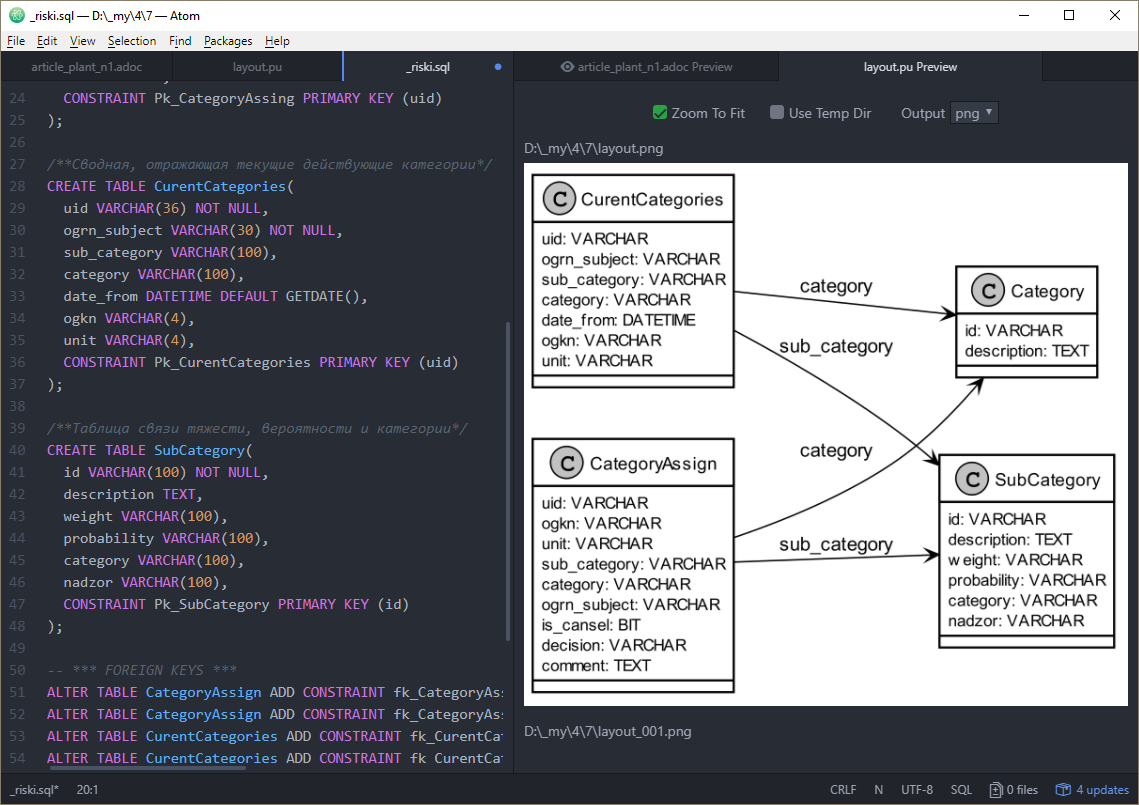
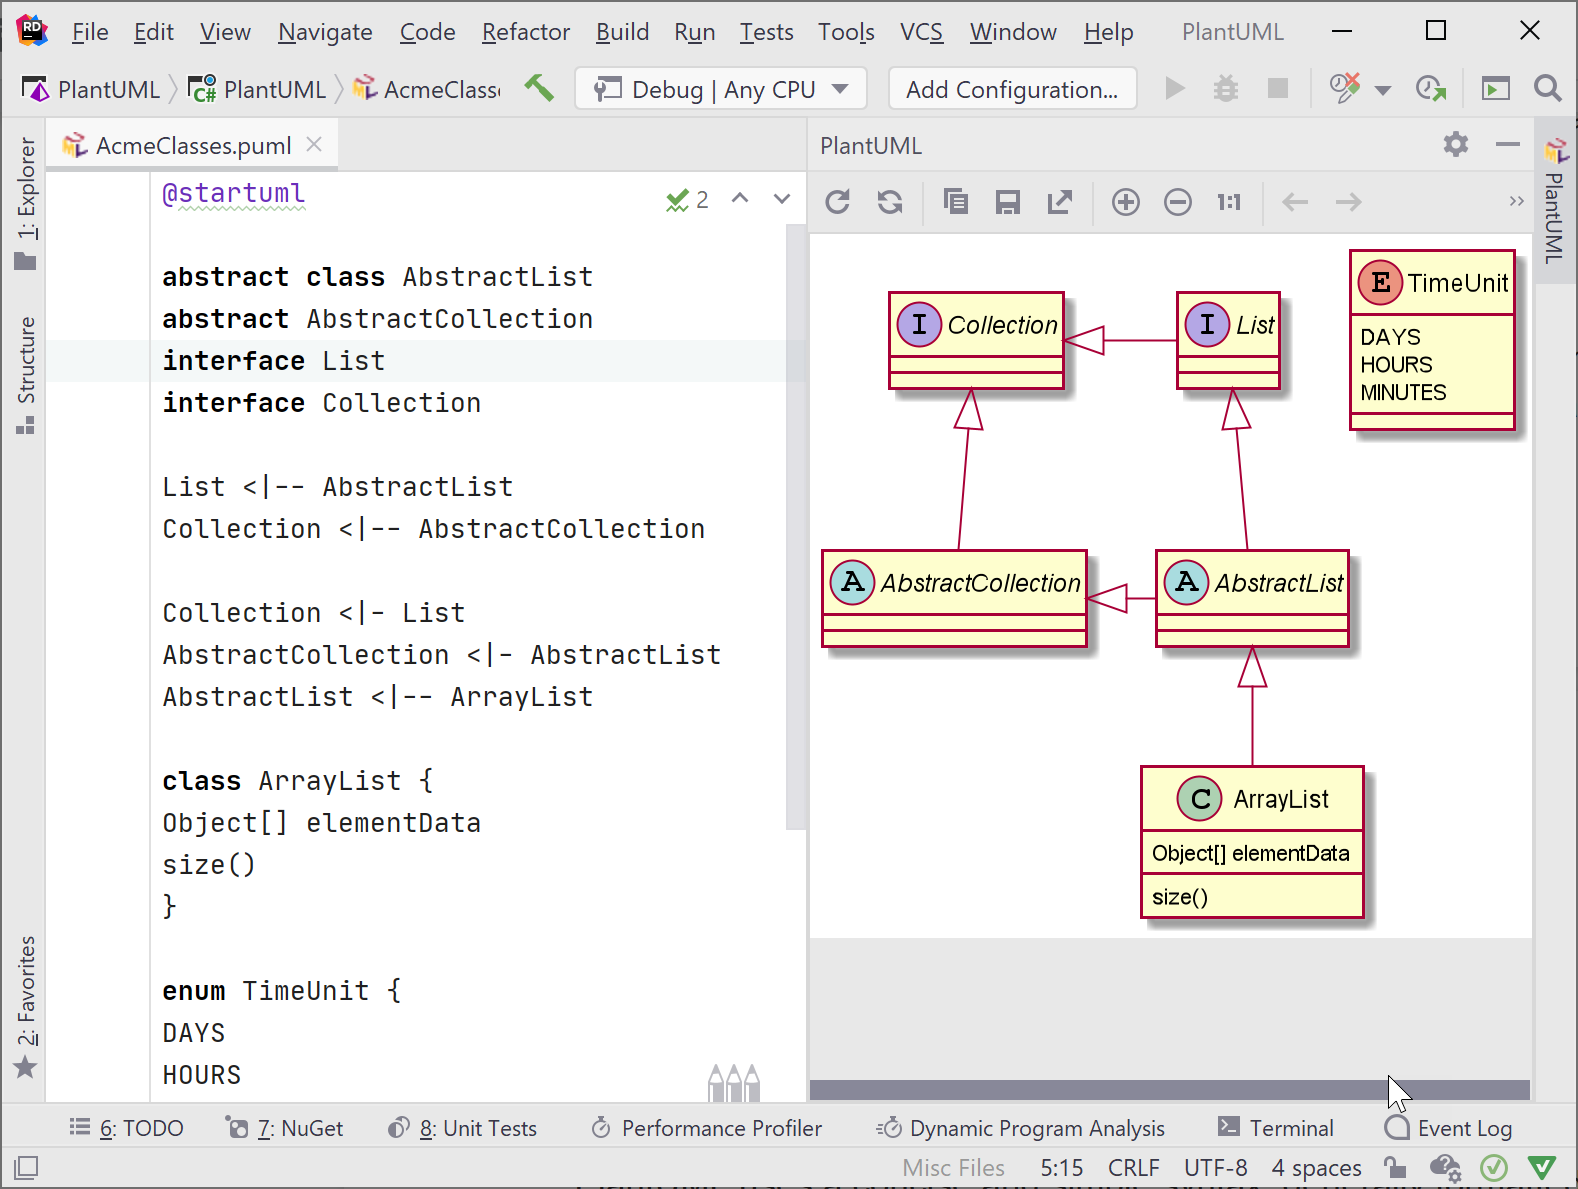
Мы используем PlantUML для автоматической генерации схемы базы данных. Функция такой генерации встроена в используемый нами инструмент управления структурой баз данных — 2bass. Таким образом, при сборке документации диаграмма классов со структурой БД находится всегда в актуальном состоянии. На следующем рисунке показан кусок описания структуры базы данных и автоматически созданная диаграмма.

Советы по использованию PlantUML
Мне кажется, многие не используют PlantUML, поскольку сталкиваются с определенными сложностями на начальном этапе, которые считают принципиально непреодолимыми. Многих отпугивает использование текста, ведь все привыкли к графическим редакторам. В этой части статьи приведены рекомендации, которые, надеюсь, позволят Вам быстро начать использовать PlantUML в боевых задачах.
Где создавать диаграммы?
Для начала хотелось бы упомянуть PlantUML Web Server — часть проекта PlantUML, на котором диаграммы можно создавать онлайн и делиться ими с коллегами. Это очень удобная возможность, но, конечно же, не при создании диаграмм для проектной документации.
Часто PlantUML используется в вики-движках. Здесь редактирование происходит стандартным образом: пишется текст, сохраняется, и на странице мы получаем картинку. Но все-таки, в большинстве случаев удобно, чтобы на диаграмме сразу отображался результат: например, в левом окне пишется спецификация диаграммы, в правом — отображается ее внешний вид. Готовый текст уже можно вставить в wiki.
На сайте PlantUML приведено много редакторов. Подозреваю, что среди них больше половины не пригодны для работы. Мне больше всего нравится создавать PlantUML-диаграммы с помощью plug-in’а PlantUML Preview в редакторе Atom. На самом деле таких plugin’ов несколько. PlantUML Preview мне понравился тем, что он не только показывает результат, но сразу (или в момент сохранения — в зависимости от настроек) создает графический файл, имя которого соответствует файлу со спецификацией диаграммы.
Т.е. каждой диаграмме всегда соответствует два файла, один текстовый (с текстовым описанием диаграммы), а другой — графический (картинка с диаграммой).
Поскольку мы всю документацию давно делаем с помощью Asciidoctor (удивительно, насколько отказ от Microsoft Word может облегчить работу, но это тема отдельной статьи), то картинки вставляем через ссылки. Для изменения картинки при такой технологии работы достаточно открыть текстовое описание, изменить его и сохранить. Делать операции экспорта или копирования через буфер обмена при этом не нужно.
Обратите внимание, что plug-in PlantUML Preview в своих настройках требует указания местонахождения файла planuml.jar, а сам PlantUML не будет работать, если не установлен GraphViz, оба приложения можно скачать с соответствующих сайтов. В последних версиях PlantUML идет последовательный отказ от использования Graphviz, поэтому в ближайшее время данный продукт станет более автономным. Это упростит его использование в системах автоматической сборки программной документации.
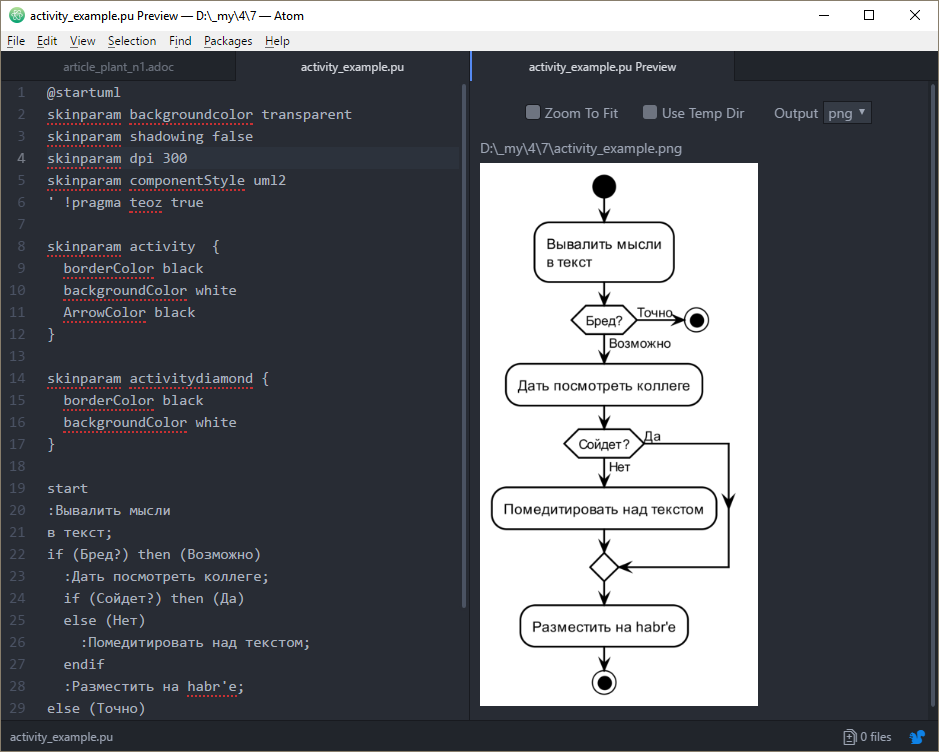
Подготовка диаграмм для печати
Для качественной печати на лазерном принтере необходимо указать параметр skinparam dpi 300. Разрешение в 300 dpi обеспечивает качественный рисунок для печати на лазерном принтере. В противном случае картинки создаются с экранным разрешением и выглядят растрированными. В PlantUML есть также возможность использовать svg (векторный формат). Но данный формат поддерживается гораздо меньше, чем png, и проблем с ним гораздо больше. Я использовал svg, если необходимо было немного довести картинку до ума векторным редактором (например, с использованием Inkscape). Но это, конечно же, крайне редкий вариант использования PlantUML.
Для убирания теней, которые обычно тоже портят печатный вид, используется параметр skinparam shadowing false.
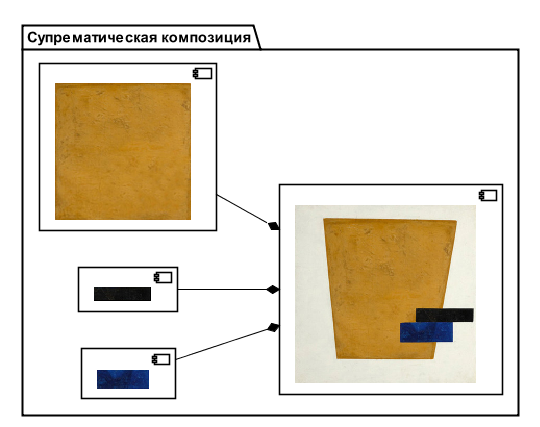
Кроме того, для печати диаграммы на черно-белом принтере желательно, чтобы она не имела полутонов. Цветовая схема, использующая коричневые и желтые цвета, для печати обычно не подходит. К счастью PlantUML позволяет задавать используемые цвета. Следующие параметры, например, обеспечивают отображение диаграммы компонентов в черно-белой палитре. Существует специальный параметр для монохромной генерации диаграммы (skinparam monochrome true), но он только убирает цвет, полутона остаются.
skinparam component {
  borderColor black
  backgroundColor white
  ArrowColor black
}
Перечень большинства параметров приведен здесь. Если хочется изучить все параметры, можно воспользоваться командой java -jar plantuml.jar -language.
Относительное расположение элементов
-
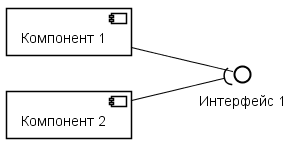
Параметр left to right direction делает так, чтобы элементы диаграммы отрисовывались слева направо. Не очень очевидно, но, например, для диаграммы компонентов это означает, что компоненты будут собраны в левой части, а интерфейсы — в правой.
component "Компонент 1" as c1
component "Компонент 2" as c2
interface "Интерфейс 1" as i1
c1 --() i1
c2 --( i1
-
Группировка с помощью элементов более высокого уровня.
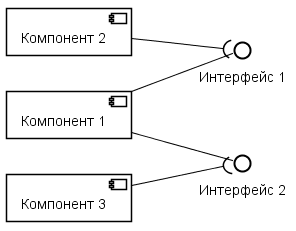
На следующем рисунке PlantUML распределил компоненты таким образом, чтобы было меньше пересечений линий. Такой порядок компонентов может оказать нежелательным, если мы хотим, чтобы компоненты отображались по порядку.
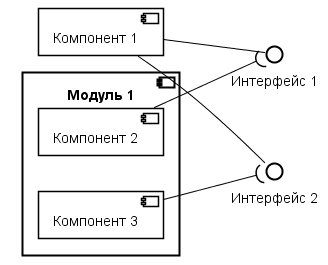
component "Компонент 1" as c1
component "Компонент 2" as c2
component "Компонент 3" as c3
interface "Интерфейс 1" as i1
c1 --() i1
c2 --( i1
interface "Интерфейс 2" as i2
c1 --() i2
c3 --( i2
Если мы сгруппируем второй и третий компонент, то как раз и добьемся того, чтобы компоненты были расположены по порядку.
component "Компонент 1" as c1
component "Модуль 1" {
component "Компонент 2" as c2
component "Компонент 3" as c3
}
interface "Интерфейс 1" as i1
c1 --() i1
c2 --( i1
interface "Интерфейс 2" as i2
c1 --() i2
c3 --( i2
-
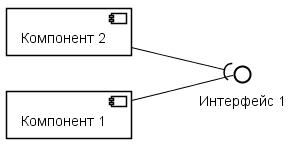
Порядок задания компонентов. Довольно спорный подход, но работает. В следующем примере на рисунке сначала отображается Компонент 2, т.к. в спецификации он указан первым.
component "Компонент 2" as c2
component "Компонент 1" as c1
interface "Интерфейс 1" as i1
c1 --() i1
c2 --( i1
В PlantUML есть еще возможность указывать направления стрелки. Например, чтобы указать, что стрелка идет из компонента 1 (c1) в интерфейс 1 (i1) слева направо, необходимо в спецификации стрелки указать букву «r»: c1 -r-() i1. В следующем примере явно указано, что стрелка из компонента 1 в интерфейс 1 идет слева направо, а из компонента два в этот же интерфейс справа налево.
component "Компонент 1" as c1
component "Компонент 2" as c2
interface "Интерфейс 1" as i1
c1 -r-() i1
c2 -l-( i1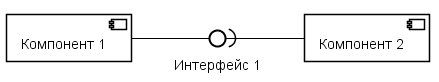
Мне кажется, это вредная возможность. Она запутывает спецификацию диаграммы и особенность интерпретации направления PlantUML’ем может быть весьма экзотичной. Кроме того, при указании параметра left to right direction буква «r» начинает означать сверху вниз (из-за смещения по часовой стрелке), что совсем уж запутывает схему.
Надписи в элементах диаграммы
Многострочный текст и wiki-разметка
PlantUML содержит неплохие средства для форматирования текста в элементах.
При генерации элемента диаграммы PlantUML исходит из размера текста. Т.е. не текст перетекает в зависимости от размера элемента, а размер элемента подстраивается под текст.
Самый простой вариант создания большого текста — использование символа «n». В этом случае можно также использовать символы форматирования текста (жирный, курсив и т.п.)
component "**Компонент 1** n Не входит ни в один пакет n //**Экспонирует**// n* //Интерфейс// 1 n* //Интерфейс 2//" as c1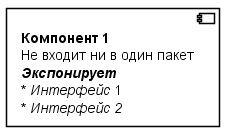
Иногда других вариантов нет. Но в большинстве случаев поддерживается синтаксис, который позволяет задавать многострочный текст. Например, в предыдущем примере, можно использовать такой синтаксис.
component c1 [
    **Компонент 1**
    ====
    Не входит ни в один пакет
    ..//**Экспонирует**//..
    * //Интерфейс// 1
    * //Интерфейс 2//
]
note left
    Тот же текст в примечании
    ....
    **Компонент 1**
    ====
    Не входит ни в один пакет
    ..//**Экспонирует**//..
    * //Интерфейс// 1
    * //Интерфейс 2//
end note
Как мы видим, при использовании такого синтаксиса появляется возможность добавлять разделительные линии. Обратите внимание, здесь добавлено примечание, отображающее тот же текст, что и компонент. При этом в примечании список отображается, как список, а в компоненте, как текст через символ «*». К сожалению, в компонентах списки и таблицы не работают. Хотя они, например, работают в элементах, отображающих деятельность (в диаграмме деятельности).
Использование иконок
PlantUML поддерживает несколько способов использования иконок. Все они обладают определенными ограничениями.
Наиболее востребованной, как мне кажется, стала технология использования так называемых спрайтов. Спрайт — это растровый рисунок, который задается при помощи текста. Самый большой плюс этой технологии заключается в том, что PlantUML позволяет создавать внешние библиотеки спрайтов. Таких библиотек несколько. Мне больше всего нравится библиотека PlantUML Icon-Font Sprites, т.к. она содержит графические изображения из Font Awesome.
Обратите внимание, что спрайты в PlantUML являются растровыми изображениями, т.е. у них есть ограничения по масштабированию. В данной конкретной библиотеке разрешение иконок составляет 48 на 48 точек. При использовании такого изображения для печати нежелательно масштабировать его до размеров более 5 миллиметров (что примерно соответствует разрешению 250 dpi). На многих интернет-ресурсах, описывающих использование спрайтов, это не учитывается и в примерах приводятся элементы диаграмм с крупными иконками. На экране такие диаграммы смотрятся отлично, но при печати выглядят растрированными.
Размер иконки в 4-5 миллиметров удобно использовать внутри подписей. Например, на следующем рисунке с помощью иконок показаны пользовательские роли, члены которых осуществляют перевод процесса из одного состояния в другое.
' Импорт иконок и создание удобных алиасов
!define ICONURL https://raw.githubusercontent.com/tupadr3/plantuml-icon-font-sprites/v2.0.0
!includeurl ICONURL/common.puml
!includeurl ICONURL/font-awesome-5/user_cog.puml
!includeurl ICONURL/font-awesome-5/user_check.puml
!define _CS scale=0.4
!define _user_cog <$user_cog{_CS}>
!define _user_check <$user_check{_CS}>

'Легенда
legend
  ..**Условные обозначения**..
  _user_cog — Сотрудник
  _user_check — Контролёр
endlegend

'Спецификация диаграммы состояний
state "Документ формируется" as prepare_doc
[*] --> prepare_doc

state "Документ на проверке" as check_doc
prepare_doc --> check_doc : _user_cog n Передать nна проверку
check_doc --> prepare_doc : _user_check n Отправить nна доработку

state "Документ проверен" as ready_doc
check_doc --> ready_doc: _user_check n Установить отметку n<U+00AB>Проверено<U+00BB>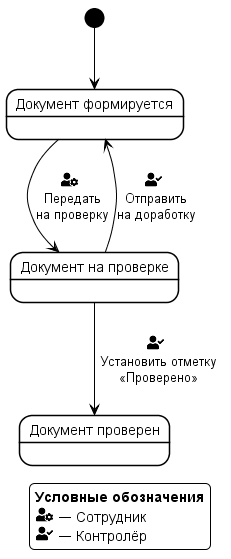
Некоторые иконки встроены непосредственно в PlantUML, однако мне больше нравится использовать внешние библиотеки. В частности, иконки из данного примера содержатся в библиотеке Awesome v5, а в PlantUML на момент написания текущей статьи (версия 1.2018.08) встроена только библиотека Awesome v4.
Использование кавычек
Этот на первый взгляд простой вопрос оказался для меня чуть ли не блокирующим в использовании PlantUML. Отсутствие кавычек выглядит непрофессионально и смешно.
PlantUML поддерживает много способов использования кавычек. Но в результате поисков я нашел только один, который работает всегда, старый добрый лом: для открывающих русских кавычек — <U+00AB>, для закрывающих — <U+00BB>, для универсальных — <U+0022>.
Как не запутаться в диаграмме
В диаграмме деятельности синтаксис настолько удобен, что запутаться в нем сложно, т.к. он больше похож на описание алгоритма, чем на описание диаграммы. Но вот в других диаграммах: состояний, компонентов, развертывания, вариантов использования, классов и других, — запутаться вполне легко.
Мне помогают не запутаться два простых правила.
-
Вводите все элементы через ключевые слова (не использовать упрощенный синтаксис). Если элемент позволяет, задавать для него алиас.
-
Указывайте связь непосредственно за элементом (разумеется, если связанный элемент уже присутствует на диаграмме). Дело в том, что элемент всегда легко найти по тексту. А связь можно найти только по алиасу. Если же пользоваться данным правилом, то связь можно также быстро найти по тексту.
Заключение
-
PlantUML — не игрушка. Это качественный, универсальный инструмент, с помощью которого можно решать практически все задачи, связанные с описанием бизнес-процессов и архитектурных особенностей проектируемых систем.
-
У PlantUML есть психологический барьер входа: мы слишком привыкли к визуальным редакторам и использование текста кажется шагом назад. Но если благодаря этому шагу назад получается повысить эффективность своей работы, почему его не сделать?
-
У PlantUML есть дыры в реализации: некоторые функции работают только для части диаграмм или графических примитивов. Однако на практике подобные ограничения всегда можно обойти. PlantUML — зрелый и стабильно работающих продукт, на который вполне можно опираться в работе, не боясь, что он испортит диаграмму или искорежит шрифт или выкинет еще какую-нибудь проблему, которая приведет к бессонной ночи перед сдачей очередного этапа проекта.
Imagine being able to
-
share a model or diagram between all members of the team that they can all understand and contribute to and edit
-
draw diagrams like below automatically from a text description.
-
describe a system before you build it, when you’re building it, and as you maintain it into the future — keeping the description and the system current, and in sync.
-
maintain that text version in a source code repository beside the code for the system it is describing
Imagine having a diagramming tool that
-
fits with a developer workflow, and developers are comfortable using
-
enables lightweight just-enough AgileModeling in a way that meets AgileModelingBP
-
fits with modern practices of Continuous Integration Continuous Delivery — and “everything as code” including diagrams.
Well that’s what PlantUML gives you, and more…
PlantUML is one of the most feature-complete tools that lets you create diagrams as code, using plain text. It supports UML diagrams and beyond, and has a large ecosystem. In this basic PlantUML tutorial I present an introduction on what PlantUML is and how to learn it. I go into detail about the very useful PlantUML standard library, approaches to work with images, and how to integrate your diagrams into your existing documentation.
- Introduction
- Diagrams beyond UML
- How PlantUML works
- Choosing your editor
- Basics
- Choosing the diagram type
- Learning the syntax
- Common diagram elements and comments
- The PlantUML standard library
- Working with images
- OpenIconic icons
- The tag
- Sprites
- Using local images as sprites
- Integrating diagrams into your documentation
- Conclusion
Introduction
In a previous article I discussed several markup languages, such as Pichr, Mermaid and PlantUML, which let you write diagrams as code, as plain text files. In this article and a follow-up post (which I will release in two weeks) I take a detailed look at PlantUML. Compared to other markup languages, PlantUML offers the most features, is still actively developed, has a very active forum community and has established a large ecosystem of tools, including real-time preview plug-ins for your favorite IDE.
I chose to write this article because the official documentation is somewhat chaotic. This article provides an understandable introduction, with basic examples. I go into further details here and here.
Diagrams beyond UML
As the name implies, PlantUML may have originally been designed to create UML diagrams. However, PlantUML can create many other kinds of diagrams, as the following gallery illustrates:

Class diagram

Use case diagram

Activity diagram

State diagram

Sequence diagram

Deployment diagram

Work breakdown structure diagram

Timing diagram
")
UI Mockup (Salt)

Mindmap

GANTT chart

Archimate diagram

C4 container diagram
You can download the snippets as text here.
How PlantUML works
PlantUML is a Java application, packaged as a jar file. It converts your diagram files (which typically have the .puml extension) to rasterized graphics like png/jpg, or vector graphics like eps/svg files. Internally, PlantUML uses Graphviz to determine the node layout, but PlantUML does not offer a Graphviz export as dot files (see here). PlantUML offers a few other export formats, such as PDF (for which you need additional jar files, see here), ASCII art text, or Tikz/LaTeX.
To render images locally on your machine, you will need Java, the PlantUML jar file, and Graphviz. I recommend that you consult the official manual for installation instructions. On Windows, recent PlantUML versions come with an embedded Graphviz binary, which facilitates the installation a bit.
Fortunately, you can get started quickly, without installing anything. Using remote rendering, others provide an API to which you send your diagram code, they render the image on the server and return it back to you. Such services are free to use, either from an IDE plug-in, or from a web-based editor.
Choosing your editor
If you are just starting out, I recommend a web-based editor. There is an official one offered by PlantUML.com, but there are better choices, such as kkeisuke, LiveUML, or PlantText. The latter ones offer a better user interface, including templates and cheat sheets.
If you are looking for a local tool and have no IDE preference, consider using VS Code with the PlantUML extension, because it runs very smoothly. Simply start by opening a new folder in VS Code, create a new file with .puml extension, and write some PlantUML markup. To get live preview, in the file’s editor window, do a right-click and choose Preview Current Diagram.
Consult the official list of tools and integration for further tools, or just search the Internet for “<your IDE name> plantuml” to find a suitable plug-in.
Basics
Choosing the diagram type
PlantUML supports all kinds of diagrams, as the links at the top of plantuml.com illustrate. The first and last line of your diagram file tells the PlantUML engine which kind of diagram you want to create. For instance, your file could start with @startmindmap and end with @endmindmap, which indicates a mind map. At the time of writing, there is @startwbs (work breakdown structure), @startmindmap, @startgantt, @startsalt (for UI mock-up diagrams), and of course @startuml. Interestingly, for @startuml, you do not explicitly specify which kind of UML diagram you want, such as activity, sequence, or class diagram. PlantUML automatically infers the diagram type, by the markup you put into your diagram. For instance, if you include class Xyz then the diagram will be a class diagram. If you mix incompatible markup (where e.g. one section indicates a sequence diagram, but the other one indicates a deployment diagram), PlantUML will either give one diagram type the preference, or may throw a syntax error.
At the beginning, I recommend learning PlantUML’s syntax by example. Choose the diagram type you want to build, then take a look at the dozens of examples of the official documentation for the specific diagram type (e.g. activity) that you are working on.
If you are not looking to create any specific kind of diagram, but just want to build a diagram with a few boxes and connecting lines, then I recommend to create a deployment diagram. It comes with several shapes for the boxes, and deployment diagrams also allow for nesting boxes within boxes.
Learning the syntax
As I just said, you should learn the syntax by example for each diagram. You will find that very often there are multiple alternatives for the markup. There is shorter, more concise code, which is less understandable for newcomers, and more verbose alternatives. This is best illustrated by an example, for a use case diagram. The following shows two snippets that produce the exact same diagram:
First, the verbose (but easily understood) snippet:
@startuml
actor "Customer" as customer
actor "Clerk" as clerk
usecase "Perform checkout" as checkout
usecase "Payment" as payment
usecase "Get help" as help

customer - checkout
checkout -[dashed]-> payment : include
checkout -[dashed]-> help : extends
checkout - clerk
@endumlCode language: plaintext (plaintext)
Next, the shorter snippet using shortcuts, less understandable:
@startuml
Customer - (Perform checkout)
(Perform checkout) ..> (Payment) : include
(Perform checkout) ..> (Get help): extends
(Perform checkout) - Clerk
@endumlCode language: plaintext (plaintext)
The rendered output is the same for both snippets:
The first snippet shows the clean way of writing a diagram. The first few lines define elements (of type actor and usecase), the last few lines define the connections between them.
In the second, shorter snippet, understanding the syntax becomes more difficult, because the snippet takes a few shortcuts:
- Use case elements are defined using the
(some text)syntax, i.e., using normal parentheses. The existence of one or more such elements turn the diagram into a use case diagram, implicitly. - Neither the
usecaseelements nor theactorelements are explicitly defined. Whenever you create a connection, and PlantUML does not know the source and target object yet, it creates elements for them automatically. - The elements
CustomerandClerkdon’t need to declare a type (actor), because PlantUML is already in “use case mode” anyway. By default, it assumes that elements without any type declaration areactorelements. - As for the connections, there is a lot of implicit meaning behind the dot and dash characters which define the line type and length. The more characters you define (e.g.
x ....> yvs.x ..> y), the longer the connection will be. As for the line type, there are solid lines (-), dashed lines (.) and dotted lines (~). This is not intuitive at all, you need to learn it by heart. - Elements are not aliased as variables (as it is done by the first example), which is bad practice because it violates the DRY (Don’t Repeat Yourself) principle. If the use case “Perform checkout” were to change to “Checkout”, you would have to update it in all three lines.
I provided this example to prepare you for the fact that these kinds of shortcut notations are very common in the official docs of PlantUML. Expect that you may have to infer the meaning from time to time.
Common diagram elements and comments
PlantUML lets you define a few common elements that are generally useful in any diagram, such as:
- A title shown at the top center of the diagram
- A caption shown at the bottom center
- A header or footer section shown above (or below) all other elements (including title)
- A legend that explains elements or colors of your diagram
Examples are documented on the commons page.
You may also want to write comments into your diagram, which are not rendered. Comments are also useful deactivate statements temporarily. Everything that starts with a simple quotation character (') is a comment. You can also put comments on multiple lines, using /' to start and '/ to end the commented section.
The PlantUML standard library
Similar to other languages, such as C++, PlantUML also comes with a standard library that offers additional functionality, which is not part of the language core. It consists mostly of icons, and corresponding markup constructs which embed these icons into a shape (such as a box). The standard library is baked into PlantUML, so you don’t need to download anything to use it. As the official documentation demonstrates, the standard library consists of several, individual third-party contributions.
Unfortunately, the official documentation page is incomplete. At the time of writing, there are several undocumented libraries, such as C4, logos, or OpenSecurityArchitecture. To find them, open the standard library’s GitHub repository where each library is represented by a sub-folder. You won’t find any documentation in this GitHub repository, though, because the documentation is only found in the original contributor’s repository. To get there, just open the INFO file found in any of the sub-folders (e.g. the one from awslib). The original contributor’s GitHub repository contains the documentation, and for those libraries that contain many icons, they will often include a page that renders a list of all these icons.
Working with images
Including images and icons in a diagram clearly improves its usefulness. PlantUML offers three approaches to do this: sprites, the <img> tag, and OpenIconic icons.
Images as shapes
Everything I describe here refers to putting images into a shape. You cannot use any pixel or vector graphics as shapes themselves (i.e. as shape outlines). See the Deployment diagram documentation for a list of available shapes.
OpenIconic icons
Let’s look at OpenIconic icons first, as they are the easiest ones to use. You simply use a notation such as <&foo> within one of your elements, where foo is one of the icon names as shown on the official docs. These icons scale up and down without loss of quality, using a surrounding <size:XX> tag, e.g. <size:50><&heart></size>.
@startuml
  rectangle "Use an icon: <size:40><&heart></size>"
@endumlCode language: HTML, XML (xml)
The <img> tag
The second approach is to use the <img> tag, which lets you reference existing image or icon files of common formats, such as png, jpg or svg. Use <img:X> where X is either a relative local path, or an absolute URL. To scale the image up or down, use something like <img:X{scale=0.5}> (which would scale the image down to 50%).
Sprites
The last option is to use sprites (documentation). Sprites are monochrome, pixel-based images/icons, i.e., they only have one color, of your choosing. Sprites are typically defined in puml files. The standard library, which I introduced above, comes with a huge list of sprites, which you can include and use in your diagram directly. Using a sprite consists of two steps:
- Locate the path to a sprite and
!includeit:- For sprites that are part of the standard library, use
!includefollowed by a path surrounded by angle brackets (<>), e.g.!include <office/Clouds/cloud_exchange_online.puml> - For all other local or remote
pumlfiles, use!includefollowed by the relative path to the local file, or the HTTP(S) URL. PlantUML also expects that this provided path or URL is not quoted (i.e., do not use surrounding""or<>characters), even if it contains spaces!
- For sprites that are part of the standard library, use
- Use an
!included sprite in one of your diagram elements: use the notation<$name>where, by convention,nameis typically the file name of the includedpumlsprite file, i.e. the last segment of its path (without.pumlextension). For the above example given for the standard library icon, this would e.g. be<$cloud_exchange_online>- You can scale icons up or down the same way you would do it for
<img>tags, e.g.<$cloud_exchange_online{scale=0.5}> - Note that
scale-values larger than1.0will look blurry, because sprites are pixel-based!
- You can scale icons up or down the same way you would do it for
To locate a suitable sprite, I recommend that you familiarize yourself with special purpose and general purpose libraries of the standard library. For instance, the office and tupadr3 (which includes material design and font awesome icons in corresponding sub-folders) are great general purpose libraries, while awslib is a great special purpose library for cloud-related icons. The logos library is also a great source for any kind of product or software library logo.
If you have a specific search term in mind, you can use GitHub’s file search in the standard library root. Open the GitHub repository, press t and enter a search term, e.g. “car” or “user”.
Using local images as sprites
There is a little trick the official documentation does not mention: you can use local image files (in formats such as png, jpg or svg) as sprites, without the need to convert them to pixel-based puml files first. Take a look at the following example:
sprite mySprite my-image.svg
rectangle "<$mysprite>"Code language: plaintext (plaintext)
This lets you use my-image.svg (or any other relative path), which is rendered in full color (not monochromatic). Vector-graphics (such as svg files) retain their quality even if you use scale values larger than 1.0. This is a nice alternative to the <img> tag, because you can define your own icon set with distinct, short names (such as mySprite), rather than using <img> tags with long URLs.
Attention: issues with svg sprites
The mechanism I just presented does not always work without flaws. For svg-based sprites, your rendered image will only look as expected, if you also choose svg as output format.
Also, older versions of PlantUML cannot process svg files that lack a declaration of the width and height attribute at the root node (remember that svg files are actually XML files). You will have to add these attributes manually to be able to use such files as sprites. This has recently been fixed.
Integrating diagrams into your documentation
If you are already using plain text documentation (as introduced in my other article), e.g. with Asciidoc, reST or Markdown, take a look at the PlantUML integration mechanism offered by your tooling. If you use the on-the-fly rendering approach, some platforms such as GitLab even offer a PlantUML integration, such that puml files are rendered to images on-the-fly, too.
If you are using other ways of creating your documentation (e.g. Word, Confluence, etc.), you can always manually save pixel or vector graphics. If you run PlantUML locally, a CLI call such as java -jar plantuml.jar -Tpng diagram.puml will render a diagram.png file for you. Also, web-based editors (such as LiveUML) also offer export buttons.
Conclusion
PlantUML makes it really easy to get started. Just look at the many examples of the official documentation. Use a web-based editor to find out if you like PlantUML’s features, before setting up plug-ins for your local IDE. PlantUML’s Standard library not only offers thousands of icons, but also additional syntax to create custom diagrams, such as C4 model diagrams (using the C4 library). PlantUML has a lot more to offer beyond the basics I presented in this article, which I’m presenting other posts, see here and here.
.NET Tools
How-To’s
Plugins
Rider
Create UML Diagrams using PlantUML
UML, or Unified Modeling Language, is, as the name implies, a modeling language that allows you to visualize systems. In this post, we’ll look at how PlantUML enables you to create various kinds of diagrams so that you can properly document your software. We’ll create two of the most popular UML diagram types: Class and Use Case diagrams, to demonstrate what you can do with the PlantUML plugin in Rider.
UML Overview
UML is a language. But it isn’t a programming language in the sense C#, Java, or Python are. UML is a visual way to convey information about software or systems, through diagrams. PlantUML is a UML-based component that enables you to draw diagrams using a concise syntax. UML diagrams come in many flavors, including the following popular types of diagrams:
- Class: Diagrams all of the classes in a program, and how they are related.
- Component: Shows the various components of a system and how they interact.
- Use case: Visually demonstrates varying scenarios in how users and other software interacts within a system boundary.
- Activity: Graphic representation of workflows of a system.
- Sequence: Outlines the steps that are necessary for a system or part of a system to function.
- State-machine: Describe the behavior of objects that act differently according to the state they are in at the moment.
In addition, PlantUML supports Object, Gantt, MindMap, Wireframe, and Work Breakdown Structure diagrams. Most teams don’t create every type of diagram for a system. Instead, they tend to choose which UML diagram types are the most meaningful that help the team and other stakeholders better understand the software. For example, a team that works on UIs might find Use Case diagrams helpful, while the back-end team might find Sequence and State-machine diagrams work better for their software.
Create UML diagrams with PlantUML
Use the PlantUML plugin in Rider to create UML diagrams that can be integrated into your codebase. Start by adding a .puml file. Each new file that PlantUML creates contains example PUML, which is PlantUML’s own syntax for creating UML diagrams. Because PUML syntax is clean, compact, and efficient, folks can use it not just for visual diagrams but also as a basis for code generation or documentation.
Notice the PUML syntax and the corresponding visualization in the PlantUML tool window to the right of the editor window. All PlantUML files begin with the @startuml marker and end with the @enduml marker. In between these markers is basic syntax that generates the diagrams, though diagrams can be as complex as is necessary
PlantUML’s terse syntax is generally formatted as a keyword identifier followed by the name of the subject. For properties, a colon goes between the property name and its type. For methods, use parentheses immediately after the method name. As you write these tokens, PlantUML automatically and immediately creates the UML diagrams, and updates the visual map that is shown in the PlantUML tool window.
A few PlantUML syntax basics:
interface interface-name
class class-name
abstract class class-name
property: data-type
method-name()
Colors and other visual indicators are customizable through PlantUML syntax.
Use the PlantUML toolwindow to manage diagrams, for example, refreshing or zooming into a diagram. You may want to save them as a separate file, perhaps to include in documentation. PlantUML supports .png, .svg, .utxt, .atxt, and .eps formats when saving.
Class diagrams
Class diagrams present the business objects from a system, along with an outline of their data and behaviors and how they relate to each other. Diagrams give developers a view as to the overall structure of a program. Class diagrams are used for many purposes, from generating data models in code to serving as documentation.
For example, if a class diagram is needed for a university, the following syntax can be used to create the following diagram. Notice the PlantUML syntax contains tokens for everything that UML requires, such as access modifiers (# for protected, + for public) and data types after a colon. To create an inherited model, use the Base <|-- Derived syntax. While this example shows only a few features of an object model, PlantUML supports other access modifiers and markers for composition and aggregation as well.
@startuml

abstract class Person {
    #Id: string
    #name: string
    #age: int
}

class Employee {
    +Department: Department
    +Salary: Decimal
}

class Professor {
    +Expertise: String
}

class Student {
    +Grade: int
    +GradeLetter: Char
    +GraduationYear: Year
    +void UpdateGrade()
}

Person <|-- Employee
Employee <|-- Professor
Person <|-- Student

@enduml
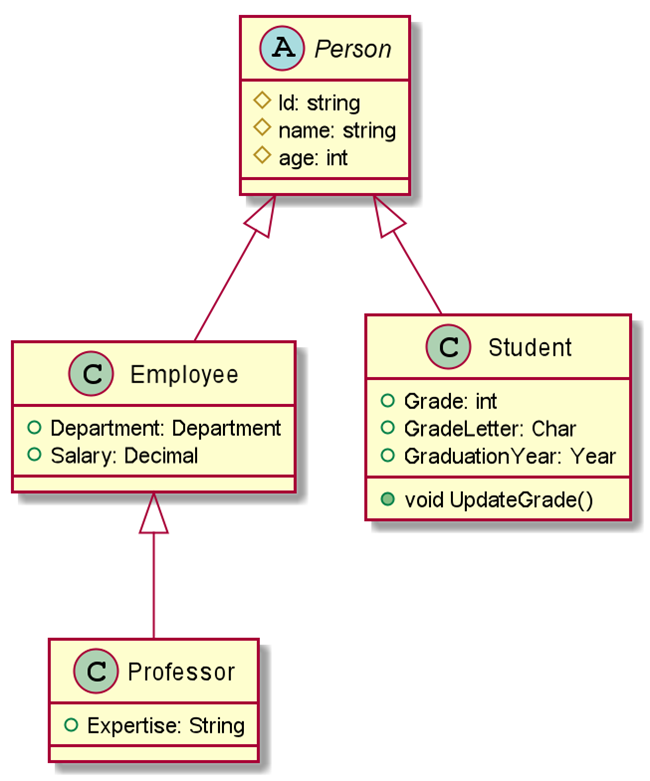
Classes in PlantUML diagrams can represent classes in C#, Java, or any OO language. In this case, PlantUML’s syntax is almost the same as C#. Use the class keyword, curly braces, then list the members and types (but no code!). This familiarity should ease the burden of creating diagrams that match objects in your model.
Use cases
Use case diagrams demonstrate the interaction between users (actors) and software, and between software components. They are an excellent way to get a snapshot of which parts of a complex system must integrate together, and how components connect to each other, as well as some system flow.
Below is a sample of PlantUML use case syntax and an accompanying visual diagram:
@startuml

left to right direction
skinparam packageStyle rectangle

actor Professor
actor Student
actor Staff

rectangle University-System {
    Professor --> (Grade Exam)
    Professor --> (Manage Course)
    Professor ---> (Access Course Information)
    Student ---> (Access Course Information)
    Student ---> (Enroll in Course)
    Staff ---> (Access Course Information)
    Staff ---> (Manage Course)
}

@enduml
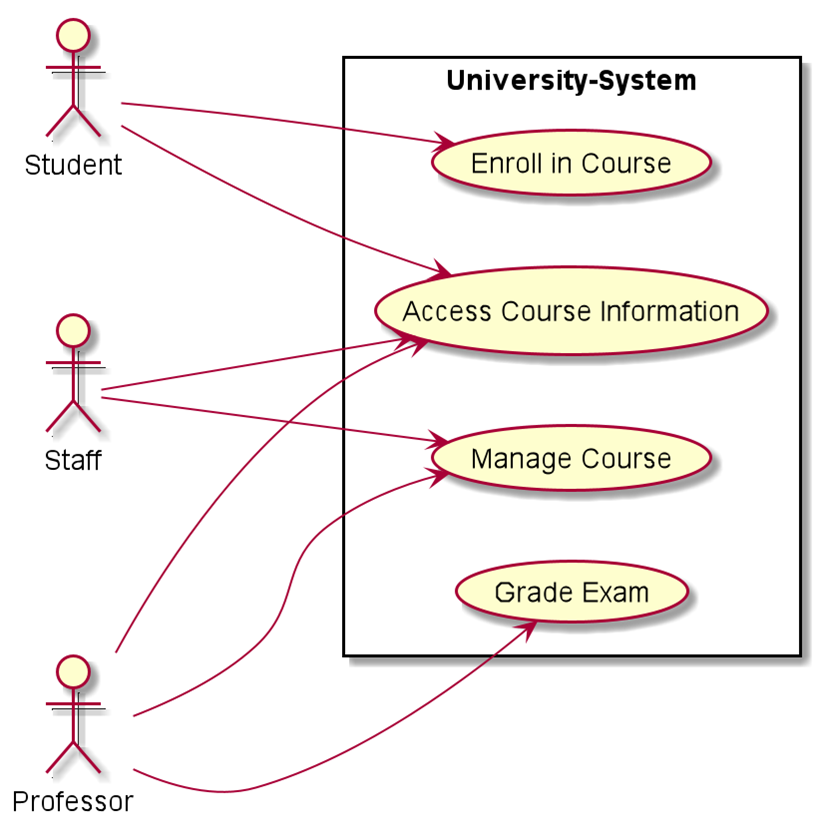
Notice some of the syntax: rectangle is used to define the system boundary. Actors are defined by the actor keyword, and the relationship between actors and objects (or objects to objects) are defined with --->. The use cases themselves are enclosed in parentheses. PlantUML really does have precise syntax, which can help you create diagrams faster with better efficiency.
Summary
Most companies, especially large organizations with complex software, need to model, map, and manage their software with industry-standard UML diagrams. PlantUML supports the most popular kinds of UML diagrams and should suit most needs.
If you’re using Rider, diagramming your systems is built into the product as a plugin, giving you an advantage to complete projects faster and more efficiently. So download Rider today, and show us your diagrams!
Subscribe to Blog updates
PlantUML
В этом репозитории собраны примеры диграмм, созданных с помощью утилиты PlantUML по модели C4.
Модель С4 была создана, чтобы помочь командам разработчиков визуализировать архитектуру ПО. Это алгоритм создания карты Вашего кода, с различными уровнями детализации, точно так же, Google Maps хранит спутниковые снимки, снятые с разной точностью.
Существует 3 основных типа диаграмм, (4-ый использовать не рекомуендуется) от общего к частному:
- Context
- Container
- Component
- Class
Чтобы отказаться от рисования схем в графических редакторах и описывать архитектуру в виде кода, можно воспользоваться утилитой PlantUML и расширением C4-PlantUML.
Начало работы
Создайте файл .puml и напишите в начале файла @startuml и @enduml в конце. Вся диаграмма будет находиться между этими двумя командами.
Добавьте импорт, например: !includeurl https://raw.githubusercontent.com/RicardoNiepel/C4-PlantUML/master/C4_Container.puml. Подробнее об импортах — далее.
Теперь создадим саму диаграмму. Вы можете использовать такие элементы, как Person, System, Container, Rel и многие другие (полный список — ниже). Приведём пример:
@startuml C4_Elements
!includeurl https://raw.githubusercontent.com/RicardoNiepel/C4-PlantUML/master/C4_Container.puml

Person(personAlias, "Label", "Optional Description")
Container(containerAlias, "Label", "Technology", "Optional Description")
System(systemAlias, "Label", "Optional Description")

Rel(personAlias, containerAlias, "Label", "Optional Technology")
@enduml
И Вы получите следующий результат:
В дополнение к этому Вы можете описать границы системы или компонента. Взгляните на следующий пример:
@startuml Basic Sample
!includeurl https://raw.githubusercontent.com/RicardoNiepel/C4-PlantUML/master/C4_Container.puml

Person(admin, "Administrator")
System_Boundary(c1, "Sample System") {
    Container(web_app, "Web Application", "C#, ASP.NET Core 2.1 MVC", "Compare Twitter timelines")
}
System(twitter, "Twitter")

Rel(admin, web_app, "Uses", "HTTPS")
Rel(web_app, twitter, "Gets tweets from", "HTTPS")
@enduml
Более сложные примеры собраны в этом репозитории в соответствующих папках.
Основные элементы и связи между ними
System Context & System Landscape diagrams
Import: !includeurl https://raw.githubusercontent.com/RicardoNiepel/C4-PlantUML/master/C4_Context.puml
Поддерживаемые элементы:
Person
Person_Ext
System
System_Ext
SystemDb
SystemDb_Ext
Boundary
System_Boundary
Enterprise_Boundary
Container diagram
Import: !includeurl https://raw.githubusercontent.com/RicardoNiepel/C4-PlantUML/master/C4_Container.puml
Данный импорт также включает в себя все элементы контекстного уровня.
Поддерживаемые элементы:
Container
ContainerDb
Container_Boundary
Component diagram
Import: !includeurl https://raw.githubusercontent.com/RicardoNiepel/C4-PlantUML/master/C4_Component.puml
Данный импорт также включает в себя все элементы контекстного и контейнерного уровня.
Поддерживаемые элементы:
Relations
Позволяют создавать связи между элементами. Все возможные элементы:
Rel - расположение будет выбрано автоматически
Rel_Back - в обратную сторону, также автоматически
Rel_Neighbor - расположить рядом
Rel_Back_Neighbor - рядом и в обратную сторону
Rel_U - Up Вверх - конечный элемент расположить выше
Rel_R - Right Вправо - конечный элемент расположить справа
Rel_D - Down Вниз - конечный элемент расположить ниже
Rel_L - Left Влево - конечный элемент расположить слева
Общий синтаксис такой:
Rel(from, to, "label", "technology")
Настройки отображения
Вы можете управлять настройками отображения, добавив данные команды в свой .puml файл после import:
LAYOUT_TOP_DOWNилиLAYOUT_LEFT_RIGHT— располагать элементы сверху вниз или справа налевоLAYOUT_WITH_LEGEND()— добавить легенду на схемуLAYOUT_AS_SKETCH()— изменить стиль на «черновик»
Данные команды можно комбинировать вместе, например отобразить легенду и поменять стиль на «черновой».
Дополнительная информация
Чтобы облегчить проектирование в IDE можно установить дополнительные плагины для проверки синтаксиса и отрисовки.
Требования для плагинов
Для их корректной работы необходимо иметь установленную Java и Graphviz.
- Java: платформа для запуска PlantUML.
- Graphviz: необходима для расчёта позиций на диаграмме.
Быстрая установка graphviz для MacOS
brew cask install java
brew install graphviz
Установка плагинов
- VSCode: https://github.com/qjebbs/vscode-plantuml
- Intellij IDEA: https://plugins.jetbrains.com/plugin/7017-plantuml-integration
Сниппеты
Для VSCode в репозитории в папке .vscode лежит сниппет C4.code-snippets для ускорения ввода. Его нужно скопировать в папку .vscode Вашего проекта.
Полезные ссылки и другие диагрммы
Сервис для онлайн генерации картинок: http://www.plantuml.com/plantuml/
В папке entity-relationship также имеются два примера ER-диаграмм (не относятся к С4).
Guides for SE student projects »
PlantUML is a tool for specifying various diagrams in a textual form. It is particularly useful in software projects where you want to update the diagrams incrementally, as the project evolves over time.
The sections below explains how to use PlantUML in a project.
Setting up PlantUML
-
Install Graphviz. Graphviz is a dependency that PlantUML requires to generate more advanced diagrams. Head over to the downloads page on the official Graphviz website and follow instructions to install Graphviz.
Windows 10 users can download the zip file in here and unzip it somewhere. The requireddot.exefile is inside that zip file. -
Install the
PlantUML integrationplugin in IntelliJ IDEA.-
Go to
Settings>Plugins>Marketplaceand install the pluginPlantUML integration. -
Then go to
Settings>Languages & Frameworks>PlantUMLor search for PlantUML. Configure the path to thedotexecutable. This executable can be found in the/bindirectory where you installed GraphViz earlier.
-

Creating/editing/exporting diagrams
After installing the PlantUML integration plugin, simply create or open any .puml file to start editing it.
Any changes you make in editor pane on the left will be reflected in the preview pane on the right. However, do take note that these changes will not be reflected in your actual documentation until you export the diagram.
The PlantUML integration plugin allows you to export individual diagrams to a location of your choosing. Click the Save Current Diagram Only button and choose the location to export the image file.
You will have to git add any new diagrams generated!
Tips and tricks
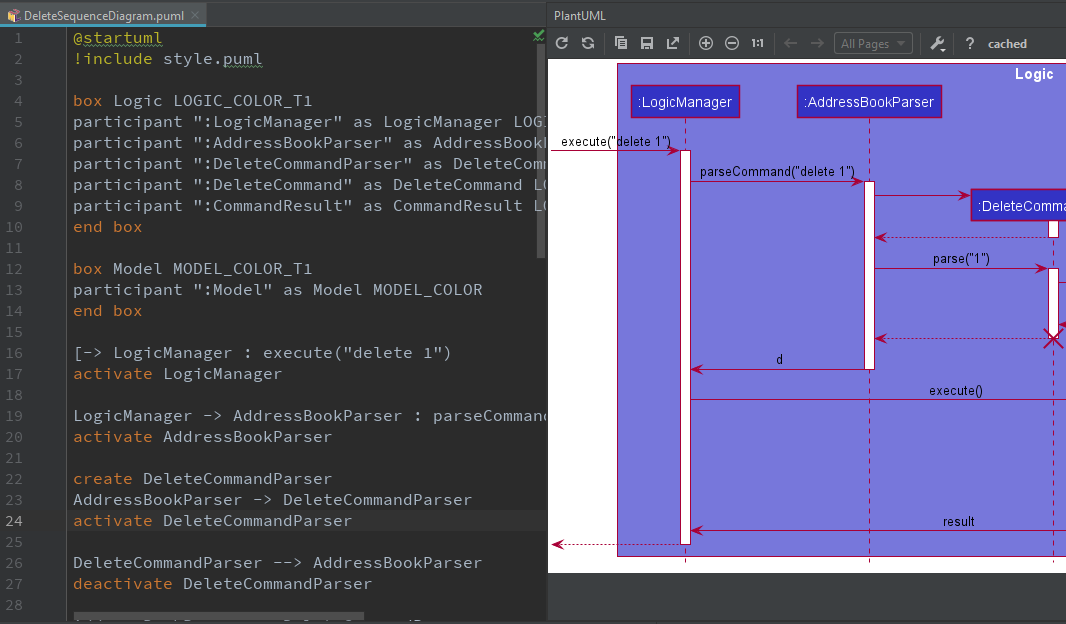
Maintaining consistency in formatting
It is highly recommended to consistently color your UML diagrams as an visual aid. You can achieve this by creating a dictionary of colors and import it like CSS.
For example, you can create a Style.puml with the contents:
Style.puml.
!define LOGIC_COLOR #3333C4
!define LOGIC_COLOR_T1 #7777DB
!define LOGIC_COLOR_T2 #5252CE
!define LOGIC_COLOR_T3 #1616B0
!define LOGIC_COLOR_T4 #101086
Then you can use it in another PlantUML file like this:
UndoSequenceDiagram.puml.
!include Style.puml

box Logic LOGIC_COLOR_T2
participant ":LogicManager" as LogicManager LOGIC_COLOR
participant ":AddressBookParser" as AddressBookParser LOGIC_COLOR
participant ":UndoCommand" as UndoCommand LOGIC_COLOR
end box
You can fine-tune the formatting of PlantUML diagrams with the skinparam command. For example, skinparam backgroundColor transparent turns the background of the diagram transparent.
Repositioning elements
While PlantUML’s automatic layout engine usually produces satisfactory results, at times the result can be less than ideal, especially on larger diagrams. Here is an example where the default layout generated by PlantUML has a lot of overlapping lines that are hard to decipher:
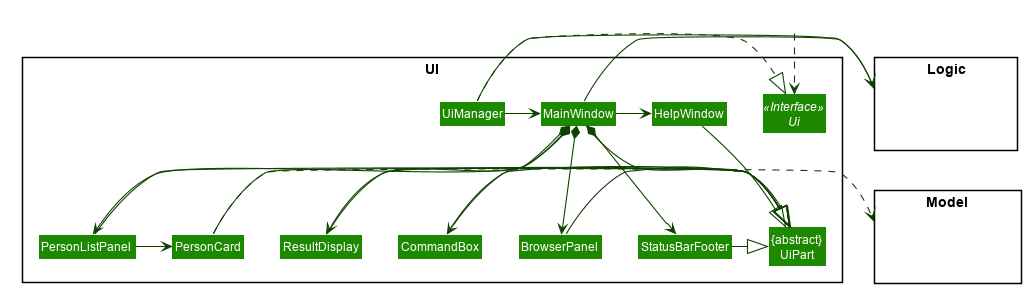
In most cases, you should consider decomposing the diagram into smaller ones or focusing on a more specific portion of the diagram.
Here are some techniques you can use to obtain a more palatable diagram.
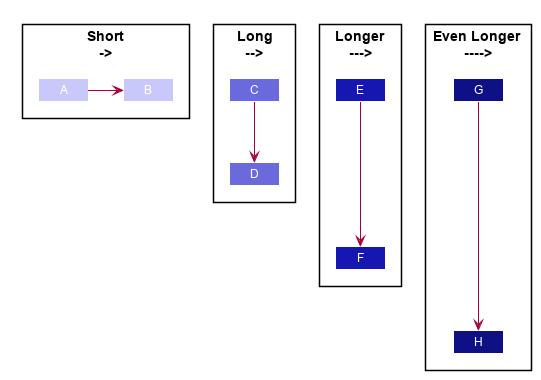
Link lengths
By default, a short link (->) points to right and a long link (-->) points downwards. you can extend any link to make it longer (--->).
Link directions
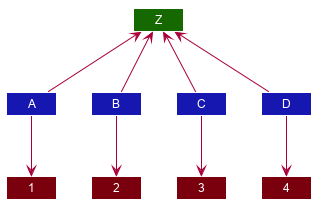
Clever usage of arrow directions will resolve most layout issues. For example, the table below shows how the way in which you specify arrows can results in drastically different layouts for the same diagram.
| Source | Result |
|---|---|
A --> Z B --> Z C --> Z D --> Z |
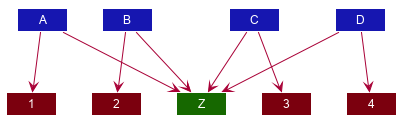 |
'default is down A --> Z 'specify down B -down-> Z 'shorthand for down C -d-> Z 'arrow lengths take priority D -down> Z A -up-> 1 B -up-> 2 C -up-> 3 D -up-> 4 |
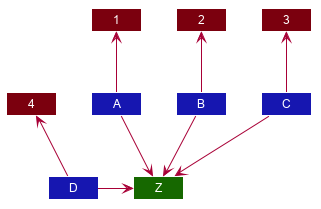 |
A -up-> Z B -up-> Z C -up-> Z D -up-> Z A --> 1 B --> 2 C --> 3 D --> 4 'Force A B C D A -right[hidden]- B B -right[hidden]- C C -right[hidden]- D |
 |
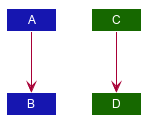
Another technique you can use to influence the layout is to reorder definitions. The layout engine will attempt to order objects in the order in which they are defined. If there is no formal definition, the objects is taken to be declared upon its first usage.
| Source | Result |
|---|---|
A --> B C --> D |
 |
'Class C is defined before A Class C A --> B C --> D |
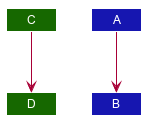 |
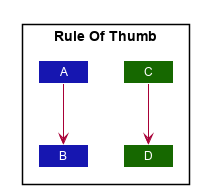
package "Rule Of Thumb";{
    Class C
    A --> B
    C --> D
}
|
 |
Explicitly define all symbols to avoid any potential layout mishaps.