This file documents the GNU debugger GDB.
This is the Tenth Edition, of Debugging with
GDB: the GNU Source-Level Debugger for GDB
(GDB)
Version 13.1.90.20230516-git.
Copyright © 1988-2023 Free Software Foundation, Inc.
Permission is granted to copy, distribute and/or modify this document
under the terms of the GNU Free Documentation License, Version 1.3 or
any later version published by the Free Software Foundation; with the
Invariant Sections being “Free Software” and “Free Software Needs
Free Documentation”, with the Front-Cover Texts being “A GNU Manual,”
and with the Back-Cover Texts as in (a) below.
(a) The FSF’s Back-Cover Text is: “You are free to copy and modify
this GNU Manual. Buying copies from GNU Press supports the FSF in
developing GNU and promoting software freedom.”
Debugging with GDB
This file describes GDB, the GNU symbolic debugger.
This is the Tenth Edition, for GDB
(GDB)
Version 13.1.90.20230516-git.
Copyright (C) 1988-2023 Free Software Foundation, Inc.
This edition of the GDB manual is dedicated to the memory of Fred
Fish. Fred was a long-standing contributor to GDB and to Free
software in general. We will miss him.
Table of Contents
- Summary of GDB
- Free Software
- Free Software Needs Free Documentation
- Contributors to GDB
- 1 A Sample GDB Session
- 2 Getting In and Out of GDB
- 2.1 Invoking GDB
- 2.1.1 Choosing Files
- 2.1.2 Choosing Modes
- 2.1.3 What GDB Does During Startup
- 2.1.4 Initialization Files
- 2.1.4.1 Home directory early initialization files
- 2.1.4.2 System wide initialization files
- 2.1.4.3 Home directory initialization file
- 2.1.4.4 Local directory initialization file
- 2.2 Quitting GDB
- 2.3 Shell Commands
- 2.4 Logging Output
- 2.1 Invoking GDB
- 3 GDB Commands
- 3.1 Command Syntax
- 3.2 Command Settings
- 3.3 Command Completion
- 3.4 Command options
- 3.5 Getting Help
- 4 Running Programs Under GDB
- 4.1 Compiling for Debugging
- 4.2 Starting your Program
- 4.3 Your Program’s Arguments
- 4.4 Your Program’s Environment
- 4.5 Your Program’s Working Directory
- 4.6 Your Program’s Input and Output
- 4.7 Debugging an Already-running Process
- 4.8 Killing the Child Process
- 4.9 Debugging Multiple Inferiors Connections and Programs
- 4.10 Debugging Programs with Multiple Threads
- 4.11 Debugging Forks
- 4.12 Setting a Bookmark to Return to Later
- 4.12.1 A Non-obvious Benefit of Using Checkpoints
- 5 Stopping and Continuing
- 5.1 Breakpoints, Watchpoints, and Catchpoints
- 5.1.1 Setting Breakpoints
- 5.1.2 Setting Watchpoints
- 5.1.3 Setting Catchpoints
- 5.1.4 Deleting Breakpoints
- 5.1.5 Disabling Breakpoints
- 5.1.6 Break Conditions
- 5.1.7 Breakpoint Command Lists
- 5.1.8 Dynamic Printf
- 5.1.9 How to save breakpoints to a file
- 5.1.10 Static Probe Points
- 5.1.11 “Cannot insert breakpoints”
- 5.1.12 “Breakpoint address adjusted…”
- 5.2 Continuing and Stepping
- 5.3 Skipping Over Functions and Files
- 5.4 Signals
- 5.5 Stopping and Starting Multi-thread Programs
- 5.5.1 All-Stop Mode
- 5.5.2 Non-Stop Mode
- 5.5.3 Background Execution
- 5.5.4 Thread-Specific Breakpoints
- 5.5.5 Interrupted System Calls
- 5.5.6 Observer Mode
- 5.1 Breakpoints, Watchpoints, and Catchpoints
- 6 Running programs backward
- 7 Recording Inferior’s Execution and Replaying It
- 8 Examining the Stack
- 8.1 Stack Frames
- 8.2 Backtraces
- 8.3 Selecting a Frame
- 8.4 Information About a Frame
- 8.5 Applying a Command to Several Frames.
- 8.6 Management of Frame Filters.
- 9 Examining Source Files
- 9.1 Printing Source Lines
- 9.2 Location Specifications
- 9.2.1 Linespec Locations
- 9.2.2 Explicit Locations
- 9.2.3 Address Locations
- 9.3 Editing Source Files
- 9.3.1 Choosing your Editor
- 9.4 Searching Source Files
- 9.5 Specifying Source Directories
- 9.6 Source and Machine Code
- 9.7 Disable Reading Source Code
- 10 Examining Data
- 10.1 Expressions
- 10.2 Ambiguous Expressions
- 10.3 Program Variables
- 10.4 Artificial Arrays
- 10.5 Output Formats
- 10.6 Examining Memory
- 10.7 Memory Tagging
- 10.8 Automatic Display
- 10.9 Print Settings
- 10.10 Pretty Printing
- 10.10.1 Pretty-Printer Introduction
- 10.10.2 Pretty-Printer Example
- 10.10.3 Pretty-Printer Commands
- 10.11 Value History
- 10.12 Convenience Variables
- 10.13 Convenience Functions
- 10.14 Registers
- 10.15 Floating Point Hardware
- 10.16 Vector Unit
- 10.17 Operating System Auxiliary Information
- 10.18 Memory Region Attributes
- 10.18.1 Attributes
- 10.18.1.1 Memory Access Mode
- 10.18.1.2 Memory Access Size
- 10.18.1.3 Data Cache
- 10.18.2 Memory Access Checking
- 10.18.1 Attributes
- 10.19 Copy Between Memory and a File
- 10.20 How to Produce a Core File from Your Program
- 10.21 Character Sets
- 10.22 Caching Data of Targets
- 10.23 Search Memory
- 10.24 Value Sizes
- 11 Debugging Optimized Code
- 11.1 Inline Functions
- 11.2 Tail Call Frames
- 12 C Preprocessor Macros
- 13 Tracepoints
- 13.1 Commands to Set Tracepoints
- 13.1.1 Create and Delete Tracepoints
- 13.1.2 Enable and Disable Tracepoints
- 13.1.3 Tracepoint Passcounts
- 13.1.4 Tracepoint Conditions
- 13.1.5 Trace State Variables
- 13.1.6 Tracepoint Action Lists
- 13.1.7 Listing Tracepoints
- 13.1.8 Listing Static Tracepoint Markers
- 13.1.9 Starting and Stopping Trace Experiments
- 13.1.10 Tracepoint Restrictions
- 13.2 Using the Collected Data
- 13.2.1
tfind n - 13.2.2
tdump - 13.2.3
save tracepoints filename
- 13.2.1
- 13.3 Convenience Variables for Tracepoints
- 13.4 Using Trace Files
- 13.1 Commands to Set Tracepoints
- 14 Debugging Programs That Use Overlays
- 14.1 How Overlays Work
- 14.2 Overlay Commands
- 14.3 Automatic Overlay Debugging
- 14.4 Overlay Sample Program
- 15 Using GDB with Different Languages
- 15.1 Switching Between Source Languages
- 15.1.1 List of Filename Extensions and Languages
- 15.1.2 Setting the Working Language
- 15.1.3 Having GDB Infer the Source Language
- 15.2 Displaying the Language
- 15.3 Type and Range Checking
- 15.3.1 An Overview of Type Checking
- 15.3.2 An Overview of Range Checking
- 15.4 Supported Languages
- 15.4.1 C and C++
- 15.4.1.1 C and C++ Operators
- 15.4.1.2 C and C++ Constants
- 15.4.1.3 C++ Expressions
- 15.4.1.4 C and C++ Defaults
- 15.4.1.5 C and C++ Type and Range Checks
- 15.4.1.6 GDB and C
- 15.4.1.7 GDB Features for C++
- 15.4.1.8 Decimal Floating Point format
- 15.4.2 D
- 15.4.3 Go
- 15.4.4 Objective-C
- 15.4.4.1 Method Names in Commands
- 15.4.4.2 The Print Command With Objective-C
- 15.4.5 OpenCL C
- 15.4.5.1 OpenCL C Datatypes
- 15.4.5.2 OpenCL C Expressions
- 15.4.5.3 OpenCL C Operators
- 15.4.6 Fortran
- 15.4.6.1 Fortran Types
- 15.4.6.2 Fortran Operators and Expressions
- 15.4.6.3 Fortran Intrinsics
- 15.4.6.4 Special Fortran Commands
- 15.4.7 Pascal
- 15.4.8 Rust
- 15.4.9 Modula-2
- 15.4.9.1 Operators
- 15.4.9.2 Built-in Functions and Procedures
- 15.4.9.3 Constants
- 15.4.9.4 Modula-2 Types
- 15.4.9.5 Modula-2 Defaults
- 15.4.9.6 Deviations from Standard Modula-2
- 15.4.9.7 Modula-2 Type and Range Checks
- 15.4.9.8 The Scope Operators
::and. - 15.4.9.9 GDB and Modula-2
- 15.4.10 Ada
- 15.4.10.1 Introduction
- 15.4.10.2 Omissions from Ada
- 15.4.10.3 Additions to Ada
- 15.4.10.4 Overloading support for Ada
- 15.4.10.5 Stopping at the Very Beginning
- 15.4.10.6 Ada Exceptions
- 15.4.10.7 Extensions for Ada Tasks
- 15.4.10.8 Tasking Support when Debugging Core Files
- 15.4.10.9 Tasking Support when using the Ravenscar Profile
- 15.4.10.10 Ada Source Character Set
- 15.4.10.11 Known Peculiarities of Ada Mode
- 15.4.1 C and C++
- 15.5 Unsupported Languages
- 15.1 Switching Between Source Languages
- 16 Examining the Symbol Table
- 17 Altering Execution
- 17.1 Assignment to Variables
- 17.2 Continuing at a Different Address
- 17.3 Giving your Program a Signal
- 17.4 Returning from a Function
- 17.5 Calling Program Functions
- 17.5.1 Calling functions with no debug info
- 17.6 Patching Programs
- 17.7 Compiling and injecting code in GDB
- 17.7.1 Compilation options for the
compilecommand - 17.7.2 Caveats when using the
compilecommand - 17.7.3 Compiler search for the
compilecommand
- 17.7.1 Compilation options for the
- 18 GDB Files
- 18.1 Commands to Specify Files
- 18.2 File Caching
- 18.3 Debugging Information in Separate Files
- 18.4 Debugging information in a special section
- 18.5 Index Files Speed Up GDB
- 18.5.1 Automatic symbol index cache
- 18.6 Errors Reading Symbol Files
- 18.7 GDB Data Files
- 19 Specifying a Debugging Target
- 19.1 Active Targets
- 19.2 Commands for Managing Targets
- 19.3 Choosing Target Byte Order
- 20 Debugging Remote Programs
- 20.1 Connecting to a Remote Target
- 20.1.1 Types of Remote Connections
- 20.1.2 Host and Target Files
- 20.1.3 Remote Connection Commands
- 20.2 Sending files to a remote system
- 20.3 Using the
gdbserverProgram- 20.3.1 Running
gdbserver- 20.3.1.1 Attaching to a Running Program
- 20.3.1.2 TCP port allocation lifecycle of
gdbserver - 20.3.1.3 Other Command-Line Arguments for
gdbserver
- 20.3.2 Connecting to
gdbserver - 20.3.3 Monitor Commands for
gdbserver - 20.3.4 Tracepoints support in
gdbserver
- 20.3.1 Running
- 20.4 Remote Configuration
- 20.5 Implementing a Remote Stub
- 20.5.1 What the Stub Can Do for You
- 20.5.2 What You Must Do for the Stub
- 20.5.3 Putting it All Together
- 20.1 Connecting to a Remote Target
- 21 Configuration-Specific Information
- 21.1 Native
- 21.1.1 BSD libkvm Interface
- 21.1.2 Process Information
- 21.1.3 Features for Debugging DJGPP Programs
- 21.1.4 Features for Debugging MS Windows PE Executables
- 21.1.4.1 Support for DLLs without Debugging Symbols
- 21.1.4.2 DLL Name Prefixes
- 21.1.4.3 Working with Minimal Symbols
- 21.1.5 Commands Specific to GNU Hurd Systems
- 21.1.6 Darwin
- 21.1.7 FreeBSD
- 21.2 Embedded Operating Systems
- 21.3 Embedded Processors
- 21.3.1 Synopsys ARC
- 21.3.2 ARM
- 21.3.3 BPF
- 21.3.4 M68k
- 21.3.5 MicroBlaze
- 21.3.6 MIPS Embedded
- 21.3.7 OpenRISC 1000
- 21.3.8 PowerPC Embedded
- 21.3.9 Atmel AVR
- 21.3.10 CRIS
- 21.3.11 Renesas Super-H
- 21.4 Architectures
- 21.4.1 AArch64
- 21.4.1.1 AArch64 SVE.
- 21.4.1.2 AArch64 Pointer Authentication.
- 21.4.1.3 AArch64 Memory Tagging Extension.
- 21.4.2 x86 Architecture-specific Issues
- 21.4.2.1 Intel Memory Protection Extensions (MPX).
- 21.4.3 Alpha
- 21.4.4 MIPS
- 21.4.5 HPPA
- 21.4.6 PowerPC
- 21.4.7 Nios II
- 21.4.8 Sparc64
- 21.4.8.1 ADI Support
- 21.4.9 S12Z
- 21.4.1 AArch64
- 21.1 Native
- 22 Controlling GDB
- 22.1 Prompt
- 22.2 Command Editing
- 22.3 Command History
- 22.4 Screen Size
- 22.5 Output Styling
- 22.6 Numbers
- 22.7 Configuring the Current ABI
- 22.8 Automatically loading associated files
- 22.8.1 Automatically loading init file in the current directory
- 22.8.2 Automatically loading thread debugging library
- 22.8.3 Security restriction for auto-loading
- 22.8.4 Displaying files tried for auto-load
- 22.9 Optional Warnings and Messages
- 22.10 Optional Messages about Internal Happenings
- 22.11 Other Miscellaneous Settings
- 23 Extending GDB
- 23.1 Canned Sequences of Commands
- 23.1.1 User-defined Commands
- 23.1.2 User-defined Command Hooks
- 23.1.3 Command Files
- 23.1.4 Commands for Controlled Output
- 23.1.5 Controlling auto-loading native GDB scripts
- 23.2 Command Aliases
- 23.2.1 Default Arguments
- 23.3 Extending GDB using Python
- 23.3.1 Python Commands
- 23.3.2 Python API
- 23.3.2.1 Basic Python
- 23.3.2.2 Exception Handling
- 23.3.2.3 Values From Inferior
- 23.3.2.4 Types In Python
- 23.3.2.5 Pretty Printing API
- 23.3.2.6 Selecting Pretty-Printers
- 23.3.2.7 Writing a Pretty-Printer
- 23.3.2.8 Type Printing API
- 23.3.2.9 Filtering Frames
- 23.3.2.10 Decorating Frames
- 23.3.2.11 Writing a Frame Filter
- 23.3.2.12 Unwinding Frames in Python
- 23.3.2.13 Xmethods In Python
- 23.3.2.14 Xmethod API
- 23.3.2.15 Writing an Xmethod
- 23.3.2.16 Inferiors In Python
- 23.3.2.17 Events In Python
- 23.3.2.18 Threads In Python
- 23.3.2.19 Recordings In Python
- 23.3.2.20 CLI Commands In Python
- 23.3.2.21 GDB/MI Commands In Python
- 23.3.2.22 Parameters In Python
- 23.3.2.23 Writing new convenience functions
- 23.3.2.24 Program Spaces In Python
- 23.3.2.25 Objfiles In Python
- 23.3.2.26 Accessing inferior stack frames from Python
- 23.3.2.27 Accessing blocks from Python
- 23.3.2.28 Python representation of Symbols
- 23.3.2.29 Symbol table representation in Python
- 23.3.2.30 Manipulating line tables using Python
- 23.3.2.31 Manipulating breakpoints using Python
- 23.3.2.32 Finish Breakpoints
- 23.3.2.33 Python representation of lazy strings
- 23.3.2.34 Python representation of architectures
- 23.3.2.35 Registers In Python
- 23.3.2.36 Connections In Python
- 23.3.2.37 Implementing new TUI windows
- 23.3.2.38 Instruction Disassembly In Python
- 23.3.3 Python Auto-loading
- 23.3.4 Python modules
- 23.3.4.1 gdb.printing
- 23.3.4.2 gdb.types
- 23.3.4.3 gdb.prompt
- 23.4 Extending GDB using Guile
- 23.4.1 Guile Introduction
- 23.4.2 Guile Commands
- 23.4.3 Guile API
- 23.4.3.1 Basic Guile
- 23.4.3.2 Guile Configuration
- 23.4.3.3 GDB Scheme Data Types
- 23.4.3.4 Guile Exception Handling
- 23.4.3.5 Values From Inferior In Guile
- 23.4.3.6 Arithmetic In Guile
- 23.4.3.7 Types In Guile
- 23.4.3.8 Guile Pretty Printing API
- 23.4.3.9 Selecting Guile Pretty-Printers
- 23.4.3.10 Writing a Guile Pretty-Printer
- 23.4.3.11 Commands In Guile
- 23.4.3.12 Parameters In Guile
- 23.4.3.13 Program Spaces In Guile
- 23.4.3.14 Objfiles In Guile
- 23.4.3.15 Accessing inferior stack frames from Guile.
- 23.4.3.16 Accessing blocks from Guile.
- 23.4.3.17 Guile representation of Symbols.
- 23.4.3.18 Symbol table representation in Guile.
- 23.4.3.19 Manipulating breakpoints using Guile
- 23.4.3.20 Guile representation of lazy strings.
- 23.4.3.21 Guile representation of architectures
- 23.4.3.22 Disassembly In Guile
- 23.4.3.23 I/O Ports in Guile
- 23.4.3.24 Memory Ports in Guile
- 23.4.3.25 Iterators In Guile
- 23.4.4 Guile Auto-loading
- 23.4.5 Guile Modules
- 23.4.5.1 Guile Printing Module
- 23.4.5.2 Guile Types Module
- 23.5 Auto-loading extensions
- 23.5.1 The objfile-gdb.ext file
- 23.5.2 The
.debug_gdb_scriptssection- 23.5.2.1 Script File Entries
- 23.5.2.2 Script Text Entries
- 23.5.3 Which flavor to choose?
- 23.6 Multiple Extension Languages
- 23.6.1 Python comes first
- 23.1 Canned Sequences of Commands
- 24 Command Interpreters
- 25 GDB Text User Interface
- 25.1 TUI Overview
- 25.2 TUI Key Bindings
- 25.3 TUI Single Key Mode
- 25.4 TUI Mouse Support
- 25.5 TUI-specific Commands
- 25.6 TUI Configuration Variables
- 26 Using GDB under GNU Emacs
- 27 The GDB/MI Interface
- Function and Purpose
- Notation and Terminology
- 27.1 GDB/MI General Design
- 27.1.1 Context management
- 27.1.1.1 Threads and Frames
- 27.1.1.2 Language
- 27.1.2 Asynchronous command execution and non-stop mode
- 27.1.3 Thread groups
- 27.1.1 Context management
- 27.2 GDB/MI Command Syntax
- 27.2.1 GDB/MI Input Syntax
- 27.2.2 GDB/MI Output Syntax
- 27.3 GDB/MI Compatibility with CLI
- 27.4 GDB/MI Development and Front Ends
- 27.5 GDB/MI Output Records
- 27.5.1 GDB/MI Result Records
- 27.5.2 GDB/MI Stream Records
- 27.5.3 GDB/MI Async Records
- 27.5.4 GDB/MI Breakpoint Information
- 27.5.5 GDB/MI Frame Information
- 27.5.6 GDB/MI Thread Information
- 27.5.7 GDB/MI Ada Exception Information
- 27.6 Simple Examples of GDB/MI Interaction
- 27.7 GDB/MI Command Description Format
- 27.8 GDB/MI Breakpoint Commands
- 27.9 GDB/MI Catchpoint Commands
- 27.9.1 Shared Library GDB/MI Catchpoints
- 27.9.2 Ada Exception GDB/MI Catchpoints
- 27.9.3 C++ Exception GDB/MI Catchpoints
- 27.10 GDB/MI Program Context
- 27.11 GDB/MI Thread Commands
- 27.12 GDB/MI Ada Tasking Commands
- 27.13 GDB/MI Program Execution
- 27.14 GDB/MI Stack Manipulation Commands
- 27.15 GDB/MI Variable Objects
- 27.16 GDB/MI Data Manipulation
- 27.17 GDB/MI Tracepoint Commands
- 27.18 GDB/MI Symbol Query Commands
- 27.19 GDB/MI File Commands
- 27.20 GDB/MI Target Manipulation Commands
- 27.21 GDB/MI File Transfer Commands
- 27.22 Ada Exceptions GDB/MI Commands
- 27.23 GDB/MI Support Commands
- 27.24 Miscellaneous GDB/MI Commands
- 28 GDB Annotations
- 28.1 What is an Annotation?
- 28.2 The Server Prefix
- 28.3 Annotation for GDB Input
- 28.4 Errors
- 28.5 Invalidation Notices
- 28.6 Running the Program
- 28.7 Displaying Source
- 29 JIT Compilation Interface
- 29.1 JIT Declarations
- 29.2 Registering Code
- 29.3 Unregistering Code
- 29.4 Custom Debug Info
- 29.4.1 Using JIT Debug Info Readers
- 29.4.2 Writing JIT Debug Info Readers
- 30 In-Process Agent
- 30.1 In-Process Agent Protocol
- 30.1.1 IPA Protocol Objects
- 30.1.2 IPA Protocol Commands
- 30.1 In-Process Agent Protocol
- 31 Reporting Bugs in GDB
- 31.1 Have You Found a Bug?
- 31.2 How to Report Bugs
- 32 Command Line Editing
- 32.1 Introduction to Line Editing
- 32.2 Readline Interaction
- 32.2.1 Readline Bare Essentials
- 32.2.2 Readline Movement Commands
- 32.2.3 Readline Killing Commands
- 32.2.4 Readline Arguments
- 32.2.5 Searching for Commands in the History
- 32.3 Readline Init File
- 32.3.1 Readline Init File Syntax
- 32.3.2 Conditional Init Constructs
- 32.3.3 Sample Init File
- 32.4 Bindable Readline Commands
- 32.4.1 Commands For Moving
- 32.4.2 Commands For Manipulating The History
- 32.4.3 Commands For Changing Text
- 32.4.4 Killing And Yanking
- 32.4.5 Specifying Numeric Arguments
- 32.4.6 Letting Readline Type For You
- 32.4.7 Keyboard Macros
- 32.4.8 Some Miscellaneous Commands
- 32.5 Readline vi Mode
- 33 Using History Interactively
- 33.1 History Expansion
- 33.1.1 Event Designators
- 33.1.2 Word Designators
- 33.1.3 Modifiers
- 33.1 History Expansion
- Appendix A In Memoriam
- Appendix B Formatting Documentation
- Appendix C Installing GDB
- C.1 Requirements for Building GDB
- C.2 Invoking the GDB configure Script
- C.3 Compiling GDB in Another Directory
- C.4 Specifying Names for Hosts and Targets
- C.5 configure Options
- C.6 System-wide configuration and settings
- C.6.1 Installed System-wide Configuration Scripts
- Appendix D Maintenance Commands
- Appendix E GDB Remote Serial Protocol
- E.1 Overview
- E.2 Packets
- E.3 Stop Reply Packets
- E.4 General Query Packets
- E.5 Architecture-Specific Protocol Details
- E.5.1 ARM-specific Protocol Details
- E.5.1.1 ARM Breakpoint Kinds
- E.5.1.2 ARM Memory Tag Types
- E.5.2 MIPS-specific Protocol Details
- E.5.2.1 MIPS Register Packet Format
- E.5.2.2 MIPS Breakpoint Kinds
- E.5.1 ARM-specific Protocol Details
- E.6 Tracepoint Packets
- E.6.1 Relocate instruction reply packet
- E.7 Host I/O Packets
- E.8 Interrupts
- E.9 Notification Packets
- E.10 Remote Protocol Support for Non-Stop Mode
- E.11 Packet Acknowledgment
- E.12 Examples
- E.13 File-I/O Remote Protocol Extension
- E.13.1 File-I/O Overview
- E.13.2 Protocol Basics
- E.13.3 The
FRequest Packet - E.13.4 The
FReply Packet - E.13.5 The ‘Ctrl-C’ Message
- E.13.6 Console I/O
- E.13.7 List of Supported Calls
- open
- close
- read
- write
- lseek
- rename
- unlink
- stat/fstat
- gettimeofday
- isatty
- system
- E.13.8 Protocol-specific Representation of Datatypes
- Integral Datatypes
- Pointer Values
- Memory Transfer
- struct stat
- struct timeval
- E.13.9 Constants
- Open Flags
- mode_t Values
- Errno Values
- Lseek Flags
- Limits
- E.13.10 File-I/O Examples
- E.14 Library List Format
- E.15 Library List Format for SVR4 Targets
- E.16 Memory Map Format
- E.17 Thread List Format
- E.18 Traceframe Info Format
- E.19 Branch Trace Format
- E.20 Branch Trace Configuration Format
- Appendix F The GDB Agent Expression Mechanism
- F.1 General Bytecode Design
- F.2 Bytecode Descriptions
- F.3 Using Agent Expressions
- F.4 Varying Target Capabilities
- F.5 Rationale
- Appendix G Target Descriptions
- G.1 Retrieving Descriptions
- G.2 Target Description Format
- G.2.1 Inclusion
- G.2.2 Architecture
- G.2.3 OS ABI
- G.2.4 Compatible Architecture
- G.2.5 Features
- G.2.6 Types
- G.2.7 Registers
- G.3 Predefined Target Types
- G.4 Enum Target Types
- G.5 Standard Target Features
- G.5.1 AArch64 Features
- G.5.2 ARC Features
- G.5.3 ARM Features
- G.5.4 i386 Features
- G.5.5 LoongArch Features
- G.5.6 MicroBlaze Features
- G.5.7 MIPS Features
- G.5.8 M68K Features
- G.5.9 NDS32 Features
- G.5.10 Nios II Features
- G.5.11 Openrisc 1000 Features
- G.5.12 PowerPC Features
- G.5.13 RISC-V Features
- G.5.14 RX Features
- G.5.15 S/390 and System z Features
- G.5.16 Sparc Features
- G.5.17 TMS320C6x Features
- Appendix H Operating System Information
- H.1 Process list
- Appendix I Trace File Format
- Appendix J
.gdb_indexsection format - Appendix K Download debugging resources with Debuginfod
- K.1 Debuginfod Settings
- Appendix L Manual pages
- Appendix M GNU GENERAL PUBLIC LICENSE
- Appendix N GNU Free Documentation License
- Concept Index
- Command, Variable, and Function Index
Summary of GDB
The purpose of a debugger such as GDB is to allow you to see what is
going on “inside” another program while it executes—or what another
program was doing at the moment it crashed.
GDB can do four main kinds of things (plus other things in support of
these) to help you catch bugs in the act:
- Start your program, specifying anything that might affect its behavior.
- Make your program stop on specified conditions.
- Examine what has happened, when your program has stopped.
- Change things in your program, so you can experiment with correcting the
effects of one bug and go on to learn about another.
You can use GDB to debug programs written in C and C++.
For more information, see Supported Languages.
For more information, see C and C++.
Support for D is partial. For information on D, see
D.
Support for Modula-2 is partial. For information on Modula-2, see
Modula-2.
Support for OpenCL C is partial. For information on OpenCL C, see
OpenCL C.
Debugging Pascal programs which use sets, subranges, file variables, or
nested functions does not currently work. GDB does not support
entering expressions, printing values, or similar features using Pascal
syntax.
GDB can be used to debug programs written in Fortran, although
it may be necessary to refer to some variables with a trailing
underscore.
GDB can be used to debug programs written in Objective-C,
using either the Apple/NeXT or the GNU Objective-C runtime.
Free Software
GDB is free software, protected by the GNU
General Public License
(GPL). The GPL gives you the freedom to copy or adapt a licensed
program—but every person getting a copy also gets with it the
freedom to modify that copy (which means that they must get access to
the source code), and the freedom to distribute further copies.
Typical software companies use copyrights to limit your freedoms; the
Free Software Foundation uses the GPL to preserve these freedoms.
Fundamentally, the General Public License is a license which says that
you have these freedoms and that you cannot take these freedoms away
from anyone else.
Free Software Needs Free Documentation
The biggest deficiency in the free software community today is not in
the software—it is the lack of good free documentation that we can
include with the free software. Many of our most important
programs do not come with free reference manuals and free introductory
texts. Documentation is an essential part of any software package;
when an important free software package does not come with a free
manual and a free tutorial, that is a major gap. We have many such
gaps today.
Consider Perl, for instance. The tutorial manuals that people
normally use are non-free. How did this come about? Because the
authors of those manuals published them with restrictive terms—no
copying, no modification, source files not available—which exclude
them from the free software world.
That wasn’t the first time this sort of thing happened, and it was far
from the last. Many times we have heard a GNU user eagerly describe a
manual that he is writing, his intended contribution to the community,
only to learn that he had ruined everything by signing a publication
contract to make it non-free.
Free documentation, like free software, is a matter of freedom, not
price. The problem with the non-free manual is not that publishers
charge a price for printed copies—that in itself is fine. (The Free
Software Foundation sells printed copies of manuals, too.) The
problem is the restrictions on the use of the manual. Free manuals
are available in source code form, and give you permission to copy and
modify. Non-free manuals do not allow this.
The criteria of freedom for a free manual are roughly the same as for
free software. Redistribution (including the normal kinds of
commercial redistribution) must be permitted, so that the manual can
accompany every copy of the program, both on-line and on paper.
Permission for modification of the technical content is crucial too.
When people modify the software, adding or changing features, if they
are conscientious they will change the manual too—so they can
provide accurate and clear documentation for the modified program. A
manual that leaves you no choice but to write a new manual to document
a changed version of the program is not really available to our
community.
Some kinds of limits on the way modification is handled are
acceptable. For example, requirements to preserve the original
author’s copyright notice, the distribution terms, or the list of
authors, are ok. It is also no problem to require modified versions
to include notice that they were modified. Even entire sections that
may not be deleted or changed are acceptable, as long as they deal
with nontechnical topics (like this one). These kinds of restrictions
are acceptable because they don’t obstruct the community’s normal use
of the manual.
However, it must be possible to modify all the technical
content of the manual, and then distribute the result in all the usual
media, through all the usual channels. Otherwise, the restrictions
obstruct the use of the manual, it is not free, and we need another
manual to replace it.
Please spread the word about this issue. Our community continues to
lose manuals to proprietary publishing. If we spread the word that
free software needs free reference manuals and free tutorials, perhaps
the next person who wants to contribute by writing documentation will
realize, before it is too late, that only free manuals contribute to
the free software community.
If you are writing documentation, please insist on publishing it under
the GNU Free Documentation License or another free documentation
license. Remember that this decision requires your approval—you
don’t have to let the publisher decide. Some commercial publishers
will use a free license if you insist, but they will not propose the
option; it is up to you to raise the issue and say firmly that this is
what you want. If the publisher you are dealing with refuses, please
try other publishers. If you’re not sure whether a proposed license
is free, write to licensing@gnu.org.
You can encourage commercial publishers to sell more free, copylefted
manuals and tutorials by buying them, and particularly by buying
copies from the publishers that paid for their writing or for major
improvements. Meanwhile, try to avoid buying non-free documentation
at all. Check the distribution terms of a manual before you buy it,
and insist that whoever seeks your business must respect your freedom.
Check the history of the book, and try to reward the publishers that
have paid or pay the authors to work on it.
The Free Software Foundation maintains a list of free documentation
published by other publishers, at
http://www.fsf.org/doc/other-free-books.html.
Contributors to GDB
Richard Stallman was the original author of GDB, and of many
other GNU programs. Many others have contributed to its
development. This section attempts to credit major contributors. One
of the virtues of free software is that everyone is free to contribute
to it; with regret, we cannot actually acknowledge everyone here. The
file ChangeLog in the GDB distribution approximates a
blow-by-blow account.
Changes much prior to version 2.0 are lost in the mists of time.
Plea: Additions to this section are particularly welcome. If you
or your friends (or enemies, to be evenhanded) have been unfairly
omitted from this list, we would like to add your names!
So that they may not regard their many labors as thankless, we
particularly thank those who shepherded GDB through major
releases:
Andrew Cagney (releases 6.3, 6.2, 6.1, 6.0, 5.3, 5.2, 5.1 and 5.0);
Jim Blandy (release 4.18);
Jason Molenda (release 4.17);
Stan Shebs (release 4.14);
Fred Fish (releases 4.16, 4.15, 4.13, 4.12, 4.11, 4.10, and 4.9);
Stu Grossman and John Gilmore (releases 4.8, 4.7, 4.6, 4.5, and 4.4);
John Gilmore (releases 4.3, 4.2, 4.1, 4.0, and 3.9);
Jim Kingdon (releases 3.5, 3.4, and 3.3);
and Randy Smith (releases 3.2, 3.1, and 3.0).
Richard Stallman, assisted at various times by Peter TerMaat, Chris
Hanson, and Richard Mlynarik, handled releases through 2.8.
Michael Tiemann is the author of most of the GNU C++ support
in GDB, with significant additional contributions from Per
Bothner and Daniel Berlin. James Clark wrote the GNU C++
demangler. Early work on C++ was by Peter TerMaat (who also did
much general update work leading to release 3.0).
GDB uses the BFD subroutine library to examine multiple
object-file formats; BFD was a joint project of David V.
Henkel-Wallace, Rich Pixley, Steve Chamberlain, and John Gilmore.
David Johnson wrote the original COFF support; Pace Willison did
the original support for encapsulated COFF.
Brent Benson of Harris Computer Systems contributed DWARF 2 support.
Adam de Boor and Bradley Davis contributed the ISI Optimum V support.
Per Bothner, Noboyuki Hikichi, and Alessandro Forin contributed MIPS
support.
Jean-Daniel Fekete contributed Sun 386i support.
Chris Hanson improved the HP9000 support.
Noboyuki Hikichi and Tomoyuki Hasei contributed Sony/News OS 3 support.
David Johnson contributed Encore Umax support.
Jyrki Kuoppala contributed Altos 3068 support.
Jeff Law contributed HP PA and SOM support.
Keith Packard contributed NS32K support.
Doug Rabson contributed Acorn Risc Machine support.
Bob Rusk contributed Harris Nighthawk CX-UX support.
Chris Smith contributed Convex support (and Fortran debugging).
Jonathan Stone contributed Pyramid support.
Michael Tiemann contributed SPARC support.
Tim Tucker contributed support for the Gould NP1 and Gould Powernode.
Pace Willison contributed Intel 386 support.
Jay Vosburgh contributed Symmetry support.
Marko Mlinar contributed OpenRISC 1000 support.
Andreas Schwab contributed M68K GNU/Linux support.
Rich Schaefer and Peter Schauer helped with support of SunOS shared
libraries.
Jay Fenlason and Roland McGrath ensured that GDB and GAS agree
about several machine instruction sets.
Patrick Duval, Ted Goldstein, Vikram Koka and Glenn Engel helped develop
remote debugging. Intel Corporation, Wind River Systems, AMD, and ARM
contributed remote debugging modules for the i960, VxWorks, A29K UDI,
and RDI targets, respectively.
Brian Fox is the author of the readline libraries providing
command-line editing and command history.
Andrew Beers of SUNY Buffalo wrote the language-switching code, the
Modula-2 support, and contributed the Languages chapter of this manual.
Fred Fish wrote most of the support for Unix System Vr4.
He also enhanced the command-completion support to cover C++ overloaded
symbols.
Hitachi America (now Renesas America), Ltd. sponsored the support for
H8/300, H8/500, and Super-H processors.
NEC sponsored the support for the v850, Vr4xxx, and Vr5xxx processors.
Mitsubishi (now Renesas) sponsored the support for D10V, D30V, and M32R/D
processors.
Toshiba sponsored the support for the TX39 Mips processor.
Matsushita sponsored the support for the MN10200 and MN10300 processors.
Fujitsu sponsored the support for SPARClite and FR30 processors.
Kung Hsu, Jeff Law, and Rick Sladkey added support for hardware
watchpoints.
Michael Snyder added support for tracepoints.
Stu Grossman wrote gdbserver.
Jim Kingdon, Peter Schauer, Ian Taylor, and Stu Grossman made
nearly innumerable bug fixes and cleanups throughout GDB.
The following people at the Hewlett-Packard Company contributed
support for the PA-RISC 2.0 architecture, HP-UX 10.20, 10.30, and 11.0
(narrow mode), HP’s implementation of kernel threads, HP’s aC++
compiler, and the Text User Interface (nee Terminal User Interface):
Ben Krepp, Richard Title, John Bishop, Susan Macchia, Kathy Mann,
Satish Pai, India Paul, Steve Rehrauer, and Elena Zannoni. Kim Haase
provided HP-specific information in this manual.
DJ Delorie ported GDB to MS-DOS, for the DJGPP project.
Robert Hoehne made significant contributions to the DJGPP port.
Cygnus Solutions has sponsored GDB maintenance and much of its
development since 1991. Cygnus engineers who have worked on GDB
fulltime include Mark Alexander, Jim Blandy, Per Bothner, Kevin
Buettner, Edith Epstein, Chris Faylor, Fred Fish, Martin Hunt, Jim
Ingham, John Gilmore, Stu Grossman, Kung Hsu, Jim Kingdon, John Metzler,
Fernando Nasser, Geoffrey Noer, Dawn Perchik, Rich Pixley, Zdenek
Radouch, Keith Seitz, Stan Shebs, David Taylor, and Elena Zannoni. In
addition, Dave Brolley, Ian Carmichael, Steve Chamberlain, Nick Clifton,
JT Conklin, Stan Cox, DJ Delorie, Ulrich Drepper, Frank Eigler, Doug
Evans, Sean Fagan, David Henkel-Wallace, Richard Henderson, Jeff
Holcomb, Jeff Law, Jim Lemke, Tom Lord, Bob Manson, Michael Meissner,
Jason Merrill, Catherine Moore, Drew Moseley, Ken Raeburn, Gavin
Romig-Koch, Rob Savoye, Jamie Smith, Mike Stump, Ian Taylor, Angela
Thomas, Michael Tiemann, Tom Tromey, Ron Unrau, Jim Wilson, and David
Zuhn have made contributions both large and small.
Andrew Cagney, Fernando Nasser, and Elena Zannoni, while working for
Cygnus Solutions, implemented the original GDB/MI interface.
Jim Blandy added support for preprocessor macros, while working for Red
Hat.
Andrew Cagney designed GDB’s architecture vector. Many
people including Andrew Cagney, Stephane Carrez, Randolph Chung, Nick
Duffek, Richard Henderson, Mark Kettenis, Grace Sainsbury, Kei
Sakamoto, Yoshinori Sato, Michael Snyder, Andreas Schwab, Jason
Thorpe, Corinna Vinschen, Ulrich Weigand, and Elena Zannoni, helped
with the migration of old architectures to this new framework.
Andrew Cagney completely re-designed and re-implemented GDB’s
unwinder framework, this consisting of a fresh new design featuring
frame IDs, independent frame sniffers, and the sentinel frame. Mark
Kettenis implemented the DWARF 2 unwinder, Jeff Johnston the
libunwind unwinder, and Andrew Cagney the dummy, sentinel, tramp, and
trad unwinders. The architecture-specific changes, each involving a
complete rewrite of the architecture’s frame code, were carried out by
Jim Blandy, Joel Brobecker, Kevin Buettner, Andrew Cagney, Stephane
Carrez, Randolph Chung, Orjan Friberg, Richard Henderson, Daniel
Jacobowitz, Jeff Johnston, Mark Kettenis, Theodore A. Roth, Kei
Sakamoto, Yoshinori Sato, Michael Snyder, Corinna Vinschen, and Ulrich
Weigand.
Christian Zankel, Ross Morley, Bob Wilson, and Maxim Grigoriev from
Tensilica, Inc. contributed support for Xtensa processors. Others
who have worked on the Xtensa port of GDB in the past include
Steve Tjiang, John Newlin, and Scott Foehner.
Michael Eager and staff of Xilinx, Inc., contributed support for the
Xilinx MicroBlaze architecture.
Initial support for the FreeBSD/mips target and native configuration
was developed by SRI International and the University of Cambridge
Computer Laboratory under DARPA/AFRL contract FA8750-10-C-0237
(«CTSRD»), as part of the DARPA CRASH research programme.
Initial support for the FreeBSD/riscv target and native configuration
was developed by SRI International and the University of Cambridge
Computer Laboratory (Department of Computer Science and Technology)
under DARPA contract HR0011-18-C-0016 («ECATS»), as part of the DARPA
SSITH research programme.
The original port to the OpenRISC 1000 is believed to be due to
Alessandro Forin and Per Bothner. More recent ports have been the work
of Jeremy Bennett, Franck Jullien, Stefan Wallentowitz and
Stafford Horne.
Weimin Pan, David Faust and Jose E. Marchesi contributed support for
the Linux kernel BPF virtual architecture. This work was sponsored by
Oracle.
1 A Sample GDB Session
You can use this manual at your leisure to read all about GDB.
However, a handful of commands are enough to get started using the
debugger. This chapter illustrates those commands.
One of the preliminary versions of GNU m4 (a generic macro
processor) exhibits the following bug: sometimes, when we change its
quote strings from the default, the commands used to capture one macro
definition within another stop working. In the following short m4
session, we define a macro foo which expands to 0000; we
then use the m4 built-in defn to define bar as the
same thing. However, when we change the open quote string to
<QUOTE> and the close quote string to <UNQUOTE>, the same
procedure fails to define a new synonym baz:
$ cd gnu/m4
$ ./m4
define(foo,0000)

foo
0000
define(bar,defn(‘foo’))

bar
0000
changequote(<QUOTE>,<UNQUOTE>)

define(baz,defn(<QUOTE>foo<UNQUOTE>))
baz
Ctrl-d
m4: End of input: 0: fatal error: EOF in string
Let us use GDB to try to see what is going on.
$ gdb m4
GDB is free software and you are welcome to distribute copies
 of it under certain conditions; type "show copying" to see
 the conditions.
There is absolutely no warranty for GDB; type "show warranty"
 for details.

GDB 13.1.90.20230516-git, Copyright 1999 Free Software Foundation, Inc...
(gdb)
GDB reads only enough symbol data to know where to find the
rest when needed; as a result, the first prompt comes up very quickly.
We now tell GDB to use a narrower display width than usual, so
that examples fit in this manual.
We need to see how the m4 built-in changequote works.
Having looked at the source, we know the relevant subroutine is
m4_changequote, so we set a breakpoint there with the GDB
break command.
(gdb) break m4_changequote
Breakpoint 1 at 0x62f4: file builtin.c, line 879.
Using the run command, we start m4 running under GDB
control; as long as control does not reach the m4_changequote
subroutine, the program runs as usual:
(gdb) run
Starting program: /work/Editorial/gdb/gnu/m4/m4
define(foo,0000)

foo
0000
To trigger the breakpoint, we call changequote. GDB
suspends execution of m4, displaying information about the
context where it stops.
changequote(<QUOTE>,<UNQUOTE>)

Breakpoint 1, m4_changequote (argc=3, argv=0x33c70)
    at builtin.c:879
879         if (bad_argc(TOKEN_DATA_TEXT(argv[0]),argc,1,3))
Now we use the command n (next) to advance execution to
the next line of the current function.
(gdb) n
882         set_quotes((argc >= 2) ? TOKEN_DATA_TEXT(argv[1])
 : nil,
set_quotes looks like a promising subroutine. We can go into it
by using the command s (step) instead of next.
step goes to the next line to be executed in any
subroutine, so it steps into set_quotes.
(gdb) s
set_quotes (lq=0x34c78 "<QUOTE>", rq=0x34c88 "<UNQUOTE>")
    at input.c:530
530         if (lquote != def_lquote)
The display that shows the subroutine where m4 is now
suspended (and its arguments) is called a stack frame display. It
shows a summary of the stack. We can use the backtrace
command (which can also be spelled bt), to see where we are
in the stack as a whole: the backtrace command displays a
stack frame for each active subroutine.
(gdb) bt
#0  set_quotes (lq=0x34c78 "<QUOTE>", rq=0x34c88 "<UNQUOTE>")
    at input.c:530
#1  0x6344 in m4_changequote (argc=3, argv=0x33c70)
    at builtin.c:882
#2  0x8174 in expand_macro (sym=0x33320) at macro.c:242
#3  0x7a88 in expand_token (obs=0x0, t=209696, td=0xf7fffa30)
    at macro.c:71
#4  0x79dc in expand_input () at macro.c:40
#5  0x2930 in main (argc=0, argv=0xf7fffb20) at m4.c:195
We step through a few more lines to see what happens. The first two
times, we can use ‘s’; the next two times we use n to avoid
falling into the xstrdup subroutine.
(gdb) s
0x3b5c  532         if (rquote != def_rquote)
(gdb) s
0x3b80  535         lquote = (lq == nil || *lq == '') ?
def_lquote : xstrdup(lq);
(gdb) n
536         rquote = (rq == nil || *rq == '') ? def_rquote
 : xstrdup(rq);
(gdb) n
538         len_lquote = strlen(rquote);
The last line displayed looks a little odd; we can examine the variables
lquote and rquote to see if they are in fact the new left
and right quotes we specified. We use the command p
(print) to see their values.
(gdb) p lquote
$1 = 0x35d40 "<QUOTE>"
(gdb) p rquote
$2 = 0x35d50 "<UNQUOTE>"
lquote and rquote are indeed the new left and right quotes.
To look at some context, we can display ten lines of source
surrounding the current line with the l (list) command.
(gdb) l
533             xfree(rquote);
534
535         lquote = (lq == nil || *lq == '') ? def_lquote
 : xstrdup (lq);
536         rquote = (rq == nil || *rq == '') ? def_rquote
 : xstrdup (rq);
537
538         len_lquote = strlen(rquote);
539         len_rquote = strlen(lquote);
540     }
541
542     void
Let us step past the two lines that set len_lquote and
len_rquote, and then examine the values of those variables.
(gdb) n
539         len_rquote = strlen(lquote);
(gdb) n
540     }
(gdb) p len_lquote
$3 = 9
(gdb) p len_rquote
$4 = 7
That certainly looks wrong, assuming len_lquote and
len_rquote are meant to be the lengths of lquote and
rquote respectively. We can set them to better values using
the p command, since it can print the value of
any expression—and that expression can include subroutine calls and
assignments.
(gdb) p len_lquote=strlen(lquote)
$5 = 7
(gdb) p len_rquote=strlen(rquote)
$6 = 9
Is that enough to fix the problem of using the new quotes with the
m4 built-in defn? We can allow m4 to continue
executing with the c (continue) command, and then try the
example that caused trouble initially:
(gdb) c
Continuing.

define(baz,defn(<QUOTE>foo<UNQUOTE>))

baz
0000
Success! The new quotes now work just as well as the default ones. The
problem seems to have been just the two typos defining the wrong
lengths. We allow m4 exit by giving it an EOF as input:
Ctrl-d
Program exited normally.
The message ‘Program exited normally.’ is from GDB; it
indicates m4 has finished executing. We can end our GDB
session with the GDB quit command.
2 Getting In and Out of GDB
This chapter discusses how to start GDB, and how to get out of it.
The essentials are:
- type ‘gdb’ to start GDB.
- type quit, exit or Ctrl-d to exit.
2.1 Invoking GDB
Invoke GDB by running the program gdb. Once started,
GDB reads commands from the terminal until you tell it to exit.
You can also run gdb with a variety of arguments and options,
to specify more of your debugging environment at the outset.
The command-line options described here are designed
to cover a variety of situations; in some environments, some of these
options may effectively be unavailable.
The most usual way to start GDB is with one argument,
specifying an executable program:
You can also start with both an executable program and a core file
specified:
You can, instead, specify a process ID as a second argument or use option
-p, if you want to debug a running process:
gdb program 1234
gdb -p 1234
would attach GDB to process 1234. With option -p you
can omit the program filename.
Taking advantage of the second command-line argument requires a fairly
complete operating system; when you use GDB as a remote
debugger attached to a bare board, there may not be any notion of
“process”, and there is often no way to get a core dump. GDB
will warn you if it is unable to attach or to read core dumps.
You can optionally have gdb pass any arguments after the
executable file to the inferior using --args. This option stops
option processing.
gdb --args gcc -O2 -c foo.c
This will cause gdb to debug gcc, and to set
gcc’s command-line arguments (see Arguments) to ‘-O2 -c foo.c’.
You can run gdb without printing the front material, which describes
GDB’s non-warranty, by specifying --silent
(or -q/--quiet):
You can further control how GDB starts up by using command-line
options. GDB itself can remind you of the options available.
Type
to display all available options and briefly describe their use
(‘gdb -h’ is a shorter equivalent).
All options and command line arguments you give are processed
in sequential order. The order makes a difference when the
‘-x’ option is used.
2.1.1 Choosing Files
When GDB starts, it reads any arguments other than options as
specifying an executable file and core file (or process ID). This is
the same as if the arguments were specified by the ‘-se’ and
‘-c’ (or ‘-p’) options respectively. (GDB reads the
first argument that does not have an associated option flag as
equivalent to the ‘-se’ option followed by that argument; and the
second argument that does not have an associated option flag, if any, as
equivalent to the ‘-c’/‘-p’ option followed by that argument.)
If the second argument begins with a decimal digit, GDB will
first attempt to attach to it as a process, and if that fails, attempt
to open it as a corefile. If you have a corefile whose name begins with
a digit, you can prevent GDB from treating it as a pid by
prefixing it with ./, e.g. ./12345.
If GDB has not been configured to included core file support,
such as for most embedded targets, then it will complain about a second
argument and ignore it.
For the ‘-s’, ‘-e’, and ‘-se’ options, and their long
form equivalents, the method used to search the file system for the
symbol and/or executable file is the same as that used by the
file command. See file.
Many options have both long and short forms; both are shown in the
following list. GDB also recognizes the long forms if you truncate
them, so long as enough of the option is present to be unambiguous.
(If you prefer, you can flag option arguments with ‘—’ rather
than ‘—’, though we illustrate the more usual convention.)
-symbols file-s file-
Read symbol table from file file.
-exec file-e file-
Use file file as the executable file to execute when appropriate,
and for examining pure data in conjunction with a core dump. -se file-
Read symbol table from file file and use it as the executable
file. -core file-c file-
Use file file as a core dump to examine.
-pid number-p number-
Connect to process ID number, as with the
attachcommand. -command file-x file-
Execute commands from file file. The contents of this file is
evaluated exactly as thesourcecommand would.
See Command files. -eval-command command-ex command-
Execute a single GDB command.
This option may be used multiple times to call multiple commands. It may
also be interleaved with ‘-command’ as required.gdb -ex 'target sim' -ex 'load' -x setbreakpoints -ex 'run' a.out
-init-command file-ix file-
Execute commands from file file before loading the inferior (but
after loading gdbinit files).
See Startup. -init-eval-command command-iex command-
Execute a single GDB command before loading the inferior (but
after loading gdbinit files).
See Startup. -early-init-command file-eix file-
Execute commands from file very early in the initialization
process, before any output is produced. See Startup. -early-init-eval-command command-eiex command-
Execute a single GDB command very early in the initialization
process, before any output is produced. -directory directory-d directory-
Add directory to the path to search for source and script files.
-r-readnow-
Read each symbol file’s entire symbol table immediately, rather than
the default, which is to read it incrementally as it is needed.
This makes startup slower, but makes future operations faster. --readnever-
Do not read each symbol file’s symbolic debug information. This makes
startup faster but at the expense of not being able to perform
symbolic debugging. DWARF unwind information is also not read,
meaning backtraces may become incomplete or inaccurate. One use of
this is when a user simply wants to do the following sequence: attach,
dump core, detach. Loading the debugging information in this case is
an unnecessary cause of delay.
2.1.2 Choosing Modes
You can run GDB in various alternative modes—for example, in
batch mode or quiet mode.
-nx-n-
Do not execute commands found in any initialization files
(see Initialization Files). -nh-
Do not execute commands found in any home directory initialization
file (see Home directory initialization
file). The system wide and current directory initialization files
are still loaded. -quiet-silent-q-
“Quiet”. Do not print the introductory and copyright messages. These
messages are also suppressed in batch mode.This can also be enabled using
set startup-quietly on. The
default isoff. Useshow startup-quietlyto see the
current setting. Placeset startup-quietly oninto your early
initialization file (see Initialization
Files) to have future GDB sessions startup quietly. -batch-
Run in batch mode. Exit with status
0after processing all the
command files specified with ‘-x’ (and all commands from
initialization files, if not inhibited with ‘-n’). Exit with
nonzero status if an error occurs in executing the GDB commands
in the command files. Batch mode also disables pagination, sets unlimited
terminal width and height see Screen Size, and acts as if set confirm
off were in effect (see Messages/Warnings).Batch mode may be useful for running GDB as a filter, for
example to download and run a program on another computer; in order to
make this more useful, the message(which is ordinarily issued whenever a program running under
GDB control terminates) is not issued when running in batch
mode. -batch-silent-
Run in batch mode exactly like ‘-batch’, but totally silently. All
GDB output tostdoutis prevented (stderris
unaffected). This is much quieter than ‘-silent’ and would be useless
for an interactive session.This is particularly useful when using targets that give ‘Loading section’
messages, for example.Note that targets that give their output via GDB, as opposed to
writing directly tostdout, will also be made silent. -return-child-result-
The return code from GDB will be the return code from the child
process (the process being debugged), with the following exceptions:- GDB exits abnormally. E.g., due to an incorrect argument or an
internal error. In this case the exit code is the same as it would have been
without ‘-return-child-result’. - The user quits with an explicit value. E.g., ‘quit 1’.
- The child process never runs, or is not allowed to terminate, in which case
the exit code will be -1.
This option is useful in conjunction with ‘-batch’ or ‘-batch-silent’,
when GDB is being used as a remote program loader or simulator
interface. - GDB exits abnormally. E.g., due to an incorrect argument or an
-nowindows-nw-
“No windows”. If GDB comes with a graphical user interface
(GUI) built in, then this option tells GDB to only use the command-line
interface. If no GUI is available, this option has no effect. -windows-w-
If GDB includes a GUI, then this option requires it to be
used if possible. -cd directory-
Run GDB using directory as its working directory,
instead of the current directory. -data-directory directory-D directory-
Run GDB using directory as its data directory.
The data directory is where GDB searches for its
auxiliary files. See Data Files. -fullname-f-
GNU Emacs sets this option when it runs GDB as a
subprocess. It tells GDB to output the full file name and line
number in a standard, recognizable fashion each time a stack frame is
displayed (which includes each time your program stops). This
recognizable format looks like two ‘32’ characters, followed by
the file name, line number and character position separated by colons,
and a newline. The Emacs-to-GDB interface program uses the two
‘32’ characters as a signal to display the source code for the
frame. -annotate level-
This option sets the annotation level inside GDB. Its
effect is identical to using ‘set annotate level’
(see Annotations). The annotation level controls how much
information GDB prints together with its prompt, values of
expressions, source lines, and other types of output. Level 0 is the
normal, level 1 is for use when GDB is run as a subprocess of
GNU Emacs, level 3 is the maximum annotation suitable for programs
that control GDB, and level 2 has been deprecated.The annotation mechanism has largely been superseded by GDB/MI
(see GDB/MI). --args-
Change interpretation of command line so that arguments following the
executable file are passed as command line arguments to the inferior.
This option stops option processing. -baud bps-b bps-
Set the line speed (baud rate or bits per second) of any serial
interface used by GDB for remote debugging. -l timeout-
Set the timeout (in seconds) of any communication used by GDB
for remote debugging. -tty device-t device-
Run using device for your program’s standard input and output.
-tui-
Activate the Text User Interface when starting. The Text User
Interface manages several text windows on the terminal, showing
source, assembly, registers and GDB command outputs
(see GDB Text User Interface). Do not use this
option if you run GDB from Emacs (see Using GDB under GNU Emacs). -interpreter interp-
Use the interpreter interp for interface with the controlling
program or device. This option is meant to be set by programs which
communicate with GDB using it as a back end.
See Command Interpreters.‘—interpreter=mi’ (or ‘—interpreter=mi3’) causes
GDB to use the GDB/MI interface version 3 (see The GDB/MI Interface) included since GDB version 9.1. GDB/MI
version 2 (mi2), included in GDB 6.0 and version 1 (mi1),
included in GDB 5.3, are also available. Earlier GDB/MI
interfaces are no longer supported. -write-
Open the executable and core files for both reading and writing. This
is equivalent to the ‘set write on’ command inside GDB
(see Patching). -statistics-
This option causes GDB to print statistics about time and
memory usage after it completes each command and returns to the prompt. -version-
This option causes GDB to print its version number and
no-warranty blurb, and exit. -configuration-
This option causes GDB to print details about its build-time
configuration parameters, and then exit. These details can be
important when reporting GDB bugs (see GDB Bugs).
2.1.3 What GDB Does During Startup
Here’s the description of what GDB does during session startup:
- Performs minimal setup required to initialize basic internal state.
-
Reads commands from the early initialization file (if any) in your
home directory. Only a restricted set of commands can be placed into
an early initialization file, see Initialization Files, for
details. - Executes commands and command files specified by the ‘-eiex’ and
‘-eix’ command line options in their specified order. Only a
restricted set of commands can be used with ‘-eiex’ and
‘eix’, see Initialization Files, for details. - Sets up the command interpreter as specified by the command line
(see interpreter). -
Reads the system wide initialization file and the files from the
system wide initialization directory, see System Wide Init Files. - Reads the initialization file (if any) in your home directory and
executes all the commands in that file, see Home Directory Init File. - Executes commands and command files specified by the ‘-iex’ and
‘-ix’ options in their specified order. Usually you should use the
‘-ex’ and ‘-x’ options instead, but this way you can apply
settings before GDB init files get executed and before inferior
gets loaded. - Processes command line options and operands.
- Reads and executes the commands from the initialization file (if any)
in the current working directory as long as ‘set auto-load
local-gdbinit’ is set to ‘on’ (see Init File in the Current Directory). This is only done if the current directory is different
from your home directory. Thus, you can have more than one init file,
one generic in your home directory, and another, specific to the
program you are debugging, in the directory where you invoke
GDB. See Init File in the Current Directory during Startup. - If the command line specified a program to debug, or a process to
attach to, or a core file, GDB loads any auto-loaded
scripts provided for the program or for its loaded shared libraries.
See Auto-loading.If you wish to disable the auto-loading during startup,
you must do something like the following:$ gdb -iex "set auto-load python-scripts off" myprogram
Option ‘-ex’ does not work because the auto-loading is then turned
off too late. - Executes commands and command files specified by the ‘-ex’ and
‘-x’ options in their specified order. See Command Files, for
more details about GDB command files. - Reads the command history recorded in the history file.
See Command History, for more details about the command history and the
files where GDB records it.
2.1.4 Initialization Files
During startup (see Startup) GDB will execute commands
from several initialization files. These initialization files use the
same syntax as command files (see Command Files) and are
processed by GDB in the same way.
To display the list of initialization files loaded by GDB at
startup, in the order they will be loaded, you can use gdb
--help.
The early initialization file is loaded very early in
GDB’s initialization process, before the interpreter
(see Interpreters) has been initialized, and before the default
target (see Targets) is initialized. Only set or
source commands should be placed into an early initialization
file, and the only set commands that can be used are those that
control how GDB starts up.
Commands that can be placed into an early initialization file will be
documented as such throughout this manual. Any command that is not
documented as being suitable for an early initialization file should
instead be placed into a general initialization file. Command files
passed to --early-init-command or -eix are also early
initialization files, with the same command restrictions. Only
commands that can appear in an early initialization file should be
passed to --early-init-eval-command or -eiex.
In contrast, the general initialization files are processed
later, after GDB has finished its own internal initialization
process, any valid command can be used in these files.
Throughout the rest of this document the term initialization
file refers to one of the general initialization files, not the early
initialization file. Any discussion of the early initialization file
will specifically mention that it is the early initialization file
being discussed.
As the system wide and home directory initialization files are
processed before most command line options, changes to settings
(e.g. ‘set complaints’) can affect subsequent processing of
command line options and operands.
The following sections describe where GDB looks for the early
initialization and initialization files, and the order that the files
are searched for.
2.1.4.1 Home directory early initialization files
GDB initially looks for an early initialization file in the
users home directory1. There are a number of locations that GDB will
search in the home directory, these locations are searched in order
and GDB will load the first file that it finds, and
subsequent locations will not be checked.
On non-macOS hosts the locations searched are:
- The file gdb/gdbearlyinit within the directory pointed to by the
environment variableXDG_CONFIG_HOME, if it is defined. - The file .config/gdb/gdbearlyinit within the directory pointed to
by the environment variableHOME, if it is defined. - The file .gdbearlyinit within the directory pointed to by the
environment variableHOME, if it is defined.
By contrast, on macOS hosts the locations searched are:
- The file Library/Preferences/gdb/gdbearlyinit within the
directory pointed to by the environment variableHOME, if it is
defined. - The file .gdbearlyinit within the directory pointed to by the
environment variableHOME, if it is defined.
It is possible to prevent the home directory early initialization file
from being loaded using the ‘-nx’ or ‘-nh’ command line
options, see Choosing Modes.
2.1.4.2 System wide initialization files
There are two locations that are searched for system wide
initialization files. Both of these locations are always checked:
system.gdbinit-
This is a single system-wide initialization file. Its location is
specified with the--with-system-gdbinitconfigure option
(see System-wide configuration). It is loaded first when
GDB starts, before command line options have been processed. system.gdbinit.d-
This is the system-wide initialization directory. Its location is
specified with the--with-system-gdbinit-dirconfigure option
(see System-wide configuration). Files in this directory are
loaded in alphabetical order immediately after system.gdbinit
(if enabled) when GDB starts, before command line options
have been processed. Files need to have a recognized scripting
language extension (.py/.scm) or be named with a
.gdb extension to be interpreted as regular GDB
commands. GDB will not recurse into any subdirectories of
this directory.
It is possible to prevent the system wide initialization files from
being loaded using the ‘-nx’ command line option, see Choosing Modes.
2.1.4.3 Home directory initialization file
After loading the system wide initialization files GDB will
look for an initialization file in the users home
directory2. There are a
number of locations that GDB will search in the home
directory, these locations are searched in order and GDB will
load the first file that it finds, and subsequent locations will not
be checked.
On non-Apple hosts the locations searched are:
- $XDG_CONFIG_HOME/gdb/gdbinit
- $HOME/.config/gdb/gdbinit
- $HOME/.gdbinit
While on Apple hosts the locations searched are:
- $HOME/Library/Preferences/gdb/gdbinit
- $HOME/.gdbinit
It is possible to prevent the home directory initialization file from
being loaded using the ‘-nx’ or ‘-nh’ command line options,
see Choosing Modes.
The DJGPP port of GDB uses the name gdb.ini instead of
.gdbinit or gdbinit, due to the limitations of file
names imposed by DOS filesystems. The Windows port of GDB
uses the standard name, but if it finds a gdb.ini file in your
home directory, it warns you about that and suggests to rename the
file to the standard name.
2.1.4.4 Local directory initialization file
GDB will check the current directory for a file called
.gdbinit. It is loaded last, after command line options
other than ‘-x’ and ‘-ex’ have been processed. The command
line options ‘-x’ and ‘-ex’ are processed last, after
.gdbinit has been loaded, see Choosing
Files.
If the file in the current directory was already loaded as the home
directory initialization file then it will not be loaded a second
time.
It is possible to prevent the local directory initialization file from
being loaded using the ‘-nx’ command line option, see Choosing Modes.
2.2 Quitting GDB
quit [expression]exit [expression]q-
To exit GDB, use the
quitcommand (abbreviated
q), theexitcommand, or type an end-of-file
character (usually Ctrl-d). If you do not supply expression,
GDB will terminate normally; otherwise it will terminate using
the result of expression as the error code.
An interrupt (often Ctrl-c) does not exit from GDB, but rather
terminates the action of any GDB command that is in progress and
returns to GDB command level. It is safe to type the interrupt
character at any time because GDB does not allow it to take effect
until a time when it is safe.
If you have been using GDB to control an attached process or
device, you can release it with the detach command
(see Debugging an Already-running Process).
2.3 Shell Commands
If you need to execute occasional shell commands during your
debugging session, there is no need to leave or suspend GDB; you can
just use the shell command.
shell command-string!command-string-
Invoke a standard shell to execute command-string.
Note that no space is needed between!and command-string.
On GNU and Unix systems, the environment variableSHELL, if it
exists, determines which shell to run. Otherwise GDB uses
the default shell (/bin/sh on GNU and Unix systems,
cmd.exe on MS-Windows, COMMAND.COM on MS-DOS, etc.).
The utility make is often needed in development environments.
You do not have to use the shell command for this purpose in
GDB:
make make-args-
Execute the
makeprogram with the specified
arguments. This is equivalent to ‘shell make make-args’.
pipe [command] | shell_command| [command] | shell_commandpipe -d delim command delim shell_command| -d delim command delim shell_command-
Executes command and sends its output to shell_command.
Note that no space is needed around|.
If no command is provided, the last command executed is repeated.In case the command contains a
|, the option-d delim
can be used to specify an alternate delimiter string delim that separates
the command from the shell_command.Example:
(gdb) p var
$1 = {
  black = 144,
  red = 233,
  green = 377,
  blue = 610,
  white = 987
}
(gdb) pipe p var|wc 7 19 80 (gdb) |p var|wc -l 7(gdb) p /x var $4 = { black = 0x90, red = 0xe9, green = 0x179, blue = 0x262, white = 0x3db } (gdb) ||grep red red => 0xe9,(gdb) | -d ! echo this contains a | charn ! sed -e 's/|/PIPE/' this contains a PIPE char (gdb) | -d xxx echo this contains a | char!n xxx sed -e 's/|/PIPE/' this contains a PIPE char! (gdb)
The convenience variables $_shell_exitcode and $_shell_exitsignal
can be used to examine the exit status of the last shell command launched
by shell, make, pipe and |.
See Convenience Variables.
2.4 Logging Output
You may want to save the output of GDB commands to a file.
There are several commands to control GDB’s logging.
set logging enabled [on|off]-
Enable or disable logging.
set logging file file-
Change the name of the current logfile. The default logfile is gdb.txt.
set logging overwrite [on|off]-
By default, GDB will append to the logfile. Set
overwriteif
you wantset logging enabled onto overwrite the logfile instead. set logging redirect [on|off]-
By default, GDB output will go to both the terminal and the logfile.
Setredirectif you want output to go only to the log file. set logging debugredirect [on|off]-
By default, GDB debug output will go to both the terminal and the logfile.
Setdebugredirectif you want debug output to go only to the log file. show logging-
Show the current values of the logging settings.
You can also redirect the output of a GDB command to a
shell command. See pipe.
3 GDB Commands
You can abbreviate a GDB command to the first few letters of the command
name, if that abbreviation is unambiguous; and you can repeat certain
GDB commands by typing just RET. You can also use the TAB
key to get GDB to fill out the rest of a word in a command (or to
show you the alternatives available, if there is more than one possibility).
3.1 Command Syntax
A GDB command is a single line of input. There is no limit on
how long it can be. It starts with a command name, which is followed by
arguments whose meaning depends on the command name. For example, the
command step accepts an argument which is the number of times to
step, as in ‘step 5’. You can also use the step command
with no arguments. Some commands do not allow any arguments.
GDB command names may always be truncated if that abbreviation is
unambiguous. Other possible command abbreviations are listed in the
documentation for individual commands. In some cases, even ambiguous
abbreviations are allowed; for example, s is specially defined as
equivalent to step even though there are other commands whose
names start with s. You can test abbreviations by using them as
arguments to the help command.
A blank line as input to GDB (typing just RET) means to
repeat the previous command. Certain commands (for example, run)
will not repeat this way; these are commands whose unintentional
repetition might cause trouble and which you are unlikely to want to
repeat. User-defined commands can disable this feature; see
dont-repeat.
The list and x commands, when you repeat them with
RET, construct new arguments rather than repeating
exactly as typed. This permits easy scanning of source or memory.
GDB can also use RET in another way: to partition lengthy
output, in a way similar to the common utility more
(see Screen Size). Since it is easy to press one
RET too many in this situation, GDB disables command
repetition after any command that generates this sort of display.
Any text from a # to the end of the line is a comment; it does
nothing. This is useful mainly in command files (see Command Files).
The Ctrl-o binding is useful for repeating a complex sequence of
commands. This command accepts the current line, like RET, and
then fetches the next line relative to the current line from the history
for editing.
3.2 Command Settings
Many commands change their behavior according to command-specific
variables or settings. These settings can be changed with the
set subcommands. For example, the print command
(see Examining Data) prints arrays differently depending on
settings changeable with the commands set print elements and
NUMBER-OF-ELEMENTSset print array-indexes, among others.
You can change these settings to your preference in the gdbinit files
loaded at GDB startup. See Startup.
The settings can also be changed interactively during the debugging
session. For example, to change the limit of array elements to print,
you can do the following:
(GDB) set print elements 10
(GDB) print some_array
$1 = {0, 10, 20, 30, 40, 50, 60, 70, 80, 90...}
The above set print elements 10 command changes the number of
elements to print from the default of 200 to 10. If you only intend
this limit of 10 to be used for printing some_array, then you
must restore the limit back to 200, with set print elements.
200
Some commands allow overriding settings with command options. For
example, the print command supports a number of options that
allow overriding relevant global print settings as set by set subcommands. See print options. The example above could be
print
rewritten as:
(GDB) print -elements 10 -- some_array
$1 = {0, 10, 20, 30, 40, 50, 60, 70, 80, 90...}
Alternatively, you can use the with command to change a setting
temporarily, for the duration of a command invocation.
with setting [value] [-- command]w setting [value] [-- command]-
Temporarily set setting to value for the duration of
command.setting is any setting you can change with the
set
subcommands. value is the value to assign tosetting
while runningcommand.If no command is provided, the last command executed is
repeated.If a command is provided, it must be preceded by a double dash
(--) separator. This is required because some settings accept
free-form arguments, such as expressions or filenames.For example, the command
(GDB) with print array on -- print some_array
is equivalent to the following 3 commands:
(GDB) set print array on (GDB) print some_array (GDB) set print array off
The
withcommand is particularly useful when you want to
override a setting while running user-defined commands, or commands
defined in Python or Guile. See Extending GDB.(GDB) with print pretty on -- my_complex_command
To change several settings for the same command, you can nest
withcommands. For example,with language ada -- withtemporarily changes the language to Ada and sets a
print elements 10
limit of 10 elements to print for arrays and strings.
3.3 Command Completion
GDB can fill in the rest of a word in a command for you, if there is
only one possibility; it can also show you what the valid possibilities
are for the next word in a command, at any time. This works for GDB
commands, GDB subcommands, command options, and the names of symbols
in your program.
Press the TAB key whenever you want GDB to fill out the rest
of a word. If there is only one possibility, GDB fills in the
word, and waits for you to finish the command (or press RET to
enter it). For example, if you type
GDB fills in the rest of the word ‘breakpoints’, since that is
the only info subcommand beginning with ‘bre’:
You can either press RET at this point, to run the info command, or backspace and enter something else, if
breakpoints
‘breakpoints’ does not look like the command you expected. (If you
were sure you wanted info breakpoints in the first place, you
might as well just type RET immediately after ‘info bre’,
to exploit command abbreviations rather than command completion).
If there is more than one possibility for the next word when you press
TAB, GDB sounds a bell. You can either supply more
characters and try again, or just press TAB a second time;
GDB displays all the possible completions for that word. For
example, you might want to set a breakpoint on a subroutine whose name
begins with ‘make_’, but when you type b make_TAB GDB
just sounds the bell. Typing TAB again displays all the
function names in your program that begin with those characters, for
example:
(gdb) b make_TAB
GDB sounds bell; press TAB again, to see:
make_a_section_from_file make_environ make_abs_section make_function_type make_blockvector make_pointer_type make_cleanup make_reference_type make_command make_symbol_completion_list (gdb) b make_
After displaying the available possibilities, GDB copies your
partial input (‘b make_’ in the example) so you can finish the
command.
If the command you are trying to complete expects either a keyword or a
number to follow, then ‘NUMBER’ will be shown among the available
completions, for example:
(gdb) print -elements TABTAB NUMBER unlimited (gdb) print -elements
Here, the option expects a number (e.g., 100), not literal
NUMBER. Such metasyntactical arguments are always presented in
uppercase.
If you just want to see the list of alternatives in the first place, you
can press M-? rather than pressing TAB twice. M-?
means META ?. You can type this either by holding down a
key designated as the META shift on your keyboard (if there is
one) while typing ?, or as ESC followed by ?.
If the number of possible completions is large, GDB will
print as much of the list as it has collected, as well as a message
indicating that the list may be truncated.
(gdb) b mTABTAB main <... the rest of the possible completions ...> *** List may be truncated, max-completions reached. *** (gdb) b m
This behavior can be controlled with the following commands:
set max-completions limitset max-completions unlimited-
Set the maximum number of completion candidates. GDB will
stop looking for more completions once it collects this many candidates.
This is useful when completing on things like function names as collecting
all the possible candidates can be time consuming.
The default value is 200. A value of zero disables tab-completion.
Note that setting either no limit or a very large limit can make
completion slow. show max-completions-
Show the maximum number of candidates that GDB will collect and show
during completion.
Sometimes the string you need, while logically a “word”, may contain
parentheses or other characters that GDB normally excludes from
its notion of a word. To permit word completion to work in this
situation, you may enclose words in ' (single quote marks) in
GDB commands.
A likely situation where you might need this is in typing an
expression that involves a C++ symbol name with template
parameters. This is because when completing expressions, GDB treats
the ‘<’ character as word delimiter, assuming that it’s the
less-than comparison operator (see C and C++
Operators).
For example, when you want to call a C++ template function
interactively using the print or call commands, you may
need to distinguish whether you mean the version of name that
was specialized for int, name<int>(), or the version
that was specialized for float, name<float>(). To use
the word-completion facilities in this situation, type a single quote
' at the beginning of the function name. This alerts
GDB that it may need to consider more information than usual
when you press TAB or M-? to request word completion:
(gdb) p 'func<M-? func<int>() func<float>() (gdb) p 'func<
When setting breakpoints however (see Location Specifications), you don’t
usually need to type a quote before the function name, because
GDB understands that you want to set a breakpoint on a
function:
(gdb) b func<M-? func<int>() func<float>() (gdb) b func<
This is true even in the case of typing the name of C++ overloaded
functions (multiple definitions of the same function, distinguished by
argument type). For example, when you want to set a breakpoint you
don’t need to distinguish whether you mean the version of name
that takes an int parameter, name(int), or the version
that takes a float parameter, name(float).
(gdb) b bubble(M-? bubble(int) bubble(double) (gdb) b bubble(douM-? bubble(double)
See quoting names for a description of other scenarios that
require quoting.
For more information about overloaded functions, see C++ Expressions. You can use the command set to disable overload resolution;
overload-resolution off
see GDB Features for C++.
When completing in an expression which looks up a field in a
structure, GDB also tries3 to
limit completions to the field names available in the type of the
left-hand-side:
(gdb) p gdb_stdout.M-? magic to_fputs to_rewind to_data to_isatty to_write to_delete to_put to_write_async_safe to_flush to_read
This is because the gdb_stdout is a variable of the type
struct ui_file that is defined in GDB sources as
follows:
struct ui_file
{
int *magic;
ui_file_flush_ftype *to_flush;
ui_file_write_ftype *to_write;
ui_file_write_async_safe_ftype *to_write_async_safe;
ui_file_fputs_ftype *to_fputs;
ui_file_read_ftype *to_read;
ui_file_delete_ftype *to_delete;
ui_file_isatty_ftype *to_isatty;
ui_file_rewind_ftype *to_rewind;
ui_file_put_ftype *to_put;
void *to_data;
}
3.4 Command options
Some commands accept options starting with a leading dash. For
example, print -pretty. Similarly to command names, you can
abbreviate a GDB option to the first few letters of the
option name, if that abbreviation is unambiguous, and you can also use
the TAB key to get GDB to fill out the rest of a word
in an option (or to show you the alternatives available, if there is
more than one possibility).
Some commands take raw input as argument. For example, the print
command processes arbitrary expressions in any of the languages
supported by GDB. With such commands, because raw input may
start with a leading dash that would be confused with an option or any
of its abbreviations, e.g. print -p (short for print or printing negative
-prettyp?), if you specify any command
option, then you must use a double-dash (--) delimiter to
indicate the end of options.
Some options are described as accepting an argument which can be
either on or off. These are known as boolean
options. Similarly to boolean settings commands—on and
off are the typical values, but any of 1, yes and
enable can also be used as “true” value, and any of 0,
no and disable can also be used as “false” value. You
can also omit a “true” value, as it is implied by default.
For example, these are equivalent:
(gdb) print -object on -pretty off -element unlimited -- *myptr (gdb) p -o -p 0 -e u -- *myptr
You can discover the set of options some command accepts by completing
on - after the command name. For example:
(gdb) print -TABTAB -address -max-depth -object -static-members -array -memory-tag-violations -pretty -symbol -array-indexes -nibbles -raw-values -union -elements -null-stop -repeats -vtbl
Completion will in some cases guide you with a suggestion of what kind
of argument an option expects. For example:
(gdb) print -elements TABTAB NUMBER unlimited
Here, the option expects a number (e.g., 100), not literal
NUMBER. Such metasyntactical arguments are always presented in
uppercase.
(For more on using the print command, see Examining
Data.)
3.5 Getting Help
You can always ask GDB itself for information on its commands,
using the command help.
helph-
You can use
help(abbreviatedh) with no arguments to
display a short list of named classes of commands:(gdb) help List of classes of commands: aliases -- User-defined aliases of other commands breakpoints -- Making program stop at certain points data -- Examining data files -- Specifying and examining files internals -- Maintenance commands obscure -- Obscure features running -- Running the program stack -- Examining the stack status -- Status inquiries support -- Support facilities tracepoints -- Tracing of program execution without stopping the program user-defined -- User-defined commands Type "help" followed by a class name for a list of commands in that class. Type "help" followed by command name for full documentation. Command name abbreviations are allowed if unambiguous. (gdb) help class-
Using one of the general help classes as an argument, you can get a
list of the individual commands in that class. If a command has
aliases, the aliases are given after the command name, separated by
commas. If an alias has default arguments, the full definition of
the alias is given after the first line.
For example, here is the help display for the classstatus:(gdb) help status Status inquiries. List of commands: info, inf, i -- Generic command for showing things about the program being debugged info address, iamain -- Describe where symbol SYM is stored. alias iamain = info address main info all-registers -- List of all registers and their contents, for selected stack frame. ... show, info set -- Generic command for showing things about the debugger Type "help" followed by command name for full documentation. Command name abbreviations are allowed if unambiguous. (gdb) help command-
With a command name as
helpargument, GDB displays a
short paragraph on how to use that command. If that command has
one or more aliases, GDB will display a first line with
the command name and all its aliases separated by commas.
This first line will be followed by the full definition of all aliases
having default arguments.
When asking the help for an alias, the documentation for the aliased
command is shown.A user-defined alias can optionally be documented using the
documentcommand (see document). GDB then
considers this alias as different from the aliased command: this alias
is not listed in the aliased command help output, and asking help for
this alias will show the documentation provided for the alias instead of
the documentation of the aliased command. apropos [-v] regexp-
The
aproposcommand searches through all of the GDB
commands and aliases, and their documentation, for the regular expression specified in
args. It prints out all matches found. The optional flag ‘-v’,
which stands for ‘verbose’, indicates to output the full documentation
of the matching commands and highlight the parts of the documentation
matching regexp. For example:results in:
alias -- Define a new command that is an alias of an existing command aliases -- User-defined aliases of other commands
while
apropos -v cut.*thread apply
results in the below output, where ‘cut for ‘thread apply’
is highlighted if styling is enabled.taas -- Apply a command to all threads (ignoring errors and empty output). Usage: taas COMMAND shortcut for 'thread apply all -s COMMAND' tfaas -- Apply a command to all frames of all threads (ignoring errors and empty output). Usage: tfaas COMMAND shortcut for 'thread apply all -s frame apply all -s COMMAND'
complete args-
The
complete argscommand lists all the possible completions
for the beginning of a command. Use args to specify the beginning of the
command you want completed. For example:results in:
This is intended for use by GNU Emacs.
In addition to help, you can use the GDB commands info
and show to inquire about the state of your program, or the state
of GDB itself. Each command supports many topics of inquiry; this
manual introduces each of them in the appropriate context. The listings
under info and under show in the Command, Variable, and
Function Index point to all the sub-commands. See Command and Variable Index.
info-
This command (abbreviated
i) is for describing the state of your
program. For example, you can show the arguments passed to a function
withinfo args, list the registers currently in use withinfo, or list the breakpoints you have set with
registersinfo breakpoints.
You can get a complete list of theinfosub-commands with
help info. set-
You can assign the result of an expression to an environment variable with
set. For example, you can set the GDB prompt to a $-sign with
set prompt $. show-
In contrast to
info,showis for describing the state of
GDB itself.
You can change most of the things you canshow, by using the
related commandset; for example, you can control what number
system is used for displays withset radix, or simply inquire
which is currently in use withshow radix.To display all the settable parameters and their current
values, you can useshowwith no arguments; you may also use
info set. Both commands produce the same display.
Here are several miscellaneous show subcommands, all of which are
exceptional in lacking corresponding set commands:
show version-
Show what version of GDB is running. You should include this
information in GDB bug-reports. If multiple versions of
GDB are in use at your site, you may need to determine which
version of GDB you are running; as GDB evolves, new
commands are introduced, and old ones may wither away. Also, many
system vendors ship variant versions of GDB, and there are
variant versions of GDB in GNU/Linux distributions as well.
The version number is the same as the one announced when you start
GDB. show copyinginfo copying-
Display information about permission for copying GDB.
show warrantyinfo warranty-
Display the GNU “NO WARRANTY” statement, or a warranty,
if your version of GDB comes with one. show configuration-
Display detailed information about the way GDB was configured
when it was built. This displays the optional arguments passed to the
configure script and also configuration parameters detected
automatically byconfigure. When reporting a GDB
bug (see GDB Bugs), it is important to include this information in
your report.
4 Running Programs Under GDB
When you run a program under GDB, you must first generate
debugging information when you compile it.
You may start GDB with its arguments, if any, in an environment
of your choice. If you are doing native debugging, you may redirect
your program’s input and output, debug an already running process, or
kill a child process.
4.1 Compiling for Debugging
In order to debug a program effectively, you need to generate
debugging information when you compile it. This debugging information
is stored in the object file; it describes the data type of each
variable or function and the correspondence between source line numbers
and addresses in the executable code.
To request debugging information, specify the ‘-g’ option when you run
the compiler.
Programs that are to be shipped to your customers are compiled with
optimizations, using the ‘-O’ compiler option. However, some
compilers are unable to handle the ‘-g’ and ‘-O’ options
together. Using those compilers, you cannot generate optimized
executables containing debugging information.
GCC, the GNU C/C++ compiler, supports ‘-g’ with or
without ‘-O’, making it possible to debug optimized code. We
recommend that you always use ‘-g’ whenever you compile a
program. You may think your program is correct, but there is no sense
in pushing your luck. For more information, see Optimized Code.
Older versions of the GNU C compiler permitted a variant option
‘-gg’ for debugging information. GDB no longer supports this
format; if your GNU C compiler has this option, do not use it.
GDB knows about preprocessor macros and can show you their
expansion (see Macros). Most compilers do not include information
about preprocessor macros in the debugging information if you specify
the -g flag alone. Version 3.1 and later of GCC,
the GNU C compiler, provides macro information if you are using
the DWARF debugging format, and specify the option -g3.
See Options for Debugging Your Program or GCC in Using the GNU Compiler Collection (GCC), for more
information on GCC options affecting debug information.
You will have the best debugging experience if you use the latest
version of the DWARF debugging format that your compiler supports.
DWARF is currently the most expressive and best supported debugging
format in GDB.
4.2 Starting your Program
runr-
Use the
runcommand to start your program under GDB.
You must first specify the program name with an argument to
GDB (see Getting In and Out of
GDB), or by using thefileorexec-file
command (see Commands to Specify Files).
If you are running your program in an execution environment that
supports processes, run creates an inferior process and makes
that process run your program. In some environments without processes,
run jumps to the start of your program. Other targets,
like ‘remote’, are always running. If you get an error
message like this one:
The "remote" target does not support "run". Try "help target" or "continue".
then use continue to run your program. You may need load
first (see load).
The execution of a program is affected by certain information it
receives from its superior. GDB provides ways to specify this
information, which you must do before starting your program. (You
can change it after starting your program, but such changes only affect
your program the next time you start it.) This information may be
divided into four categories:
- The arguments.
-
Specify the arguments to give your program as the arguments of the
runcommand. If a shell is available on your target, the shell
is used to pass the arguments, so that you may use normal conventions
(such as wildcard expansion or variable substitution) in describing
the arguments.
In Unix systems, you can control which shell is used with the
SHELLenvironment variable. If you do not defineSHELL,
GDB uses the default shell (/bin/sh). You can disable
use of any shell with theset startup-with-shellcommand (see
below for details). - The environment.
-
Your program normally inherits its environment from GDB, but you can
use the GDB commandsset environmentandunsetto change parts of the environment that affect
environment
your program. See Your Program’s Environment. - The working directory.
-
You can set your program’s working directory with the command
set cwd. If you do not set any working directory with this
command, your program will inherit GDB’s working directory if
native debugging, or the remote server’s working directory if remote
debugging. See Your Program’s Working
Directory. - The standard input and output.
-
Your program normally uses the same device for standard input and
standard output as GDB is using. You can redirect input and output
in theruncommand line, or you can use thettycommand to
set a different device for your program.
See Your Program’s Input and Output.Warning: While input and output redirection work, you cannot use
pipes to pass the output of the program you are debugging to another
program; if you attempt this, GDB is likely to wind up debugging the
wrong program.
When you issue the run command, your program begins to execute
immediately. See Stopping and Continuing, for discussion
of how to arrange for your program to stop. Once your program has
stopped, you may call functions in your program, using the print
or call commands. See Examining Data.
If the modification time of your symbol file has changed since the last
time GDB read its symbols, GDB discards its symbol
table, and reads it again. When it does this, GDB tries to retain
your current breakpoints.
start-
The name of the main procedure can vary from language to language.
With C or C++, the main procedure name is alwaysmain, but
other languages such as Ada do not require a specific name for their
main procedure. The debugger provides a convenient way to start the
execution of the program and to stop at the beginning of the main
procedure, depending on the language used.The ‘start’ command does the equivalent of setting a temporary
breakpoint at the beginning of the main procedure and then invoking
the ‘run’ command.Some programs contain an elaboration phase where some startup code is
executed before the main procedure is called. This depends on the
languages used to write your program. In C++, for instance,
constructors for static and global objects are executed before
mainis called. It is therefore possible that the debugger stops
before reaching the main procedure. However, the temporary breakpoint
will remain to halt execution.Specify the arguments to give to your program as arguments to the
‘start’ command. These arguments will be given verbatim to the
underlying ‘run’ command. Note that the same arguments will be
reused if no argument is provided during subsequent calls to
‘start’ or ‘run’.It is sometimes necessary to debug the program during elaboration. In
these cases, using thestartcommand would stop the execution
of your program too late, as the program would have already completed
the elaboration phase. Under these circumstances, either insert
breakpoints in your elaboration code before running your program or
use thestarticommand. starti-
The ‘starti’ command does the equivalent of setting a temporary
breakpoint at the first instruction of a program’s execution and then
invoking the ‘run’ command. For programs containing an
elaboration phase, thestarticommand will stop execution at
the start of the elaboration phase. set exec-wrapper wrappershow exec-wrapperunset exec-wrapper-
When ‘exec-wrapper’ is set, the specified wrapper is used to
launch programs for debugging. GDB starts your program
with a shell command of the form exec wrapper
program. Quoting is added to program and its
arguments, but not to wrapper, so you should add quotes if
appropriate for your shell. The wrapper runs until it executes
your program, and then GDB takes control.You can use any program that eventually calls
execvewith
its arguments as a wrapper. Several standard Unix utilities do
this, e.g.envandnohup. Any Unix shell script ending
withexec "$@"will also work.For example, you can use
envto pass an environment variable to
the debugged program, without setting the variable in your shell’s
environment:(gdb) set exec-wrapper env 'LD_PRELOAD=libtest.so' (gdb) run
This command is available when debugging locally on most targets, excluding
DJGPP, Cygwin, MS Windows, and QNX Neutrino. set startup-with-shellset startup-with-shell onset startup-with-shell offshow startup-with-shell-
On Unix systems, by default, if a shell is available on your target,
GDB) uses it to start your program. Arguments of the
runcommand are passed to the shell, which does variable
substitution, expands wildcard characters and performs redirection of
I/O. In some circumstances, it may be useful to disable such use of a
shell, for example, when debugging the shell itself or diagnosing
startup failures such as:(gdb) run Starting program: ./a.out During startup program terminated with signal SIGSEGV, Segmentation fault.
which indicates the shell or the wrapper specified with
‘exec-wrapper’ crashed, not your program. Most often, this is
caused by something odd in your shell’s non-interactive mode
initialization file—such as .cshrc for C-shell,
$.zshenv for the Z shell, or the file specified in the
BASH_ENVenvironment variable for BASH. set auto-connect-native-targetset auto-connect-native-target onset auto-connect-native-target offshow auto-connect-native-target-
By default, if the current inferior is not connected to any target yet
(e.g., withtarget remote), theruncommand starts your
program as a native process under GDB, on your local machine.
If you’re sure you don’t want to debug programs on your local machine,
you can tell GDB to not connect to the native target
automatically with theset auto-connect-native-target off
command.If
on, which is the default, and if the current inferior is not
connected to a target already, theruncommand automaticaly
connects to the native target, if one is available.If
off, and if the current inferior is not connected to a
target already, theruncommand fails with an error:(gdb) run Don't know how to run. Try "help target".
If the current inferior is already connected to a target, GDB
always uses it with theruncommand.In any case, you can explicitly connect to the native target with the
target nativecommand. For example,(gdb) set auto-connect-native-target off (gdb) run Don't know how to run. Try "help target". (gdb) target native (gdb) run Starting program: ./a.out [Inferior 1 (process 10421) exited normally]
In case you connected explicitly to the
nativetarget,
GDB remains connected even if all inferiors exit, ready for
the nextruncommand. Use thedisconnectcommand to
disconnect.Examples of other commands that likewise respect the
auto-connect-native-targetsetting:attach,info,
procinfo os. set disable-randomizationset disable-randomization on-
This option (enabled by default in GDB) will turn off the native
randomization of the virtual address space of the started program. This option
is useful for multiple debugging sessions to make the execution better
reproducible and memory addresses reusable across debugging sessions.This feature is implemented only on certain targets, including GNU/Linux.
On GNU/Linux you can get the same behavior using(gdb) set exec-wrapper setarch `uname -m` -R
set disable-randomization off-
Leave the behavior of the started executable unchanged. Some bugs rear their
ugly heads only when the program is loaded at certain addresses. If your bug
disappears when you run the program under GDB, that might be because
GDB by default disables the address randomization on platforms, such
as GNU/Linux, which do that for stand-alone programs. Use set
disable-randomization off to try to reproduce such elusive bugs.On targets where it is available, virtual address space randomization
protects the programs against certain kinds of security attacks. In these
cases the attacker needs to know the exact location of a concrete executable
code. Randomizing its location makes it impossible to inject jumps misusing
a code at its expected addresses.Prelinking shared libraries provides a startup performance advantage but it
makes addresses in these libraries predictable for privileged processes by
having just unprivileged access at the target system. Reading the shared
library binary gives enough information for assembling the malicious code
misusing it. Still even a prelinked shared library can get loaded at a new
random address just requiring the regular relocation process during the
startup. Shared libraries not already prelinked are always loaded at
a randomly chosen address.Position independent executables (PIE) contain position independent code
similar to the shared libraries and therefore such executables get loaded at
a randomly chosen address upon startup. PIE executables always load even
already prelinked shared libraries at a random address. You can build such
executable usinggcc -fPIE -pie.Heap (malloc storage), stack and custom mmap areas are always placed randomly
(as long as the randomization is enabled). show disable-randomization-
Show the current setting of the explicit disable of the native randomization of
the virtual address space of the started program.
4.3 Your Program’s Arguments
The arguments to your program can be specified by the arguments of the
run command.
They are passed to a shell, which expands wildcard characters and
performs redirection of I/O, and thence to your program. Your
SHELL environment variable (if it exists) specifies what shell
GDB uses. If you do not define SHELL, GDB uses
the default shell (/bin/sh on Unix).
On non-Unix systems, the program is usually invoked directly by
GDB, which emulates I/O redirection via the appropriate system
calls, and the wildcard characters are expanded by the startup code of
the program, not by the shell.
run with no arguments uses the same arguments used by the previous
run, or those set by the set args command.
set args-
Specify the arguments to be used the next time your program is run. If
set argshas no arguments,runexecutes your program
with no arguments. Once you have run your program with arguments,
usingset argsbefore the nextrunis the only way to run
it again without arguments. show args-
Show the arguments to give your program when it is started.
4.4 Your Program’s Environment
The environment consists of a set of environment variables and
their values. Environment variables conventionally record such things as
your user name, your home directory, your terminal type, and your search
path for programs to run. Usually you set up environment variables with
the shell and they are inherited by all the other programs you run. When
debugging, it can be useful to try running your program with a modified
environment without having to start GDB over again.
path directory-
Add directory to the front of the
PATHenvironment variable
(the search path for executables) that will be passed to your program.
The value ofPATHused by GDB does not change.
You may specify several directory names, separated by whitespace or by a
system-dependent separator character (‘:’ on Unix, ‘;’ on
MS-DOS and MS-Windows). If directory is already in the path, it
is moved to the front, so it is searched sooner.You can use the string ‘$cwd’ to refer to whatever is the current
working directory at the time GDB searches the path. If you
use ‘.’ instead, it refers to the directory where you executed the
pathcommand. GDB replaces ‘.’ in the
directory argument (with the current path) before adding
directory to the search path. show paths-
Display the list of search paths for executables (the
PATH
environment variable). show environment [varname]-
Print the value of environment variable varname to be given to
your program when it starts. If you do not supply varname,
print the names and values of all environment variables to be given to
your program. You can abbreviateenvironmentasenv. set environment varname [=value]-
Set environment variable varname to value. The value
changes for your program (and the shell GDB uses to launch
it), not for GDB itself. The value may be any string; the
values of environment variables are just strings, and any
interpretation is supplied by your program itself. The value
parameter is optional; if it is eliminated, the variable is set to a
null value.For example, this command:
tells the debugged program, when subsequently run, that its user is named
‘foo’. (The spaces around ‘=’ are used for clarity here; they
are not actually required.)Note that on Unix systems, GDB runs your program via a shell,
which also inherits the environment set withset environment.
If necessary, you can avoid that by using the ‘env’ program as a
wrapper instead of usingset environment. See set exec-wrapper, for an example doing just that.Environment variables that are set by the user are also transmitted to
gdbserverto be used when starting the remote inferior.
see QEnvironmentHexEncoded. unset environment varname-
Remove variable varname from the environment to be passed to your
program. This is different from ‘set env varname =’;
unset environmentremoves the variable from the environment,
rather than assigning it an empty value.Environment variables that are unset by the user are also unset on
gdbserverwhen starting the remote inferior.
see QEnvironmentUnset.
Warning: On Unix systems, GDB runs your program using
the shell indicated by your SHELL environment variable if it
exists (or /bin/sh if not). If your SHELL variable
names a shell that runs an initialization file when started
non-interactively—such as .cshrc for C-shell, $.zshenv
for the Z shell, or the file specified in the BASH_ENV
environment variable for BASH—any variables you set in that file
affect your program. You may wish to move setting of environment
variables to files that are only run when you sign on, such as
.login or .profile.
4.5 Your Program’s Working Directory
Each time you start your program with run, the inferior will be
initialized with the current working directory specified by the
set cwd command. If no directory has been specified by this
command, then the inferior will inherit GDB’s current working
directory as its working directory if native debugging, or it will
inherit the remote server’s current working directory if remote
debugging.
set cwd [directory]-
Set the inferior’s working directory to directory, which will be
glob-expanded in order to resolve tildes (~). If no
argument has been specified, the command clears the setting and resets
it to an empty state. This setting has no effect on GDB’s
working directory, and it only takes effect the next time you start
the inferior. The ~ in directory is a short for the
home directory, usually pointed to by theHOMEenvironment
variable. On MS-Windows, ifHOMEis not defined, GDB
uses the concatenation ofHOMEDRIVEandHOMEPATHas
fallback.You can also change GDB’s current working directory by using
thecdcommand.
See cd command. show cwd-
Show the inferior’s working directory. If no directory has been
specified by set cwd, then the default inferior’s working
directory is the same as GDB’s working directory. cd [directory]-
Set the GDB working directory to directory. If not
given, directory uses ‘~’.The GDB working directory serves as a default for the
commands that specify files for GDB to operate on.
See Commands to Specify Files.
See set cwd command. pwd-
Print the GDB working directory.
It is generally impossible to find the current working directory of
the process being debugged (since a program can change its directory
during its run). If you work on a system where GDB supports
the info proc command (see Process Information), you can
use the info proc command to find out the
current working directory of the debuggee.
4.6 Your Program’s Input and Output
By default, the program you run under GDB does input and output to
the same terminal that GDB uses. GDB switches the terminal
to its own terminal modes to interact with you, but it records the terminal
modes your program was using and switches back to them when you continue
running your program.
info terminal-
Displays information recorded by GDB about the terminal modes your
program is using.
You can redirect your program’s input and/or output using shell
redirection with the run command. For example,
starts your program, diverting its output to the file outfile.
Another way to specify where your program should do input and output is
with the tty command. This command accepts a file name as
argument, and causes this file to be the default for future run
commands. It also resets the controlling terminal for the child
process, for future run commands. For example,
directs that processes started with subsequent run commands
default to do input and output on the terminal /dev/ttyb and have
that as their controlling terminal.
An explicit redirection in run overrides the tty command’s
effect on the input/output device, but not its effect on the controlling
terminal.
When you use the tty command or redirect input in the run
command, only the input for your program is affected. The input
for GDB still comes from your terminal. tty is an alias
for set inferior-tty.
You can use the show inferior-tty command to tell GDB to
display the name of the terminal that will be used for future runs of your
program.
set inferior-tty [ tty ]-
Set the tty for the program being debugged to tty. Omitting tty
restores the default behavior, which is to use the same terminal as
GDB. show inferior-tty-
Show the current tty for the program being debugged.
4.7 Debugging an Already-running Process
attach process-id-
This command attaches to a running process—one that was started
outside GDB. (info filesshows your active
targets.) The command takes as argument a process ID. The usual way to
find out the process-id of a Unix process is with thepsutility,
or with the ‘jobs -l’ shell command.attachdoes not repeat if you press RET a second time after
executing the command.
To use attach, your program must be running in an environment
which supports processes; for example, attach does not work for
programs on bare-board targets that lack an operating system. You must
also have permission to send the process a signal.
When you use attach, the debugger finds the program running in
the process first by looking in the current working directory, then (if
the program is not found) by using the source file search path
(see Specifying Source Directories). You can also use
the file command to load the program. See Commands to
Specify Files.
If the debugger can determine that the executable file running in the
process it is attaching to does not match the current exec-file loaded
by GDB, the option exec-file-mismatch specifies how to
handle the mismatch. GDB tries to compare the files by
comparing their build IDs (see build ID), if available.
set exec-file-mismatch ‘ask|warn|off’-
Whether to detect mismatch between the current executable file loaded
by GDB and the executable file used to start the process. If
‘ask’, the default, display a warning and ask the user whether to
load the process executable file; if ‘warn’, just display a
warning; if ‘off’, don’t attempt to detect a mismatch.
If the user confirms loading the process executable file, then its symbols
will be loaded as well. show exec-file-mismatch-
Show the current value of
exec-file-mismatch.
The first thing GDB does after arranging to debug the specified
process is to stop it. You can examine and modify an attached process
with all the GDB commands that are ordinarily available when
you start processes with run. You can insert breakpoints; you
can step and continue; you can modify storage. If you would rather the
process continue running, you may use the continue command after
attaching GDB to the process.
detach-
When you have finished debugging the attached process, you can use the
detachcommand to release it from GDB control. Detaching
the process continues its execution. After thedetachcommand,
that process and GDB become completely independent once more, and you
are ready toattachanother process or start one withrun.
detachdoes not repeat if you press RET again after
executing the command.
If you exit GDB while you have an attached process, you detach
that process. If you use the run command, you kill that process.
By default, GDB asks for confirmation if you try to do either of these
things; you can control whether or not you need to confirm by using the
set confirm command (see Optional Warnings and
Messages).
4.8 Killing the Child Process
kill-
Kill the child process in which your program is running under GDB.
This command is useful if you wish to debug a core dump instead of a
running process. GDB ignores any core dump file while your program
is running.
On some operating systems, a program cannot be executed outside GDB
while you have breakpoints set on it inside GDB. You can use the
kill command in this situation to permit running your program
outside the debugger.
The kill command is also useful if you wish to recompile and
relink your program, since on many systems it is impossible to modify an
executable file while it is running in a process. In this case, when you
next type run, GDB notices that the file has changed, and
reads the symbol table again (while trying to preserve your current
breakpoint settings).
4.9 Debugging Multiple Inferiors Connections and Programs
GDB lets you run and debug multiple programs in a single
session. In addition, GDB on some systems may let you run
several programs simultaneously (otherwise you have to exit from one
before starting another). On some systems GDB may even let
you debug several programs simultaneously on different remote systems.
In the most general case, you can have multiple threads of execution
in each of multiple processes, launched from multiple executables,
running on different machines.
GDB represents the state of each program execution with an
object called an inferior. An inferior typically corresponds to
a process, but is more general and applies also to targets that do not
have processes. Inferiors may be created before a process runs, and
may be retained after a process exits. Inferiors have unique
identifiers that are different from process ids. Usually each
inferior will also have its own distinct address space, although some
embedded targets may have several inferiors running in different parts
of a single address space. Each inferior may in turn have multiple
threads running in it.
To find out what inferiors exist at any moment, use info inferiors:
info inferiors-
Print a list of all inferiors currently being managed by GDB.
By default all inferiors are printed, but the argument id…
– a space separated list of inferior numbers – can be used to limit
the display to just the requested inferiors.GDB displays for each inferior (in this order):
- the inferior number assigned by GDB
- the target system’s inferior identifier
- the target connection the inferior is bound to, including the unique
connection number assigned by GDB, and the protocol used by
the connection. - the name of the executable the inferior is running.
An asterisk ‘*’ preceding the GDB inferior number
indicates the current inferior.For example,
(gdb) info inferiors Num Description Connection Executable * 1 process 3401 1 (native) goodbye 2 process 2307 2 (extended-remote host:10000) hello
To get informations about the current inferior, use inferior:
inferior-
Shows information about the current inferior.
For example,
(gdb) inferior [Current inferior is 1 [process 3401] (helloworld)]
To find out what open target connections exist at any moment, use
info connections:
info connections-
Print a list of all open target connections currently being managed by
GDB. By default all connections are printed, but the
argument id… – a space separated list of connections
numbers – can be used to limit the display to just the requested
connections.GDB displays for each connection (in this order):
- the connection number assigned by GDB.
- the protocol used by the connection.
- a textual description of the protocol used by the connection.
An asterisk ‘*’ preceding the connection number indicates the
connection of the current inferior.For example,
(gdb) info connections Num What Description * 1 extended-remote host:10000 Extended remote serial target in gdb-specific protocol 2 native Native process 3 core Local core dump file
To switch focus between inferiors, use the inferior command:
inferior infno-
Make inferior number infno the current inferior. The argument
infno is the inferior number assigned by GDB, as shown
in the first field of the ‘info inferiors’ display.
The debugger convenience variable ‘$_inferior’ contains the
number of the current inferior. You may find this useful in writing
breakpoint conditional expressions, command scripts, and so forth.
See Convenience Variables, for general
information on convenience variables.
You can get multiple executables into a debugging session via the
add-inferior and clone-inferior commands. On some
systems GDB can add inferiors to the debug session
automatically by following calls to fork and exec. To
remove inferiors from the debugging session use the
remove-inferiors command.
add-inferior [ -copies n ] [ -exec executable ] [-no-connection ]-
Adds n inferiors to be run using executable as the
executable; n defaults to 1. If no executable is specified,
the inferiors begins empty, with no program. You can still assign or
change the program assigned to the inferior at any time by using the
filecommand with the executable name as its argument.By default, the new inferior begins connected to the same target
connection as the current inferior. For example, if the current
inferior was connected togdbserverwithtarget remote,
then the new inferior will be connected to the samegdbserver
instance. The ‘-no-connection’ option starts the new inferior
with no connection yet. You can then for example use thetargetcommand to connect to some other
remotegdbserverinstance,
userunto spawn a local program, etc. clone-inferior [ -copies n ] [ infno ]-
Adds n inferiors ready to execute the same program as inferior
infno; n defaults to 1, and infno defaults to the
number of the current inferior. This command copies the values of the
args, inferior-tty and cwd properties from the
current inferior to the new one. It also propagates changes the user
made to environment variables using theset environmentand
unset environmentcommands. This is a convenient command
when you want to run another instance of the inferior you are debugging.(gdb) info inferiors Num Description Connection Executable * 1 process 29964 1 (native) helloworld (gdb) clone-inferior Added inferior 2. 1 inferiors added. (gdb) info inferiors Num Description Connection Executable * 1 process 29964 1 (native) helloworld 2 <null> 1 (native) helloworld
You can now simply switch focus to inferior 2 and run it.
remove-inferiors infno…-
Removes the inferior or inferiors infno…. It is not
possible to remove an inferior that is running with this command. For
those, use thekillordetachcommand first.
To quit debugging one of the running inferiors that is not the current
inferior, you can either detach from it by using the detach inferior command (allowing it to run independently), or kill it
using the kill inferiors command:
detach inferior infno…-
Detach from the inferior or inferiors identified by GDB
inferior number(s) infno…. Note that the inferior’s entry
still stays on the list of inferiors shown byinfo inferiors,
but its Description will show ‘<null>’. kill inferiors infno…-
Kill the inferior or inferiors identified by GDB inferior
number(s) infno…. Note that the inferior’s entry still
stays on the list of inferiors shown byinfo inferiors, but its
Description will show ‘<null>’.
After the successful completion of a command such as detach,
detach inferiors, kill or kill inferiors, or after
a normal process exit, the inferior is still valid and listed with
info inferiors, ready to be restarted.
To be notified when inferiors are started or exit under GDB’s
control use set print inferior-events:
set print inferior-eventsset print inferior-events onset print inferior-events off-
The
set print inferior-eventscommand allows you to enable or
disable printing of messages when GDB notices that new
inferiors have started or that inferiors have exited or have been
detached. By default, these messages will be printed. show print inferior-events-
Show whether messages will be printed when GDB detects that
inferiors have started, exited or have been detached.
Many commands will work the same with multiple programs as with a
single program: e.g., print myglobal will simply display the
value of myglobal in the current inferior.
Occasionally, when debugging GDB itself, it may be useful to
get more info about the relationship of inferiors, programs, address
spaces in a debug session. You can do that with the maint info program-spaces command.
maint info program-spaces-
Print a list of all program spaces currently being managed by
GDB.GDB displays for each program space (in this order):
- the program space number assigned by GDB
- the name of the executable loaded into the program space, with e.g.,
thefilecommand. - the name of the core file loaded into the program space, with e.g.,
thecore-filecommand.
An asterisk ‘*’ preceding the GDB program space number
indicates the current program space.In addition, below each program space line, GDB prints extra
information that isn’t suitable to display in tabular form. For
example, the list of inferiors bound to the program space.(gdb) maint info program-spaces Id Executable Core File * 1 hello 2 goodbye Bound inferiors: ID 1 (process 21561)Here we can see that no inferior is running the program
hello,
whileprocess 21561is running the programgoodbye. On
some targets, it is possible that multiple inferiors are bound to the
same program space. The most common example is that of debugging both
the parent and child processes of avforkcall. For example,(gdb) maint info program-spaces Id Executable Core File * 1 vfork-test Bound inferiors: ID 2 (process 18050), ID 1 (process 18045)Here, both inferior 2 and inferior 1 are running in the same program
space as a result of inferior 1 having executed avforkcall.
4.10 Debugging Programs with Multiple Threads
In some operating systems, such as GNU/Linux and Solaris, a single program
may have more than one thread of execution. The precise semantics
of threads differ from one operating system to another, but in general
the threads of a single program are akin to multiple processes—except
that they share one address space (that is, they can all examine and
modify the same variables). On the other hand, each thread has its own
registers and execution stack, and perhaps private memory.
GDB provides these facilities for debugging multi-thread
programs:
- automatic notification of new threads
- ‘thread thread-id’, a command to switch among threads
- ‘info threads’, a command to inquire about existing threads
- ‘thread apply [thread-id-list | all] args’,
a command to apply a command to a list of threads - thread-specific breakpoints
- ‘set print thread-events’, which controls printing of
messages on thread start and exit. - ‘set libthread-db-search-path path’, which lets
the user specify whichlibthread_dbto use if the default choice
isn’t compatible with the program.
The GDB thread debugging facility allows you to observe all
threads while your program runs—but whenever GDB takes
control, one thread in particular is always the focus of debugging.
This thread is called the current thread. Debugging commands show
program information from the perspective of the current thread.
Whenever GDB detects a new thread in your program, it displays
the target system’s identification for the thread with a message in the
form ‘[New systag]’, where systag is a thread identifier
whose form varies depending on the particular system. For example, on
GNU/Linux, you might see
[New Thread 0x41e02940 (LWP 25582)]
when GDB notices a new thread. In contrast, on other systems,
the systag is simply something like ‘process 368’, with no
further qualifier.
For debugging purposes, GDB associates its own thread number
—always a single integer—with each thread of an inferior. This
number is unique between all threads of an inferior, but not unique
between threads of different inferiors.
You can refer to a given thread in an inferior using the qualified
inferior-num.thread-num syntax, also known as
qualified thread ID, with inferior-num being the inferior
number and thread-num being the thread number of the given
inferior. For example, thread 2.3 refers to thread number 3 of
inferior 2. If you omit inferior-num (e.g., thread 3),
then GDB infers you’re referring to a thread of the current
inferior.
Until you create a second inferior, GDB does not show the
inferior-num part of thread IDs, even though you can always use
the full inferior-num.thread-num form to refer to threads
of inferior 1, the initial inferior.
Some commands accept a space-separated thread ID list as
argument. A list element can be:
- A thread ID as shown in the first field of the ‘info threads’
display, with or without an inferior qualifier. E.g., ‘2.1’ or
‘1’. - A range of thread numbers, again with or without an inferior
qualifier, as in inf.thr1—thr2 or
thr1—thr2. E.g., ‘1.2-4’ or ‘2-4’. - All threads of an inferior, specified with a star wildcard, with or
without an inferior qualifier, as in inf.*(e.g.,
‘1.*’) or*. The former refers to all threads of the
given inferior, and the latter form without an inferior qualifier
refers to all threads of the current inferior.
For example, if the current inferior is 1, and inferior 7 has one
thread with ID 7.1, the thread list ‘1 2-3 4.5 6.7-9 7.*’
includes threads 1 to 3 of inferior 1, thread 5 of inferior 4, threads
7 to 9 of inferior 6 and all threads of inferior 7. That is, in
expanded qualified form, the same as ‘1.1 1.2 1.3 4.5 6.7 6.8 6.9
7.1’.
In addition to a per-inferior number, each thread is also
assigned a unique global number, also known as global
thread ID, a single integer. Unlike the thread number component of
the thread ID, no two threads have the same global ID, even when
you’re debugging multiple inferiors.
From GDB’s perspective, a process always has at least one
thread. In other words, GDB assigns a thread number to the
program’s “main thread” even if the program is not multi-threaded.
The debugger convenience variables ‘$_thread’ and
‘$_gthread’ contain, respectively, the per-inferior thread number
and the global thread number of the current thread. You may find this
useful in writing breakpoint conditional expressions, command scripts,
and so forth. The convenience variable ‘$_inferior_thread_count’
contains the number of live threads in the current inferior.
See Convenience Variables, for general
information on convenience variables.
When running in non-stop mode (see Non-Stop Mode), where new
threads can be created, and existing threads exit, at any time,
‘$_inferior_thread_count’ could return a different value each
time it is evaluated.
If GDB detects the program is multi-threaded, it augments the
usual message about stopping at a breakpoint with the ID and name of
the thread that hit the breakpoint.
Thread 2 "client" hit Breakpoint 1, send_message () at client.c:68
Likewise when the program receives a signal:
Thread 1 "main" received signal SIGINT, Interrupt.
info threads [thread-id-list]-
Display information about one or more threads. With no arguments
displays information about all threads. You can specify the list of
threads that you want to display using the thread ID list syntax
(see thread ID lists).GDB displays for each thread (in this order):
- the per-inferior thread number assigned by GDB
- the global thread number assigned by GDB, if the ‘-gid’
option was specified - the target system’s thread identifier (systag)
- the thread’s name, if one is known. A thread can either be named by
the user (seethread name, below), or, in some cases, by the
program itself. - the current stack frame summary for that thread
An asterisk ‘*’ to the left of the GDB thread number
indicates the current thread.For example,
(gdb) info threads
Id Target Id Frame
* 1 process 35 thread 13 main (argc=1, argv=0x7ffffff8)
2 process 35 thread 23 0x34e5 in sigpause ()
3 process 35 thread 27 0x34e5 in sigpause ()
at threadtest.c:68
If you’re debugging multiple inferiors, GDB displays thread
IDs using the qualified inferior-num.thread-num format.
Otherwise, only thread-num is shown.
If you specify the ‘-gid’ option, GDB displays a column
indicating each thread’s global thread ID:
(gdb) info threads Id GId Target Id Frame 1.1 1 process 35 thread 13 main (argc=1, argv=0x7ffffff8) 1.2 3 process 35 thread 23 0x34e5 in sigpause () 1.3 4 process 35 thread 27 0x34e5 in sigpause () * 2.1 2 process 65 thread 1 main (argc=1, argv=0x7ffffff8)
On Solaris, you can display more information about user threads with a
Solaris-specific command:
maint info sol-threads-
Display info on Solaris user threads.
thread thread-id-
Make thread ID thread-id the current thread. The command
argument thread-id is the GDB thread ID, as shown in
the first field of the ‘info threads’ display, with or without an
inferior qualifier (e.g., ‘2.1’ or ‘1’).GDB responds by displaying the system identifier of the
thread you selected, and its current stack frame summary:(gdb) thread 2 [Switching to thread 2 (Thread 0xb7fdab70 (LWP 12747))] #0 some_function (ignore=0x0) at example.c:8 8 printf ("hellon");As with the ‘[New …]’ message, the form of the text after
‘Switching to’ depends on your system’s conventions for identifying
threads. thread apply [thread-id-list | all [-ascending]] [flag]… command-
The
thread applycommand allows you to apply the named
command to one or more threads. Specify the threads that you
want affected using the thread ID list syntax (see thread ID lists), or specifyallto apply to all threads. To apply a
command to all threads in descending order, type thread apply all
command. To apply a command to all threads in ascending order,
type thread apply all -ascending command.The flag arguments control what output to produce and how to handle
errors raised when applying command to a thread. flag
must start with a-directly followed by one letter in
qcs. If several flags are provided, they must be given
individually, such as-c -q.By default, GDB displays some thread information before the
output produced by command, and an error raised during the
execution of a command will abortthread apply. The
following flags can be used to fine-tune this behavior:-c-
The flag
-c, which stands for ‘continue’, causes any
errors in command to be displayed, and the execution of
thread applythen continues. -s-
The flag
-s, which stands for ‘silent’, causes any errors
or empty output produced by a command to be silently ignored.
That is, the execution continues, but the thread information and errors
are not printed. -q-
The flag
-q(‘quiet’) disables printing the thread
information.
Flags
-cand-scannot be used together. taas [option]… command-
Shortcut for
thread apply all -s [option]… command.
Applies command on all threads, ignoring errors and empty output.The
taascommand accepts the same options as thethreadcommand. See thread apply all.
apply all tfaas [option]… command-
Shortcut for
thread apply all -s -- frame apply all -s [option]… command.
Applies command on all frames of all threads, ignoring errors
and empty output. Note that the flag-sis specified twice:
The first-sensures thatthread applyonly shows the thread
information of the threads for whichframe applyproduces
some output. The second-sis needed to ensure thatframeshows the frame information of a frame only if the
apply
command successfully produced some output.It can for example be used to print a local variable or a function
argument without knowing the thread or frame where this variable or argument
is, using:(gdb) tfaas p some_local_var_i_do_not_remember_where_it_is
The
tfaascommand accepts the same options as theframecommand. See frame apply.
apply thread name [name]-
This command assigns a name to the current thread. If no argument is
given, any existing user-specified name is removed. The thread name
appears in the ‘info threads’ display.On some systems, such as GNU/Linux, GDB is able to
determine the name of the thread as given by the OS. On these
systems, a name specified with ‘thread name’ will override the
system-give name, and removing the user-specified name will cause
GDB to once again display the system-specified name. thread find [regexp]-
Search for and display thread ids whose name or systag
matches the supplied regular expression.As well as being the complement to the ‘thread name’ command,
this command also allows you to identify a thread by its target
systag. For instance, on GNU/Linux, the target systag
is the LWP id.(GDB) thread find 26688 Thread 4 has target id 'Thread 0x41e02940 (LWP 26688)' (GDB) info thread 4 Id Target Id Frame 4 Thread 0x41e02940 (LWP 26688) 0x00000031ca6cd372 in select ()
set print thread-eventsset print thread-events onset print thread-events off-
The
set print thread-eventscommand allows you to enable or
disable printing of messages when GDB notices that new threads have
started or that threads have exited. By default, these messages will
be printed if detection of these events is supported by the target.
Note that these messages cannot be disabled on all targets. show print thread-events-
Show whether messages will be printed when GDB detects that threads
have started and exited.
See Stopping and Starting Multi-thread Programs, for
more information about how GDB behaves when you stop and start
programs with multiple threads.
See Setting Watchpoints, for information about
watchpoints in programs with multiple threads.
set libthread-db-search-path [path]-
If this variable is set, path is a colon-separated list of
directories GDB will use to search forlibthread_db.
If you omit path, ‘libthread-db-search-path’ will be reset to
its default value ($sdir:$pdiron GNU/Linux and Solaris systems).
Internally, the default value comes from theLIBTHREAD_DB_SEARCH_PATH
macro.On GNU/Linux and Solaris systems, GDB uses a “helper”
libthread_dblibrary to obtain information about threads in the
inferior process. GDB will use ‘libthread-db-search-path’
to findlibthread_db. GDB also consults first if inferior
specific thread debugging library loading is enabled
by ‘set auto-load libthread-db’ (see libthread_db.so.1 file).A special entry ‘$sdir’ for ‘libthread-db-search-path’
refers to the default system directories that are
normally searched for loading shared libraries. The ‘$sdir’ entry
is the only kind not needing to be enabled by ‘set auto-load libthread-db’
(see libthread_db.so.1 file).A special entry ‘$pdir’ for ‘libthread-db-search-path’
refers to the directory from whichlibpthread
was loaded in the inferior process.For any
libthread_dblibrary GDB finds in above directories,
GDB attempts to initialize it with the current inferior process.
If this initialization fails (which could happen because of a version
mismatch betweenlibthread_dbandlibpthread), GDB
will unloadlibthread_db, and continue with the next directory.
If none oflibthread_dblibraries initialize successfully,
GDB will issue a warning and thread debugging will be disabled.Setting
libthread-db-search-pathis currently implemented
only on some platforms. show libthread-db-search-path-
Display current libthread_db search path.
set debug libthread-dbshow debug libthread-db-
Turns on or off display of
libthread_db-related events.
Use1to enable,0to disable. set debug threads [on|off]show debug threads-
When ‘on’ GDB will print additional messages when
threads are created and deleted.
4.11 Debugging Forks
On most systems, GDB has no special support for debugging
programs which create additional processes using the fork
function. When a program forks, GDB will continue to debug the
parent process and the child process will run unimpeded. If you have
set a breakpoint in any code which the child then executes, the child
will get a SIGTRAP signal which (unless it catches the signal)
will cause it to terminate.
However, if you want to debug the child process there is a workaround
which isn’t too painful. Put a call to sleep in the code which
the child process executes after the fork. It may be useful to sleep
only if a certain environment variable is set, or a certain file exists,
so that the delay need not occur when you don’t want to run GDB
on the child. While the child is sleeping, use the ps program to
get its process ID. Then tell GDB (a new invocation of
GDB if you are also debugging the parent process) to attach to
the child process (see Attach). From that point on you can debug
the child process just like any other process which you attached to.
On some systems, GDB provides support for debugging programs
that create additional processes using the fork or vfork
functions. On GNU/Linux platforms, this feature is supported
with kernel version 2.5.46 and later.
The fork debugging commands are supported in native mode and when
connected to gdbserver in either target remote mode or
target extended-remote mode.
By default, when a program forks, GDB will continue to debug
the parent process and the child process will run unimpeded.
If you want to follow the child process instead of the parent process,
use the command set follow-fork-mode.
set follow-fork-mode mode-
Set the debugger response to a program call of
forkor
vfork. A call toforkorvforkcreates a new
process. The mode argument can be:parent-
The original process is debugged after a fork. The child process runs
unimpeded. This is the default. child-
The new process is debugged after a fork. The parent process runs
unimpeded.
show follow-fork-mode-
Display the current debugger response to a
forkorvforkcall.
On Linux, if you want to debug both the parent and child processes, use the
command set detach-on-fork.
set detach-on-fork mode-
Tells gdb whether to detach one of the processes after a fork, or
retain debugger control over them both.on-
The child process (or parent process, depending on the value of
follow-fork-mode) will be detached and allowed to run
independently. This is the default. off-
Both processes will be held under the control of GDB.
One process (child or parent, depending on the value of
follow-fork-mode) is debugged as usual, while the other
is held suspended.
show detach-on-fork-
Show whether detach-on-fork mode is on/off.
If you choose to set ‘detach-on-fork’ mode off, then GDB
will retain control of all forked processes (including nested forks).
You can list the forked processes under the control of GDB by
using the info inferiors command, and switch from one fork
to another by using the inferior command (see Debugging Multiple Inferiors Connections and Programs).
To quit debugging one of the forked processes, you can either detach
from it by using the detach inferiors command (allowing it
to run independently), or kill it using the kill inferiors
command. See Debugging
Multiple Inferiors Connections and Programs.
If you ask to debug a child process and a vfork is followed by an
exec, GDB executes the new target up to the first
breakpoint in the new target. If you have a breakpoint set on
main in your original program, the breakpoint will also be set on
the child process’s main.
On some systems, when a child process is spawned by vfork, you
cannot debug the child or parent until an exec call completes.
If you issue a run command to GDB after an exec
call executes, the new target restarts. To restart the parent
process, use the file command with the parent executable name
as its argument. By default, after an exec call executes,
GDB discards the symbols of the previous executable image.
You can change this behaviour with the set follow-exec-mode
command.
set follow-exec-mode mode-
Set debugger response to a program call of
exec. An
execcall replaces the program image of a process.follow-exec-modecan be:new-
GDB creates a new inferior and rebinds the process to this
new inferior. The program the process was running before the
execcall can be restarted afterwards by restarting the
original inferior.For example:
(gdb) info inferiors (gdb) info inferior Id Description Executable * 1 <null> prog1 (gdb) run process 12020 is executing new program: prog2 Program exited normally. (gdb) info inferiors Id Description Executable 1 <null> prog1 * 2 <null> prog2
same-
GDB keeps the process bound to the same inferior. The new
executable image replaces the previous executable loaded in the
inferior. Restarting the inferior after theexeccall, with
e.g., theruncommand, restarts the executable the process was
running after theexeccall. This is the default mode.For example:
(gdb) info inferiors Id Description Executable * 1 <null> prog1 (gdb) run process 12020 is executing new program: prog2 Program exited normally. (gdb) info inferiors Id Description Executable * 1 <null> prog2
follow-exec-mode is supported in native mode and
target extended-remote mode.
You can use the catch command to make GDB stop whenever
a fork, vfork, or exec call is made. See Setting Catchpoints.
4.12 Setting a Bookmark to Return to Later
On certain operating systems4, GDB is able to save a snapshot of a
program’s state, called a checkpoint, and come back to it
later.
Returning to a checkpoint effectively undoes everything that has
happened in the program since the checkpoint was saved. This
includes changes in memory, registers, and even (within some limits)
system state. Effectively, it is like going back in time to the
moment when the checkpoint was saved.
Thus, if you’re stepping thru a program and you think you’re
getting close to the point where things go wrong, you can save
a checkpoint. Then, if you accidentally go too far and miss
the critical statement, instead of having to restart your program
from the beginning, you can just go back to the checkpoint and
start again from there.
This can be especially useful if it takes a lot of time or
steps to reach the point where you think the bug occurs.
To use the checkpoint/restart method of debugging:
checkpoint-
Save a snapshot of the debugged program’s current execution state.
Thecheckpointcommand takes no arguments, but each checkpoint
is assigned a small integer id, similar to a breakpoint id. info checkpoints-
List the checkpoints that have been saved in the current debugging
session. For each checkpoint, the following information will be
listed:Checkpoint IDProcess IDCode AddressSource line, or label
restart checkpoint-id-
Restore the program state that was saved as checkpoint number
checkpoint-id. All program variables, registers, stack frames
etc. will be returned to the values that they had when the checkpoint
was saved. In essence, gdb will “wind back the clock” to the point
in time when the checkpoint was saved.Note that breakpoints, GDB variables, command history etc.
are not affected by restoring a checkpoint. In general, a checkpoint
only restores things that reside in the program being debugged, not in
the debugger. delete checkpoint checkpoint-id-
Delete the previously-saved checkpoint identified by checkpoint-id.
Returning to a previously saved checkpoint will restore the user state
of the program being debugged, plus a significant subset of the system
(OS) state, including file pointers. It won’t “un-write” data from
a file, but it will rewind the file pointer to the previous location,
so that the previously written data can be overwritten. For files
opened in read mode, the pointer will also be restored so that the
previously read data can be read again.
Of course, characters that have been sent to a printer (or other
external device) cannot be “snatched back”, and characters received
from eg. a serial device can be removed from internal program buffers,
but they cannot be “pushed back” into the serial pipeline, ready to
be received again. Similarly, the actual contents of files that have
been changed cannot be restored (at this time).
However, within those constraints, you actually can “rewind” your
program to a previously saved point in time, and begin debugging it
again — and you can change the course of events so as to debug a
different execution path this time.
Finally, there is one bit of internal program state that will be
different when you return to a checkpoint — the program’s process
id. Each checkpoint will have a unique process id (or pid),
and each will be different from the program’s original pid.
If your program has saved a local copy of its process id, this could
potentially pose a problem.
4.12.1 A Non-obvious Benefit of Using Checkpoints
On some systems such as GNU/Linux, address space randomization
is performed on new processes for security reasons. This makes it
difficult or impossible to set a breakpoint, or watchpoint, on an
absolute address if you have to restart the program, since the
absolute location of a symbol will change from one execution to the
next.
A checkpoint, however, is an identical copy of a process.
Therefore if you create a checkpoint at (eg.) the start of main,
and simply return to that checkpoint instead of restarting the
process, you can avoid the effects of address randomization and
your symbols will all stay in the same place.
5 Stopping and Continuing
The principal purposes of using a debugger are so that you can stop your
program before it terminates; or so that, if your program runs into
trouble, you can investigate and find out why.
Inside GDB, your program may stop for any of several reasons,
such as a signal, a breakpoint, or reaching a new line after a
GDB command such as step. You may then examine and
change variables, set new breakpoints or remove old ones, and then
continue execution. Usually, the messages shown by GDB provide
ample explanation of the status of your program—but you can also
explicitly request this information at any time.
info program-
Display information about the status of your program: whether it is
running or not, what process it is, and why it stopped.
5.1 Breakpoints, Watchpoints, and Catchpoints
A breakpoint makes your program stop whenever a certain point in
the program is reached. For each breakpoint, you can add conditions to
control in finer detail whether your program stops. You can set
breakpoints with the break command and its variants (see Setting Breakpoints), to specify the place where your program
should stop by line number, function name or exact address in the
program.
On some systems, you can set breakpoints in shared libraries before
the executable is run.
A watchpoint is a special breakpoint that stops your program
when the value of an expression changes. The expression may be a value
of a variable, or it could involve values of one or more variables
combined by operators, such as ‘a + b’. This is sometimes called
data breakpoints. You must use a different command to set
watchpoints (see Setting Watchpoints), but aside
from that, you can manage a watchpoint like any other breakpoint: you
enable, disable, and delete both breakpoints and watchpoints using the
same commands.
You can arrange to have values from your program displayed automatically
whenever GDB stops at a breakpoint. See Automatic Display.
A catchpoint is another special breakpoint that stops your program
when a certain kind of event occurs, such as the throwing of a C++
exception or the loading of a library. As with watchpoints, you use a
different command to set a catchpoint (see Setting
Catchpoints), but aside from that, you can manage a catchpoint like any
other breakpoint. (To stop when your program receives a signal, use the
handle command; see Signals.)
GDB assigns a number to each breakpoint, watchpoint, or
catchpoint when you create it; these numbers are successive integers
starting with one. In many of the commands for controlling various
features of breakpoints you use the breakpoint number to say which
breakpoint you want to change. Each breakpoint may be enabled or
disabled; if disabled, it has no effect on your program until you
enable it again.
Some GDB commands accept a space-separated list of breakpoints
on which to operate. A list element can be either a single breakpoint number,
like ‘5’, or a range of such numbers, like ‘5-7’.
When a breakpoint list is given to a command, all breakpoints in that list
are operated on.
5.1.1 Setting Breakpoints
Breakpoints are set with the break command (abbreviated
b). The debugger convenience variable ‘$bpnum’ records the
number of the breakpoint you’ve set most recently:
(gdb) b main Breakpoint 1 at 0x11c6: file zeoes.c, line 24. (gdb) p $bpnum $1 = 1
A breakpoint may be mapped to multiple code locations for example with
inlined functions, Ada generics, C++ templates or overloaded function names.
GDB then indicates the number of code locations in the breakpoint
command output:
(gdb) b some_func Breakpoint 2 at 0x1179: some_func. (3 locations) (gdb) p $bpnum $2 = 2 (gdb)
When your program stops on a breakpoint, the convenience variables
‘$_hit_bpnum’ and ‘$_hit_locno’ are respectively set to the number of
the encountered breakpoint and the number of the breakpoint’s code location:
Thread 1 "zeoes" hit Breakpoint 2.1, some_func () at zeoes.c:8
8 printf("some funcn");
(gdb) p $_hit_bpnum
$5 = 2
(gdb) p $_hit_locno
$6 = 1
(gdb)
Note that ‘$_hit_bpnum’ and ‘$bpnum’ are not equivalent:
‘$_hit_bpnum’ is set to the breakpoint number last hit, while
‘$bpnum’ is set to the breakpoint number last set.
If the encountered breakpoint has only one code location, ‘$_hit_locno’
is set to 1:
Breakpoint 1, main (argc=1, argv=0x7fffffffe018) at zeoes.c:24 24 if (argc > 1) (gdb) p $_hit_bpnum $3 = 1 (gdb) p $_hit_locno $4 = 1 (gdb)
The ‘$_hit_bpnum’ and ‘$_hit_locno’ variables can typically be used
in a breakpoint command list.
(see Breakpoint Command Lists). For example, as
part of the breakpoint command list, you can disable completely the
encountered breakpoint using disable $_hit_bpnum or disable the
specific encountered breakpoint location using
disable $_hit_bpnum.$_hit_locno.
If a breakpoint has only one location, ‘$_hit_locno’ is set to 1
and the commands disable $_hit_bpnum and
disable $_hit_bpnum.$_hit_locno both disable the breakpoint.
You can also define aliases to easily disable the last hit location or
last hit breakpoint:
(gdb) alias lld = disable $_hit_bpnum.$_hit_locno (gdb) alias lbd = disable $_hit_bpnum
break locspec-
Set a breakpoint at all the code locations in your program that result
from resolving the given locspec. locspec can specify a
function name, a line number, an address of an instruction, and more.
See Location Specifications, for the various forms of
locspec. The breakpoint will stop your program just before it
executes the instruction at the address of any of the breakpoint’s
code locations.When using source languages that permit overloading of symbols, such
as C++, a function name may refer to more than one symbol, and
thus more than one place to break. See Ambiguous Expressions, for a discussion of that
situation.It is also possible to insert a breakpoint that will stop the program
only if a specific thread (see Thread-Specific Breakpoints)
or a specific task (see Ada Tasks) hits that breakpoint. break-
When called without any arguments,
breaksets a breakpoint at
the next instruction to be executed in the selected stack frame
(see Examining the Stack). In any selected frame but the
innermost, this makes your program stop as soon as control
returns to that frame. This is similar to the effect of a
finishcommand in the frame inside the selected frame—except
thatfinishdoes not leave an active breakpoint. If you use
breakwithout an argument in the innermost frame, GDB stops
the next time it reaches the current location; this may be useful
inside loops.GDB normally ignores breakpoints when it resumes execution, until at
least one instruction has been executed. If it did not do this, you
would be unable to proceed past a breakpoint without first disabling the
breakpoint. This rule applies whether or not the breakpoint already
existed when your program stopped. break … if cond-
Set a breakpoint with condition cond; evaluate the expression
cond each time the breakpoint is reached, and stop only if the
value is nonzero—that is, if cond evaluates as true.
‘…’ stands for one of the possible arguments described
above (or no argument) specifying where to break. See Break Conditions, for more information on breakpoint conditions.The breakpoint may be mapped to multiple locations. If the breakpoint
condition cond is invalid at some but not all of the locations,
the locations for which the condition is invalid are disabled. For
example, GDB reports below that two of the three locations
are disabled.(gdb) break func if a == 10 warning: failed to validate condition at location 0x11ce, disabling: No symbol "a" in current context. warning: failed to validate condition at location 0x11b6, disabling: No symbol "a" in current context. Breakpoint 1 at 0x11b6: func. (3 locations)
Locations that are disabled because of the condition are denoted by an
uppercaseNin the output of theinfo breakpoints
command:(gdb) info breakpoints Num Type Disp Enb Address What 1 breakpoint keep y <MULTIPLE> stop only if a == 10 1.1 N* 0x00000000000011b6 in ... 1.2 y 0x00000000000011c2 in ... 1.3 N* 0x00000000000011ce in ... (*): Breakpoint condition is invalid at this location.If the breakpoint condition cond is invalid in the context of
all the locations of the breakpoint, GDB refuses to
define the breakpoint. For example, if variablefoois an
undefined variable:(gdb) break func if foo No symbol "foo" in current context.
break … -force-condition if cond-
There may be cases where the condition cond is invalid at all
the current locations, but the user knows that it will be valid at a
future location; for example, because of a library load. In such
cases, by using the-force-conditionkeyword before ‘if’,
GDB can be forced to define the breakpoint with the given
condition expression instead of refusing it.(gdb) break func -force-condition if foo warning: failed to validate condition at location 1, disabling: No symbol "foo" in current context. warning: failed to validate condition at location 2, disabling: No symbol "foo" in current context. warning: failed to validate condition at location 3, disabling: No symbol "foo" in current context. Breakpoint 1 at 0x1158: test.c:18. (3 locations)
This causes all the present locations where the breakpoint would
otherwise be inserted, to be disabled, as seen in the example above.
However, if there exist locations at which the condition is valid, the
-force-conditionkeyword has no effect. tbreak args-
Set a breakpoint enabled only for one stop. The args are the
same as for thebreakcommand, and the breakpoint is set in the same
way, but the breakpoint is automatically deleted after the first time your
program stops there. See Disabling Breakpoints. hbreak args-
Set a hardware-assisted breakpoint. The args are the same as for the
breakcommand and the breakpoint is set in the same way, but the
breakpoint requires hardware support and some target hardware may not
have this support. The main purpose of this is EPROM/ROM code
debugging, so you can set a breakpoint at an instruction without
changing the instruction. This can be used with the new trap-generation
provided by SPARClite DSU and most x86-based targets. These targets
will generate traps when a program accesses some data or instruction
address that is assigned to the debug registers. However the hardware
breakpoint registers can take a limited number of breakpoints. For
example, on the DSU, only two data breakpoints can be set at a time, and
GDB will reject this command if more than two are used. Delete
or disable unused hardware breakpoints before setting new ones
(see Disabling Breakpoints).
See Break Conditions.
For remote targets, you can restrict the number of hardware
breakpoints GDB will use, see set remote hardware-breakpoint-limit. thbreak args-
Set a hardware-assisted breakpoint enabled only for one stop. The args
are the same as for thehbreakcommand and the breakpoint is set in
the same way. However, like thetbreakcommand,
the breakpoint is automatically deleted after the
first time your program stops there. Also, like thehbreak
command, the breakpoint requires hardware support and some target hardware
may not have this support. See Disabling Breakpoints.
See also Break Conditions. rbreak regex-
Set breakpoints on all functions matching the regular expression
regex. This command sets an unconditional breakpoint on all
matches, printing a list of all breakpoints it set. Once these
breakpoints are set, they are treated just like the breakpoints set with
thebreakcommand. You can delete them, disable them, or make
them conditional the same way as any other breakpoint.In programs using different languages, GDB chooses the syntax
to print the list of all breakpoints it sets according to the
‘set language’ value: using ‘set language auto’
(see Set Language Automatically) means to use the
language of the breakpoint’s function, other values mean to use
the manually specified language (see Set Language Manually).The syntax of the regular expression is the standard one used with tools
like grep. Note that this is different from the syntax used by
shells, so for instancefoo*matches all functions that include
anfofollowed by zero or moreos. There is an implicit
.*leading and trailing the regular expression you supply, so to
match only functions that begin withfoo, use^foo.When debugging C++ programs,
rbreakis useful for setting
breakpoints on overloaded functions that are not members of any special
classes.The
rbreakcommand can be used to set breakpoints in
all the functions in a program, like this: rbreak file:regex-
If
rbreakis called with a filename qualification, it limits
the search for functions matching the given regular expression to the
specified file. This can be used, for example, to set breakpoints on
every function in a given file:The colon separating the filename qualifier from the regex may
optionally be surrounded by spaces. info breakpoints [list…]info break [list…]-
Print a table of all breakpoints, watchpoints, and catchpoints set and
not deleted. Optional argument n means print information only
about the specified breakpoint(s) (or watchpoint(s) or catchpoint(s)).
For each breakpoint, following columns are printed:- Breakpoint Numbers
- Type
-
Breakpoint, watchpoint, or catchpoint.
- Disposition
-
Whether the breakpoint is marked to be disabled or deleted when hit.
- Enabled or Disabled
-
Enabled breakpoints are marked with ‘y’. ‘n’ marks breakpoints
that are not enabled. - Address
-
Where the breakpoint is in your program, as a memory address. For a
pending breakpoint whose address is not yet known, this field will
contain ‘<PENDING>’. Such breakpoint won’t fire until a shared
library that has the symbol or line referred by breakpoint is loaded.
See below for details. A breakpoint with several locations will
have ‘<MULTIPLE>’ in this field—see below for details. - What
-
Where the breakpoint is in the source for your program, as a file and
line number. For a pending breakpoint, the original string passed to
the breakpoint command will be listed as it cannot be resolved until
the appropriate shared library is loaded in the future.
If a breakpoint is conditional, there are two evaluation modes: “host” and
“target”. If mode is “host”, breakpoint condition evaluation is done by
GDB on the host’s side. If it is “target”, then the condition
is evaluated by the target. Theinfo breakcommand shows
the condition on the line following the affected breakpoint, together with
its condition evaluation mode in between parentheses.Breakpoint commands, if any, are listed after that. A pending breakpoint is
allowed to have a condition specified for it. The condition is not parsed for
validity until a shared library is loaded that allows the pending
breakpoint to resolve to a valid location.info breakwith a breakpoint
number n as argument lists only that breakpoint. The
convenience variable$_and the default examining-address for
thexcommand are set to the address of the last breakpoint
listed (see Examining Memory).info breakdisplays a count of the number of times the breakpoint
has been hit. This is especially useful in conjunction with the
ignorecommand. You can ignore a large number of breakpoint
hits, look at the breakpoint info to see how many times the breakpoint
was hit, and then run again, ignoring one less than that number. This
will get you quickly to the last hit of that breakpoint.For a breakpoints with an enable count (xref) greater than 1,
info breakalso displays that count.
GDB allows you to set any number of breakpoints at the same place in
your program. There is nothing silly or meaningless about this. When
the breakpoints are conditional, this is even useful
(see Break Conditions).
It is possible that a single logical breakpoint is set at several code
locations in your program. See Location Specifications, for
examples.
A breakpoint with multiple code locations is displayed in the
breakpoint table using several rows—one header row, followed by one
row for each code location. The header row has ‘<MULTIPLE>’ in
the address column. Each code location row contains the actual
address, source file, source line and function of its code location.
The number column for a code location is of the form
breakpoint-number.location-number.
For example:
Num Type Disp Enb Address What
1 breakpoint keep y <MULTIPLE>
stop only if i==1
breakpoint already hit 1 time
1.1 y 0x080486a2 in void foo<int>() at t.cc:8
1.2 y 0x080486ca in void foo<double>() at t.cc:8
You cannot delete the individual locations from a breakpoint. However,
each location can be individually enabled or disabled by passing
breakpoint-number.location-number as argument to the
enable and disable commands. It’s also possible to
enable and disable a range of location-number
locations using a breakpoint-number and two location-numbers,
in increasing order, separated by a hyphen, like
breakpoint-number.location-number1-location-number2,
in which case GDB acts on all the locations in the range (inclusive).
Disabling or enabling the parent breakpoint (see Disabling) affects
all of the locations that belong to that breakpoint.
Locations that are enabled while their parent breakpoint is disabled
won’t trigger a break, and are denoted by y- in the Enb
column. For example:
(gdb) info breakpoints Num Type Disp Enb Address What 1 breakpoint keep n <MULTIPLE> 1.1 y- 0x00000000000011b6 in ... 1.2 y- 0x00000000000011c2 in ... 1.3 n 0x00000000000011ce in ...
It’s quite common to have a breakpoint inside a shared library.
Shared libraries can be loaded and unloaded explicitly,
and possibly repeatedly, as the program is executed. To support
this use case, GDB updates breakpoint locations whenever
any shared library is loaded or unloaded. Typically, you would
set a breakpoint in a shared library at the beginning of your
debugging session, when the library is not loaded, and when the
symbols from the library are not available. When you try to set
breakpoint, GDB will ask you if you want to set
a so called pending breakpoint—breakpoint whose address
is not yet resolved.
After the program is run, whenever a new shared library is loaded,
GDB reevaluates all the breakpoints. When a newly loaded
shared library contains the symbol or line referred to by some
pending breakpoint, that breakpoint is resolved and becomes an
ordinary breakpoint. When a library is unloaded, all breakpoints
that refer to its symbols or source lines become pending again.
This logic works for breakpoints with multiple locations, too. For
example, if you have a breakpoint in a C++ template function, and
a newly loaded shared library has an instantiation of that template,
a new location is added to the list of locations for the breakpoint.
Except for having unresolved address, pending breakpoints do not
differ from regular breakpoints. You can set conditions or commands,
enable and disable them and perform other breakpoint operations.
GDB provides some additional commands for controlling what
happens when the ‘break’ command cannot resolve the location spec
to any code location in your program (see Location Specifications):
set breakpoint pending auto-
This is the default behavior. When GDB cannot resolve the
location spec, it queries you whether a pending breakpoint should be
created. set breakpoint pending on-
This indicates that when GDB cannot resolve the location
spec, it should create a pending breakpoint without confirmation. set breakpoint pending off-
This indicates that pending breakpoints are not to be created. If
GDB cannot resolve the location spec, it aborts the
breakpoint creation with an error. This setting does not affect any
pending breakpoints previously created. show breakpoint pending-
Show the current behavior setting for creating pending breakpoints.
The settings above only affect the break command and its
variants. Once a breakpoint is set, it will be automatically updated
as shared libraries are loaded and unloaded.
For some targets, GDB can automatically decide if hardware or
software breakpoints should be used, depending on whether the
breakpoint address is read-only or read-write. This applies to
breakpoints set with the break command as well as to internal
breakpoints set by commands like next and finish. For
breakpoints set with hbreak, GDB will always use hardware
breakpoints.
You can control this automatic behaviour with the following commands:
set breakpoint auto-hw on-
This is the default behavior. When GDB sets a breakpoint, it
will try to use the target memory map to decide if software or hardware
breakpoint must be used. set breakpoint auto-hw off-
This indicates GDB should not automatically select breakpoint
type. If the target provides a memory map, GDB will warn when
trying to set software breakpoint at a read-only address.
GDB normally implements breakpoints by replacing the program code
at the breakpoint address with a special instruction, which, when
executed, given control to the debugger. By default, the program
code is so modified only when the program is resumed. As soon as
the program stops, GDB restores the original instructions. This
behaviour guards against leaving breakpoints inserted in the
target should gdb abrubptly disconnect. However, with slow remote
targets, inserting and removing breakpoint can reduce the performance.
This behavior can be controlled with the following commands::
set breakpoint always-inserted off-
All breakpoints, including newly added by the user, are inserted in
the target only when the target is resumed. All breakpoints are
removed from the target when it stops. This is the default mode. set breakpoint always-inserted on-
Causes all breakpoints to be inserted in the target at all times. If
the user adds a new breakpoint, or changes an existing breakpoint, the
breakpoints in the target are updated immediately. A breakpoint is
removed from the target only when breakpoint itself is deleted.
GDB handles conditional breakpoints by evaluating these conditions
when a breakpoint breaks. If the condition is true, then the process being
debugged stops, otherwise the process is resumed.
If the target supports evaluating conditions on its end, GDB may
download the breakpoint, together with its conditions, to it.
This feature can be controlled via the following commands:
set breakpoint condition-evaluation host-
This option commands GDB to evaluate the breakpoint
conditions on the host’s side. Unconditional breakpoints are sent to
the target which in turn receives the triggers and reports them back to GDB
for condition evaluation. This is the standard evaluation mode. set breakpoint condition-evaluation target-
This option commands GDB to download breakpoint conditions
to the target at the moment of their insertion. The target
is responsible for evaluating the conditional expression and reporting
breakpoint stop events back to GDB whenever the condition
is true. Due to limitations of target-side evaluation, some conditions
cannot be evaluated there, e.g., conditions that depend on local data
that is only known to the host. Examples include
conditional expressions involving convenience variables, complex types
that cannot be handled by the agent expression parser and expressions
that are too long to be sent over to the target, specially when the
target is a remote system. In these cases, the conditions will be
evaluated by GDB. set breakpoint condition-evaluation auto-
This is the default mode. If the target supports evaluating breakpoint
conditions on its end, GDB will download breakpoint conditions to
the target (limitations mentioned previously apply). If the target does
not support breakpoint condition evaluation, then GDB will fallback
to evaluating all these conditions on the host’s side.
GDB itself sometimes sets breakpoints in your program for
special purposes, such as proper handling of longjmp (in C
programs). These internal breakpoints are assigned negative numbers,
starting with -1; ‘info breakpoints’ does not display them.
You can see these breakpoints with the GDB maintenance command
‘maint info breakpoints’ (see maint info breakpoints).
5.1.2 Setting Watchpoints
You can use a watchpoint to stop execution whenever the value of an
expression changes, without having to predict a particular place where
this may happen. (This is sometimes called a data breakpoint.)
The expression may be as simple as the value of a single variable, or
as complex as many variables combined by operators. Examples include:
- A reference to the value of a single variable.
- An address cast to an appropriate data type. For example,
‘*(int *)0x12345678’ will watch a 4-byte region at the specified
address (assuming anintoccupies 4 bytes). - An arbitrarily complex expression, such as ‘a*b + c/d’. The
expression can use any operators valid in the program’s native
language (see Languages).
You can set a watchpoint on an expression even if the expression can
not be evaluated yet. For instance, you can set a watchpoint on
‘*global_ptr’ before ‘global_ptr’ is initialized.
GDB will stop when your program sets ‘global_ptr’ and
the expression produces a valid value. If the expression becomes
valid in some other way than changing a variable (e.g. if the memory
pointed to by ‘*global_ptr’ becomes readable as the result of a
malloc call), GDB may not stop until the next time
the expression changes.
Depending on your system, watchpoints may be implemented in software or
hardware. GDB does software watchpointing by single-stepping your
program and testing the variable’s value each time, which is hundreds of
times slower than normal execution. (But this may still be worth it, to
catch errors where you have no clue what part of your program is the
culprit.)
On some systems, such as most PowerPC or x86-based targets,
GDB includes support for hardware watchpoints, which do not
slow down the running of your program.
watch [-l|-location] expr [thread thread-id] [mask maskvalue] [task task-id]-
Set a watchpoint for an expression. GDB will break when the
expression expr is written into by the program and its value
changes. The simplest (and the most popular) use of this command is
to watch the value of a single variable:If the command includes a
[thread thread-id]
argument, GDB breaks only when the thread identified by
thread-id changes the value of expr. If any other threads
change the value of expr, GDB will not break. Note
that watchpoints restricted to a single thread in this way only work
with Hardware Watchpoints.Similarly, if the
taskargument is given, then the watchpoint
will be specific to the indicated Ada task (see Ada Tasks).Ordinarily a watchpoint respects the scope of variables in expr
(see below). The-locationargument tells GDB to
instead watch the memory referred to by expr. In this case,
GDB will evaluate expr, take the address of the result,
and watch the memory at that address. The type of the result is used
to determine the size of the watched memory. If the expression’s
result does not have an address, then GDB will print an
error.The
[mask maskvalue]argument allows creation
of masked watchpoints, if the current architecture supports this
feature (e.g., PowerPC Embedded architecture, see PowerPC Embedded.) A masked watchpoint specifies a mask in addition
to an address to watch. The mask specifies that some bits of an address
(the bits which are reset in the mask) should be ignored when matching
the address accessed by the inferior against the watchpoint address.
Thus, a masked watchpoint watches many addresses simultaneously—those
addresses whose unmasked bits are identical to the unmasked bits in the
watchpoint address. Themaskargument implies-location.
Examples:(gdb) watch foo mask 0xffff00ff (gdb) watch *0xdeadbeef mask 0xffffff00
rwatch [-l|-location] expr [thread thread-id] [mask maskvalue]-
Set a watchpoint that will break when the value of expr is read
by the program. awatch [-l|-location] expr [thread thread-id] [mask maskvalue]-
Set a watchpoint that will break when expr is either read from
or written into by the program. info watchpoints [list…]-
This command prints a list of watchpoints, using the same format as
info break(see Set Breaks).
If you watch for a change in a numerically entered address you need to
dereference it, as the address itself is just a constant number which will
never change. GDB refuses to create a watchpoint that watches
a never-changing value:
(gdb) watch 0x600850 Cannot watch constant value 0x600850. (gdb) watch *(int *) 0x600850 Watchpoint 1: *(int *) 6293584
GDB sets a hardware watchpoint if possible. Hardware
watchpoints execute very quickly, and the debugger reports a change in
value at the exact instruction where the change occurs. If GDB
cannot set a hardware watchpoint, it sets a software watchpoint, which
executes more slowly and reports the change in value at the next
statement, not the instruction, after the change occurs.
You can force GDB to use only software watchpoints with the
set can-use-hw-watchpoints 0 command. With this variable set to
zero, GDB will never try to use hardware watchpoints, even if
the underlying system supports them. (Note that hardware-assisted
watchpoints that were set before setting
can-use-hw-watchpoints to zero will still use the hardware
mechanism of watching expression values.)
set can-use-hw-watchpoints-
Set whether or not to use hardware watchpoints.
show can-use-hw-watchpoints-
Show the current mode of using hardware watchpoints.
For remote targets, you can restrict the number of hardware
watchpoints GDB will use, see set remote hardware-breakpoint-limit.
When you issue the watch command, GDB reports
Hardware watchpoint num: expr
if it was able to set a hardware watchpoint.
Currently, the awatch and rwatch commands can only set
hardware watchpoints, because accesses to data that don’t change the
value of the watched expression cannot be detected without examining
every instruction as it is being executed, and GDB does not do
that currently. If GDB finds that it is unable to set a
hardware breakpoint with the awatch or rwatch command, it
will print a message like this:
Expression cannot be implemented with read/access watchpoint.
Sometimes, GDB cannot set a hardware watchpoint because the
data type of the watched expression is wider than what a hardware
watchpoint on the target machine can handle. For example, some systems
can only watch regions that are up to 4 bytes wide; on such systems you
cannot set hardware watchpoints for an expression that yields a
double-precision floating-point number (which is typically 8 bytes
wide). As a work-around, it might be possible to break the large region
into a series of smaller ones and watch them with separate watchpoints.
If you set too many hardware watchpoints, GDB might be unable
to insert all of them when you resume the execution of your program.
Since the precise number of active watchpoints is unknown until such
time as the program is about to be resumed, GDB might not be
able to warn you about this when you set the watchpoints, and the
warning will be printed only when the program is resumed:
Hardware watchpoint num: Could not insert watchpoint
If this happens, delete or disable some of the watchpoints.
Watching complex expressions that reference many variables can also
exhaust the resources available for hardware-assisted watchpoints.
That’s because GDB needs to watch every variable in the
expression with separately allocated resources.
If you call a function interactively using print or call,
any watchpoints you have set will be inactive until GDB reaches another
kind of breakpoint or the call completes.
GDB automatically deletes watchpoints that watch local
(automatic) variables, or expressions that involve such variables, when
they go out of scope, that is, when the execution leaves the block in
which these variables were defined. In particular, when the program
being debugged terminates, all local variables go out of scope,
and so only watchpoints that watch global variables remain set. If you
rerun the program, you will need to set all such watchpoints again. One
way of doing that would be to set a code breakpoint at the entry to the
main function and when it breaks, set all the watchpoints.
In multi-threaded programs, watchpoints will detect changes to the
watched expression from every thread.
Warning: In multi-threaded programs, software watchpoints
have only limited usefulness. If GDB creates a software
watchpoint, it can only watch the value of an expression in a
single thread. If you are confident that the expression can only
change due to the current thread’s activity (and if you are also
confident that no other thread can become current), then you can use
software watchpoints as usual. However, GDB may not notice
when a non-current thread’s activity changes the expression. (Hardware
watchpoints, in contrast, watch an expression in all threads.)
See set remote hardware-watchpoint-limit.
5.1.3 Setting Catchpoints
You can use catchpoints to cause the debugger to stop for certain
kinds of program events, such as C++ exceptions or the loading of a
shared library. Use the catch command to set a catchpoint.
catch event-
Stop when event occurs. The event can be any of the following:
throw [regexp]rethrow [regexp]catch [regexp]-
The throwing, re-throwing, or catching of a C++ exception.
If regexp is given, then only exceptions whose type matches the
regular expression will be caught.The convenience variable
$_exceptionis available at an
exception-related catchpoint, on some systems. This holds the
exception being thrown.There are currently some limitations to C++ exception handling in
GDB:- The support for these commands is system-dependent. Currently, only
systems using the ‘gnu-v3’ C++ ABI (see ABI) are
supported. - The regular expression feature and the
$_exceptionconvenience
variable rely on the presence of some SDT probes inlibstdc++.
If these probes are not present, then these features cannot be used.
These probes were first available in the GCC 4.8 release, but whether
or not they are available in your GCC also depends on how it was
built. - The
$_exceptionconvenience variable is only valid at the
instruction at which an exception-related catchpoint is set. - When an exception-related catchpoint is hit, GDB stops at a
location in the system library which implements runtime exception
support for C++, usuallylibstdc++. You can useup
(see Selection) to get to your code. - If you call a function interactively, GDB normally returns
control to you when the function has finished executing. If the call
raises an exception, however, the call may bypass the mechanism that
returns control to you and cause your program either to abort or to
simply continue running until it hits a breakpoint, catches a signal
that GDB is listening for, or exits. This is the case even if
you set a catchpoint for the exception; catchpoints on exceptions are
disabled within interactive calls. See Calling, for information on
controlling this withset unwind-on-terminating-exception. - You cannot raise an exception interactively.
- You cannot install an exception handler interactively.
- The support for these commands is system-dependent. Currently, only
exception [name]-
An Ada exception being raised. If an exception name is specified
at the end of the command (egcatch exception Program_Error),
the debugger will stop only when this specific exception is raised.
Otherwise, the debugger stops execution when any Ada exception is raised.When inserting an exception catchpoint on a user-defined exception whose
name is identical to one of the exceptions defined by the language, the
fully qualified name must be used as the exception name. Otherwise,
GDB will assume that it should stop on the pre-defined exception
rather than the user-defined one. For instance, assuming an exception
calledConstraint_Erroris defined in packagePck, then
the command to use to catch such exceptions is catch exception
Pck.Constraint_Error.The convenience variable
$_ada_exceptionholds the address of
the exception being thrown. This can be useful when setting a
condition for such a catchpoint. exception unhandled-
An exception that was raised but is not handled by the program. The
convenience variable$_ada_exceptionis set as forcatch.
exception handlers [name]-
An Ada exception being handled. If an exception name is
specified at the end of the command
(eg catch handlers Program_Error), the debugger will stop
only when this specific exception is handled.
Otherwise, the debugger stops execution when any Ada exception is handled.When inserting a handlers catchpoint on a user-defined
exception whose name is identical to one of the exceptions
defined by the language, the fully qualified name must be used
as the exception name. Otherwise, GDB will assume that it
should stop on the pre-defined exception rather than the
user-defined one. For instance, assuming an exception called
Constraint_Erroris defined in packagePck, then the
command to use to catch such exceptions handling is
catch handlers Pck.Constraint_Error.The convenience variable
$_ada_exceptionis set as for
catch exception. assert-
A failed Ada assertion. Note that the convenience variable
$_ada_exceptionis not set by this catchpoint. exec-
A call to
exec. syscallsyscall [name | number | group:groupname | g:groupname] …-
A call to or return from a system call, a.k.a. syscall. A
syscall is a mechanism for application programs to request a service
from the operating system (OS) or one of the OS system services.
GDB can catch some or all of the syscalls issued by the
debuggee, and show the related information for each syscall. If no
argument is specified, calls to and returns from all system calls
will be caught.name can be any system call name that is valid for the
underlying OS. Just what syscalls are valid depends on the OS. On
GNU and Unix systems, you can find the full list of valid syscall
names on /usr/include/asm/unistd.h.Normally, GDB knows in advance which syscalls are valid for
each OS, so you can use the GDB command-line completion
facilities (see command completion) to list the
available choices.You may also specify the system call numerically. A syscall’s
number is the value passed to the OS’s syscall dispatcher to
identify the requested service. When you specify the syscall by its
name, GDB uses its database of syscalls to convert the name
into the corresponding numeric code, but using the number directly
may be useful if GDB’s database does not have the complete
list of syscalls on your system (e.g., because GDB lags
behind the OS upgrades).You may specify a group of related syscalls to be caught at once using
thegroup:syntax (g:is a shorter equivalent). For
instance, on some platforms GDB allows you to catch all
network related syscalls, by passing the argumentgroup:network
tocatch syscall. Note that not all syscall groups are
available in every system. You can use the command completion
facilities (see command completion) to list the
syscall groups available on your environment.The example below illustrates how this command works if you don’t provide
arguments to it:(gdb) catch syscall Catchpoint 1 (syscall) (gdb) r Starting program: /tmp/catch-syscall Catchpoint 1 (call to syscall 'close'), 0xffffe424 in __kernel_vsyscall () (gdb) c Continuing. Catchpoint 1 (returned from syscall 'close'), 0xffffe424 in __kernel_vsyscall () (gdb)
Here is an example of catching a system call by name:
(gdb) catch syscall chroot Catchpoint 1 (syscall 'chroot' [61]) (gdb) r Starting program: /tmp/catch-syscall Catchpoint 1 (call to syscall 'chroot'), 0xffffe424 in __kernel_vsyscall () (gdb) c Continuing. Catchpoint 1 (returned from syscall 'chroot'), 0xffffe424 in __kernel_vsyscall () (gdb)
An example of specifying a system call numerically. In the case
below, the syscall number has a corresponding entry in the XML
file, so GDB finds its name and prints it:(gdb) catch syscall 252 Catchpoint 1 (syscall(s) 'exit_group') (gdb) r Starting program: /tmp/catch-syscall Catchpoint 1 (call to syscall 'exit_group'), 0xffffe424 in __kernel_vsyscall () (gdb) c Continuing. Program exited normally. (gdb)
Here is an example of catching a syscall group:
(gdb) catch syscall group:process Catchpoint 1 (syscalls 'exit' [1] 'fork' [2] 'waitpid' [7] 'execve' [11] 'wait4' [114] 'clone' [120] 'vfork' [190] 'exit_group' [252] 'waitid' [284] 'unshare' [310]) (gdb) r Starting program: /tmp/catch-syscall Catchpoint 1 (call to syscall fork), 0x00007ffff7df4e27 in open64 () from /lib64/ld-linux-x86-64.so.2 (gdb) c Continuing.
However, there can be situations when there is no corresponding name
in XML file for that syscall number. In this case, GDB prints
a warning message saying that it was not able to find the syscall name,
but the catchpoint will be set anyway. See the example below:(gdb) catch syscall 764 warning: The number '764' does not represent a known syscall. Catchpoint 2 (syscall 764) (gdb)
If you configure GDB using the ‘—without-expat’ option,
it will not be able to display syscall names. Also, if your
architecture does not have an XML file describing its system calls,
you will not be able to see the syscall names. It is important to
notice that these two features are used for accessing the syscall
name database. In either case, you will see a warning like this:(gdb) catch syscall warning: Could not open "syscalls/i386-linux.xml" warning: Could not load the syscall XML file 'syscalls/i386-linux.xml'. GDB will not be able to display syscall names. Catchpoint 1 (syscall) (gdb)
Of course, the file name will change depending on your architecture and system.
Still using the example above, you can also try to catch a syscall by its
number. In this case, you would see something like:(gdb) catch syscall 252 Catchpoint 1 (syscall(s) 252)
Again, in this case GDB would not be able to display syscall’s names.
fork-
A call to
fork. vfork-
A call to
vfork. load [regexp]unload [regexp]-
The loading or unloading of a shared library. If regexp is
given, then the catchpoint will stop only if the regular expression
matches one of the affected libraries. signal [signal… | ‘all’]-
The delivery of a signal.
With no arguments, this catchpoint will catch any signal that is not
used internally by GDB, specifically, all signals except
‘SIGTRAP’ and ‘SIGINT’.With the argument ‘all’, all signals, including those used by
GDB, will be caught. This argument cannot be used with other
signal names.Otherwise, the arguments are a list of signal names as given to
handle(see Signals). Only signals specified in this list
will be caught.One reason that
catch signalcan be more useful than
handleis that you can attach commands and conditions to the
catchpoint.When a signal is caught by a catchpoint, the signal’s
stopand
printsettings, as specified byhandle, are ignored.
However, whether the signal is still delivered to the inferior depends
on thepasssetting; this can be changed in the catchpoint’s
commands.
tcatch event-
Set a catchpoint that is enabled only for one stop. The catchpoint is
automatically deleted after the first time the event is caught.
Use the info break command to list the current catchpoints.
5.1.4 Deleting Breakpoints
It is often necessary to eliminate a breakpoint, watchpoint, or
catchpoint once it has done its job and you no longer want your program
to stop there. This is called deleting the breakpoint. A
breakpoint that has been deleted no longer exists; it is forgotten.
With the clear command you can delete breakpoints according to
where they are in your program. With the delete command you can
delete individual breakpoints, watchpoints, or catchpoints by specifying
their breakpoint numbers.
It is not necessary to delete a breakpoint to proceed past it. GDB
automatically ignores breakpoints on the first instruction to be executed
when you continue execution without changing the execution address.
clear-
Delete any breakpoints at the next instruction to be executed in the
selected stack frame (see Selecting a Frame). When
the innermost frame is selected, this is a good way to delete a
breakpoint where your program just stopped. clear locspec-
Delete any breakpoint with a code location that corresponds to
locspec. See Location Specifications, for the various forms
of locspec. Which code locations correspond to locspec
depends on the form used in the location specification locspec:linenumfilename:linenum-line linenum-source filename -line linenum-
If locspec specifies a line number, with or without a file name,
the command deletes any breakpoint with a code location that is at or
within the specified line linenum in files that match the
specified filename. If filename is omitted, it defaults
to the current source file. *address-
If locspec specifies an address, the command deletes any
breakpoint with a code location that is at the given address. function-function function-
If locspec specifies a function, the command deletes any
breakpoint with a code location that is at the entry to any function
whose name matches function.
Ambiguity in names of files and functions can be resolved as described
in Location Specifications. delete [breakpoints] [list…]-
Delete the breakpoints, watchpoints, or catchpoints of the breakpoint
list specified as argument. If no argument is specified, delete all
breakpoints (GDB asks confirmation, unless you haveset). You can abbreviate this command as
confirm offd.
5.1.5 Disabling Breakpoints
Rather than deleting a breakpoint, watchpoint, or catchpoint, you might
prefer to disable it. This makes the breakpoint inoperative as if
it had been deleted, but remembers the information on the breakpoint so
that you can enable it again later.
You disable and enable breakpoints, watchpoints, and catchpoints with
the enable and disable commands, optionally specifying
one or more breakpoint numbers as arguments. Use info break to
print a list of all breakpoints, watchpoints, and catchpoints if you
do not know which numbers to use.
Disabling and enabling a breakpoint that has multiple locations
affects all of its locations.
A breakpoint, watchpoint, or catchpoint can have any of several
different states of enablement:
- Enabled. The breakpoint stops your program. A breakpoint set
with thebreakcommand starts out in this state. - Disabled. The breakpoint has no effect on your program.
- Enabled once. The breakpoint stops your program, but then becomes
disabled. - Enabled for a count. The breakpoint stops your program for the next
N times, then becomes disabled. - Enabled for deletion. The breakpoint stops your program, but
immediately after it does so it is deleted permanently. A breakpoint
set with thetbreakcommand starts out in this state.
You can use the following commands to enable or disable breakpoints,
watchpoints, and catchpoints:
disable [breakpoints] [list…]-
Disable the specified breakpoints—or all breakpoints, if none are
listed. A disabled breakpoint has no effect but is not forgotten. All
options such as ignore-counts, conditions and commands are remembered in
case the breakpoint is enabled again later. You may abbreviate
disableasdis. enable [breakpoints] [list…]-
Enable the specified breakpoints (or all defined breakpoints). They
become effective once again in stopping your program. enable [breakpoints] once list…-
Enable the specified breakpoints temporarily. GDB disables any
of these breakpoints immediately after stopping your program. enable [breakpoints] count count list…-
Enable the specified breakpoints temporarily. GDB records
count with each of the specified breakpoints, and decrements a
breakpoint’s count when it is hit. When any count reaches 0,
GDB disables that breakpoint. If a breakpoint has an ignore
count (see Break Conditions), that will be
decremented to 0 before count is affected. enable [breakpoints] delete list…-
Enable the specified breakpoints to work once, then die. GDB
deletes any of these breakpoints as soon as your program stops there.
Breakpoints set by thetbreakcommand start out in this state.
Except for a breakpoint set with tbreak (see Setting Breakpoints), breakpoints that you set are initially enabled;
subsequently, they become disabled or enabled only when you use one of
the commands above. (The command until can set and delete a
breakpoint of its own, but it does not change the state of your other
breakpoints; see Continuing and
Stepping.)
5.1.6 Break Conditions
The simplest sort of breakpoint breaks every time your program reaches a
specified place. You can also specify a condition for a
breakpoint. A condition is just a Boolean expression in your
programming language (see Expressions). A breakpoint with
a condition evaluates the expression each time your program reaches it,
and your program stops only if the condition is true.
This is the converse of using assertions for program validation; in that
situation, you want to stop when the assertion is violated—that is,
when the condition is false. In C, if you want to test an assertion expressed
by the condition assert, you should set the condition
‘! assert’ on the appropriate breakpoint.
Conditions are also accepted for watchpoints; you may not need them,
since a watchpoint is inspecting the value of an expression anyhow—but
it might be simpler, say, to just set a watchpoint on a variable name,
and specify a condition that tests whether the new value is an interesting
one.
Break conditions can have side effects, and may even call functions in
your program. This can be useful, for example, to activate functions
that log program progress, or to use your own print functions to
format special data structures. The effects are completely predictable
unless there is another enabled breakpoint at the same address. (In
that case, GDB might see the other breakpoint first and stop your
program without checking the condition of this one.) Note that
breakpoint commands are usually more convenient and flexible than break
conditions for the
purpose of performing side effects when a breakpoint is reached
(see Breakpoint Command Lists).
Breakpoint conditions can also be evaluated on the target’s side if
the target supports it. Instead of evaluating the conditions locally,
GDB encodes the expression into an agent expression
(see Agent Expressions) suitable for execution on the target,
independently of GDB. Global variables become raw memory
locations, locals become stack accesses, and so forth.
In this case, GDB will only be notified of a breakpoint trigger
when its condition evaluates to true. This mechanism may provide faster
response times depending on the performance characteristics of the target
since it does not need to keep GDB informed about
every breakpoint trigger, even those with false conditions.
Break conditions can be specified when a breakpoint is set, by using
‘if’ in the arguments to the break command. See Setting Breakpoints. They can also be changed at any time
with the condition command.
You can also use the if keyword with the watch command.
The catch command does not recognize the if keyword;
condition is the only way to impose a further condition on a
catchpoint.
condition bnum expression-
Specify expression as the break condition for breakpoint,
watchpoint, or catchpoint number bnum. After you set a condition,
breakpoint bnum stops your program only if the value of
expression is true (nonzero, in C). When you use
condition, GDB checks expression immediately for
syntactic correctness, and to determine whether symbols in it have
referents in the context of your breakpoint. If expression uses
symbols not referenced in the context of the breakpoint, GDB
prints an error message:No symbol "foo" in current context.
GDB does
not actually evaluate expression at the time thecondition
command (or a command that sets a breakpoint with a condition, like
break if …) is given, however. See Expressions. condition -force bnum expression-
When the
-forceflag is used, define the condition even if
expression is invalid at all the current locations of breakpoint
bnum. This is similar to the-force-conditionoption
of thebreakcommand. condition bnum-
Remove the condition from breakpoint number bnum. It becomes
an ordinary unconditional breakpoint.
A special case of a breakpoint condition is to stop only when the
breakpoint has been reached a certain number of times. This is so
useful that there is a special way to do it, using the ignore
count of the breakpoint. Every breakpoint has an ignore count, which
is an integer. Most of the time, the ignore count is zero, and
therefore has no effect. But if your program reaches a breakpoint whose
ignore count is positive, then instead of stopping, it just decrements
the ignore count by one and continues. As a result, if the ignore count
value is n, the breakpoint does not stop the next n times
your program reaches it.
ignore bnum count-
Set the ignore count of breakpoint number bnum to count.
The next count times the breakpoint is reached, your program’s
execution does not stop; other than to decrement the ignore count, GDB
takes no action.To make the breakpoint stop the next time it is reached, specify
a count of zero.When you use
continueto resume execution of your program from a
breakpoint, you can specify an ignore count directly as an argument to
continue, rather than usingignore. See Continuing and Stepping.If a breakpoint has a positive ignore count and a condition, the
condition is not checked. Once the ignore count reaches zero,
GDB resumes checking the condition.You could achieve the effect of the ignore count with a condition such
as ‘$foo— <= 0’ using a debugger convenience variable that
is decremented each time. See Convenience
Variables.
Ignore counts apply to breakpoints, watchpoints, and catchpoints.
5.1.7 Breakpoint Command Lists
You can give any breakpoint (or watchpoint or catchpoint) a series of
commands to execute when your program stops due to that breakpoint. For
example, you might want to print the values of certain expressions, or
enable other breakpoints.
commands [list…]… command-list …end-
Specify a list of commands for the given breakpoints. The commands
themselves appear on the following lines. Type a line containing just
endto terminate the commands.To remove all commands from a breakpoint, type
commandsand
follow it immediately withend; that is, give no commands.With no argument,
commandsrefers to the last breakpoint,
watchpoint, or catchpoint set (not to the breakpoint most recently
encountered). If the most recent breakpoints were set with a single
command, then thecommandswill apply to all the breakpoints
set by that command. This applies to breakpoints set by
rbreak, and also applies when a singlebreakcommand
creates multiple breakpoints (see Ambiguous
Expressions).
Pressing RET as a means of repeating the last GDB command is
disabled within a command-list.
Inside a command list, you can use the command
disable $_hit_bpnum to disable the encountered breakpoint.
If your breakpoint has several code locations, the command
disable $_hit_bpnum.$_hit_locno will disable the specific breakpoint
code location encountered. If the breakpoint has only one location,
this command will disable the encountered breakpoint.
You can use breakpoint commands to start your program up again. Simply
use the continue command, or step, or any other command
that resumes execution.
Any other commands in the command list, after a command that resumes
execution, are ignored. This is because any time you resume execution
(even with a simple next or step), you may encounter
another breakpoint—which could have its own command list, leading to
ambiguities about which list to execute.
If the first command you specify in a command list is silent, the
usual message about stopping at a breakpoint is not printed. This may
be desirable for breakpoints that are to print a specific message and
then continue. If none of the remaining commands print anything, you
see no sign that the breakpoint was reached. silent is
meaningful only at the beginning of a breakpoint command list.
The commands echo, output, and printf allow you to
print precisely controlled output, and are often useful in silent
breakpoints. See Commands for Controlled Output.
For example, here is how you could use breakpoint commands to print the
value of x at entry to foo whenever x is positive.
break foo if x>0 commands silent printf "x is %dn",x cont end
One application for breakpoint commands is to compensate for one bug so
you can test for another. Put a breakpoint just after the erroneous line
of code, give it a condition to detect the case in which something
erroneous has been done, and give it commands to assign correct values
to any variables that need them. End with the continue command
so that your program does not stop, and start with the silent
command so that no output is produced. Here is an example:
break 403 commands silent set x = y + 4 cont end
5.1.8 Dynamic Printf
The dynamic printf command dprintf combines a breakpoint with
formatted printing of your program’s data to give you the effect of
inserting printf calls into your program on-the-fly, without
having to recompile it.
In its most basic form, the output goes to the GDB console. However,
you can set the variable dprintf-style for alternate handling.
For instance, you can ask to format the output by calling your
program’s printf function. This has the advantage that the
characters go to the program’s output device, so they can recorded in
redirects to files and so forth.
If you are doing remote debugging with a stub or agent, you can also
ask to have the printf handled by the remote agent. In addition to
ensuring that the output goes to the remote program’s device along
with any other output the program might produce, you can also ask that
the dprintf remain active even after disconnecting from the remote
target. Using the stub/agent is also more efficient, as it can do
everything without needing to communicate with GDB.
dprintf locspec,template,expression[,expression…]-
Whenever execution reaches a code location that results from resolving
locspec, print the values of one or more expressions under
the control of the string template. To print several values,
separate them with commas. set dprintf-style style-
Set the dprintf output to be handled in one of several different
styles enumerated below. A change of style affects all existing
dynamic printfs immediately. (If you need individual control over the
print commands, simply define normal breakpoints with
explicitly-supplied command lists.)gdb-
Handle the output using the GDB
printfcommand. call-
Handle the output by calling a function in your program (normally
printf). agent-
Have the remote debugging agent (such as
gdbserver) handle
the output itself. This style is only available for agents that
support running commands on the target.
set dprintf-function function-
Set the function to call if the dprintf style is
call. By
default its value isprintf. You may set it to any expression.
that GDB can evaluate to a function, as per thecall
command. set dprintf-channel channel-
Set a “channel” for dprintf. If set to a non-empty value,
GDB will evaluate it as an expression and pass the result as
a first argument to thedprintf-function, in the manner of
fprintfand similar functions. Otherwise, the dprintf format
string will be the first argument, in the manner ofprintf.As an example, if you wanted
dprintfoutput to go to a logfile
that is a standard I/O stream assigned to the variablemylog,
you could do the following:(gdb) set dprintf-style call (gdb) set dprintf-function fprintf (gdb) set dprintf-channel mylog (gdb) dprintf 25,"at line 25, glob=%dn",glob Dprintf 1 at 0x123456: file main.c, line 25. (gdb) info break 1 dprintf keep y 0x00123456 in main at main.c:25 call (void) fprintf (mylog,"at line 25, glob=%dn",glob) continue (gdb)Note that the
info breakdisplays the dynamic printf commands
as normal breakpoint commands; you can thus easily see the effect of
the variable settings. set disconnected-dprintf onset disconnected-dprintf off-
Choose whether
dprintfcommands should continue to run if
GDB has disconnected from the target. This only applies
if thedprintf-styleisagent. show disconnected-dprintf off-
Show the current choice for disconnected
dprintf.
GDB does not check the validity of function and channel,
relying on you to supply values that are meaningful for the contexts
in which they are being used. For instance, the function and channel
may be the values of local variables, but if that is the case, then
all enabled dynamic prints must be at locations within the scope of
those locals. If evaluation fails, GDB will report an error.
5.1.9 How to save breakpoints to a file
To save breakpoint definitions to a file use the save breakpoints command.
save breakpoints [filename]-
This command saves all current breakpoint definitions together with
their commands and ignore counts, into a file filename
suitable for use in a later debugging session. This includes all
types of breakpoints (breakpoints, watchpoints, catchpoints,
tracepoints). To read the saved breakpoint definitions, use the
sourcecommand (see Command Files). Note that watchpoints
with expressions involving local variables may fail to be recreated
because it may not be possible to access the context where the
watchpoint is valid anymore. Because the saved breakpoint definitions
are simply a sequence of GDB commands that recreate the
breakpoints, you can edit the file in your favorite editing program,
and remove the breakpoint definitions you’re not interested in, or
that can no longer be recreated.
5.1.10 Static Probe Points
GDB supports SDT probes in the code. SDT stands
for Statically Defined Tracing, and the probes are designed to have a tiny
runtime code and data footprint, and no dynamic relocations.
Currently, the following types of probes are supported on
ELF-compatible systems:
-
SystemTap(http://sourceware.org/systemtap/)
SDT probes5.SystemTapprobes are usable
from assembly, C and C++ languages6. -
DTrace(http://oss.oracle.com/projects/DTrace)
USDT probes.DTraceprobes are usable from C and
C++ languages.
Some SystemTap probes have an associated semaphore variable;
for instance, this happens automatically if you defined your probe
using a DTrace-style .d file. If your probe has a semaphore,
GDB will automatically enable it when you specify a
breakpoint using the ‘-probe-stap’ notation. But, if you put a
breakpoint at a probe’s location by some other method (e.g.,
break file:line), then GDB will not automatically set
the semaphore. DTrace probes do not support semaphores.
You can examine the available static static probes using info, with optional arguments:
probes
info probes [type] [provider [name [objfile]]]-
If given, type is either
stapfor listing
SystemTapprobes ordtracefor listingDTrace
probes. If omitted all probes are listed regardless of their types.If given, provider is a regular expression used to match against provider
names when selecting which probes to list. If omitted, probes by all
probes from all providers are listed.If given, name is a regular expression to match against probe names
when selecting which probes to list. If omitted, probe names are not
considered when deciding whether to display them.If given, objfile is a regular expression used to select which
object files (executable or shared libraries) to examine. If not
given, all object files are considered. info probes all-
List the available static probes, from all types.
Some probe points can be enabled and/or disabled. The effect of
enabling or disabling a probe depends on the type of probe being
handled. Some DTrace probes can be enabled or
disabled, but SystemTap probes cannot be disabled.
You can enable (or disable) one or more probes using the following
commands, with optional arguments:
enable probes [provider [name [objfile]]]-
If given, provider is a regular expression used to match against
provider names when selecting which probes to enable. If omitted,
all probes from all providers are enabled.If given, name is a regular expression to match against probe
names when selecting which probes to enable. If omitted, probe names
are not considered when deciding whether to enable them.If given, objfile is a regular expression used to select which
object files (executable or shared libraries) to examine. If not
given, all object files are considered. disable probes [provider [name [objfile]]]-
See the
enable probescommand above for a description of the
optional arguments accepted by this command.
A probe may specify up to twelve arguments. These are available at the
point at which the probe is defined—that is, when the current PC is
at the probe’s location. The arguments are available using the
convenience variables (see Convenience Vars)
$_probe_arg0…$_probe_arg11. In SystemTap
probes each probe argument is an integer of the appropriate size;
types are not preserved. In DTrace probes types are preserved
provided that they are recognized as such by GDB; otherwise
the value of the probe argument will be a long integer. The
convenience variable $_probe_argc holds the number of arguments
at the current probe point.
These variables are always available, but attempts to access them at
any location other than a probe point will cause GDB to give
an error message.
5.1.11 “Cannot insert breakpoints”
If you request too many active hardware-assisted breakpoints and
watchpoints, you will see this error message:
Stopped; cannot insert breakpoints. You may have requested too many hardware breakpoints and watchpoints.
This message is printed when you attempt to resume the program, since
only then GDB knows exactly how many hardware breakpoints and
watchpoints it needs to insert.
When this message is printed, you need to disable or remove some of the
hardware-assisted breakpoints and watchpoints, and then continue.
5.1.12 “Breakpoint address adjusted…”
Some processor architectures place constraints on the addresses at
which breakpoints may be placed. For architectures thus constrained,
GDB will attempt to adjust the breakpoint’s address to comply
with the constraints dictated by the architecture.
One example of such an architecture is the Fujitsu FR-V. The FR-V is
a VLIW architecture in which a number of RISC-like instructions may be
bundled together for parallel execution. The FR-V architecture
constrains the location of a breakpoint instruction within such a
bundle to the instruction with the lowest address. GDB
honors this constraint by adjusting a breakpoint’s address to the
first in the bundle.
It is not uncommon for optimized code to have bundles which contain
instructions from different source statements, thus it may happen that
a breakpoint’s address will be adjusted from one source statement to
another. Since this adjustment may significantly alter GDB’s
breakpoint related behavior from what the user expects, a warning is
printed when the breakpoint is first set and also when the breakpoint
is hit.
A warning like the one below is printed when setting a breakpoint
that’s been subject to address adjustment:
warning: Breakpoint address adjusted from 0x00010414 to 0x00010410.
Such warnings are printed both for user settable and GDB’s
internal breakpoints. If you see one of these warnings, you should
verify that a breakpoint set at the adjusted address will have the
desired affect. If not, the breakpoint in question may be removed and
other breakpoints may be set which will have the desired behavior.
E.g., it may be sufficient to place the breakpoint at a later
instruction. A conditional breakpoint may also be useful in some
cases to prevent the breakpoint from triggering too often.
GDB will also issue a warning when stopping at one of these
adjusted breakpoints:
warning: Breakpoint 1 address previously adjusted from 0x00010414 to 0x00010410.
When this warning is encountered, it may be too late to take remedial
action except in cases where the breakpoint is hit earlier or more
frequently than expected.
5.2 Continuing and Stepping
Continuing means resuming program execution until your program
completes normally. In contrast, stepping means executing just
one more “step” of your program, where “step” may mean either one
line of source code, or one machine instruction (depending on what
particular command you use). Either when continuing or when stepping,
your program may stop even sooner, due to a breakpoint or a signal. (If
it stops due to a signal, you may want to use handle, or use
‘signal 0’ to resume execution (see Signals),
or you may step into the signal’s handler (see stepping and signal handlers).)
continue [ignore-count]c [ignore-count]fg [ignore-count]-
Resume program execution, at the address where your program last stopped;
any breakpoints set at that address are bypassed. The optional argument
ignore-count allows you to specify a further number of times to
ignore a breakpoint at this location; its effect is like that of
ignore(see Break Conditions).The argument ignore-count is meaningful only when your program
stopped due to a breakpoint. At other times, the argument to
continueis ignored.The synonyms
candfg(for foreground, as the
debugged program is deemed to be the foreground program) are provided
purely for convenience, and have exactly the same behavior as
continue.
To resume execution at a different place, you can use return
(see Returning from a Function) to go back to the
calling function; or jump (see Continuing at a
Different Address) to go to an arbitrary location in your program.
A typical technique for using stepping is to set a breakpoint
(see Breakpoints; Watchpoints; and Catchpoints) at the
beginning of the function or the section of your program where a problem
is believed to lie, run your program until it stops at that breakpoint,
and then step through the suspect area, examining the variables that are
interesting, until you see the problem happen.
step-
Continue running your program until control reaches a different source
line, then stop it and return control to GDB. This command is
abbreviateds.Warning: If you use the
stepcommand while control is
within a function that was compiled without debugging information,
execution proceeds until control reaches a function that does have
debugging information. Likewise, it will not step into a function which
is compiled without debugging information. To step through functions
without debugging information, use thestepicommand, described
below.The
stepcommand only stops at the first instruction of a source
line. This prevents the multiple stops that could otherwise occur in
switchstatements,forloops, etc.stepcontinues
to stop if a function that has debugging information is called within
the line. In other words,stepsteps inside any functions
called within the line.Also, the
stepcommand only enters a function if there is line
number information for the function. Otherwise it acts like the
nextcommand. This avoids problems when usingcc -gl
on MIPS machines. Previously,stepentered subroutines if there
was any debugging information about the routine. step count-
Continue running as in
step, but do so count times. If a
breakpoint is reached, or a signal not related to stepping occurs before
count steps, stepping stops right away. next [count]-
Continue to the next source line in the current (innermost) stack frame.
This is similar tostep, but function calls that appear within
the line of code are executed without stopping. Execution stops when
control reaches a different line of code at the original stack level
that was executing when you gave thenextcommand. This command
is abbreviatedn.An argument count is a repeat count, as for
step.The
nextcommand only stops at the first instruction of a
source line. This prevents multiple stops that could otherwise occur in
switchstatements,forloops, etc. set step-modeset step-mode on-
The
set step-mode oncommand causes thestepcommand to
stop at the first instruction of a function which contains no debug line
information rather than stepping over it.This is useful in cases where you may be interested in inspecting the
machine instructions of a function which has no symbolic info and do not
want GDB to automatically skip over this function. set step-mode off-
Causes the
stepcommand to step over any functions which contains no
debug information. This is the default. show step-mode-
Show whether GDB will stop in or step over functions without
source line debug information. finish-
Continue running until just after function in the selected stack frame
returns. Print the returned value (if any). This command can be
abbreviated asfin.Contrast this with the
returncommand (see Returning from a Function). set print finish [on|off]show print finish-
By default the
finishcommand will show the value that is
returned by the function. This can be disabled usingset print. When disabled, the value is still entered into the value
finish off
history (see Value History), but not displayed. untilu-
Continue running until a source line past the current line, in the
current stack frame, is reached. This command is used to avoid single
stepping through a loop more than once. It is like thenext
command, except that whenuntilencounters a jump, it
automatically continues execution until the program counter is greater
than the address of the jump.This means that when you reach the end of a loop after single stepping
though it,untilmakes your program continue execution until it
exits the loop. In contrast, anextcommand at the end of a loop
simply steps back to the beginning of the loop, which forces you to step
through the next iteration.untilalways stops your program if it attempts to exit the current
stack frame.untilmay produce somewhat counterintuitive results if the order
of machine code does not match the order of the source lines. For
example, in the following excerpt from a debugging session, thef
(frame) command shows that execution is stopped at line
206; yet when we useuntil, we get to line195:(gdb) f #0 main (argc=4, argv=0xf7fffae8) at m4.c:206 206 expand_input(); (gdb) until 195 for ( ; argc > 0; NEXTARG) {This happened because, for execution efficiency, the compiler had
generated code for the loop closure test at the end, rather than the
start, of the loop—even though the test in a Cfor-loop is
written before the body of the loop. Theuntilcommand appeared
to step back to the beginning of the loop when it advanced to this
expression; however, it has not really gone to an earlier
statement—not in terms of the actual machine code.untilwith no argument works by means of single
instruction stepping, and hence is slower thanuntilwith an
argument. until locspecu locspec-
Continue running your program until either it reaches a code location
that results from resolving locspec, or the current stack frame
returns. locspec is any of the forms described in Location Specifications.
This form of the command uses temporary breakpoints, and
hence is quicker thanuntilwithout an argument. The specified
location is actually reached only if it is in the current frame. This
implies thatuntilcan be used to skip over recursive function
invocations. For instance in the code below, if the current location is
line96, issuinguntil 99will execute the program up to
line99in the same invocation of factorial, i.e., after the inner
invocations have returned.94 int factorial (int value) 95 { 96 if (value > 1) { 97 value *= factorial (value - 1); 98 } 99 return (value); 100 } advance locspec-
Continue running your program until either it reaches a code location
that results from resolving locspec, or the current stack frame
returns. locspec is any of the forms described in Location Specifications. This command is similar tountil, but
advancewill not skip over recursive function calls, and the
target code location doesn’t have to be in the same frame as the
current one. stepistepi argsi-
Execute one machine instruction, then stop and return to the debugger.
It is often useful to do ‘display/i $pc’ when stepping by machine
instructions. This makes GDB automatically display the next
instruction to be executed, each time your program stops. See Automatic Display.An argument is a repeat count, as in
step. nextinexti argni-
Execute one machine instruction, but if it is a function call,
proceed until the function returns.An argument is a repeat count, as in
next.
By default, and if available, GDB makes use of
target-assisted range stepping. In other words, whenever you
use a stepping command (e.g., step, next), GDB
tells the target to step the corresponding range of instruction
addresses instead of issuing multiple single-steps. This speeds up
line stepping, particularly for remote targets. Ideally, there should
be no reason you would want to turn range stepping off. However, it’s
possible that a bug in the debug info, a bug in the remote stub (for
remote targets), or even a bug in GDB could make line
stepping behave incorrectly when target-assisted range stepping is
enabled. You can use the following command to turn off range stepping
if necessary:
set range-steppingshow range-stepping-
Control whether range stepping is enabled.
If
on, and the target supports it, GDB tells the
target to step a range of addresses itself, instead of issuing
multiple single-steps. Ifoff, GDB always issues
single-steps, even if range stepping is supported by the target. The
default ison.
5.3 Skipping Over Functions and Files
The program you are debugging may contain some functions which are
uninteresting to debug. The skip command lets you tell GDB to
skip a function, all functions in a file or a particular function in
a particular file when stepping.
For example, consider the following C function:
101 int func()
102 {
103 foo(boring());
104 bar(boring());
105 }
Suppose you wish to step into the functions foo and bar, but you
are not interested in stepping through boring. If you run step
at line 103, you’ll enter boring(), but if you run next, you’ll
step over both foo and boring!
One solution is to step into boring and use the finish
command to immediately exit it. But this can become tedious if boring
is called from many places.
A more flexible solution is to execute skip boring. This instructs
GDB never to step into boring. Now when you execute
step at line 103, you’ll step over boring and directly into
foo.
Functions may be skipped by providing either a function name, linespec
(see Location Specifications), regular expression that matches the function’s
name, file name or a glob-style pattern that matches the file name.
On Posix systems the form of the regular expression is
“Extended Regular Expressions”. See for example ‘man 7 regex’
on GNU/Linux systems. On non-Posix systems the form of the regular
expression is whatever is provided by the regcomp function of
the underlying system.
See for example ‘man 7 glob’ on GNU/Linux systems for a
description of glob-style patterns.
skip [options]-
The basic form of the
skipcommand takes zero or more options
that specify what to skip.
The options argument is any useful combination of the following:-file file-fi file-
Functions in file will be skipped over when stepping.
-gfile file-glob-pattern-gfi file-glob-pattern-
Functions in files matching file-glob-pattern will be skipped
over when stepping.(gdb) skip -gfi utils/*.c
-function linespec-fu linespec-
Functions named by linespec or the function containing the line
named by linespec will be skipped over when stepping.
See Location Specifications. -rfunction regexp-rfu regexp-
Functions whose name matches regexp will be skipped over when stepping.
This form is useful for complex function names.
For example, there is generally no need to step into C++std::string
constructors or destructors. Plus with C++ templates it can be hard to
write out the full name of the function, and often it doesn’t matter what
the template arguments are. Specifying the function to be skipped as a
regular expression makes this easier.(gdb) skip -rfu ^std::(allocator|basic_string)<.*>::~?1 *(
If you want to skip every templated C++ constructor and destructor
in thestdnamespace you can do:(gdb) skip -rfu ^std::([a-zA-z0-9_]+)<.*>::~?1 *(
If no options are specified, the function you’re currently debugging
will be skipped. skip function [linespec]-
After running this command, the function named by linespec or the
function containing the line named by linespec will be skipped over when
stepping. See Location Specifications.If you do not specify linespec, the function you’re currently debugging
will be skipped.(If you have a function called
filethat you want to skip, use
skip function file.) skip file [filename]-
After running this command, any function whose source lives in filename
will be skipped over when stepping.(gdb) skip file boring.c File boring.c will be skipped when stepping.
If you do not specify filename, functions whose source lives in the file
you’re currently debugging will be skipped.
Skips can be listed, deleted, disabled, and enabled, much like breakpoints.
These are the commands for managing your list of skips:
info skip [range]-
Print details about the specified skip(s). If range is not specified,
print a table with details about all functions and files marked for skipping.
info skipprints the following information about each skip:- Identifier
-
A number identifying this skip.
- Enabled or Disabled
-
Enabled skips are marked with ‘y’.
Disabled skips are marked with ‘n’. - Glob
-
If the file name is a ‘glob’ pattern this is ‘y’.
Otherwise it is ‘n’. - File
-
The name or ‘glob’ pattern of the file to be skipped.
If no file is specified this is ‘<none>’. - RE
-
If the function name is a ‘regular expression’ this is ‘y’.
Otherwise it is ‘n’. - Function
-
The name or regular expression of the function to skip.
If no function is specified this is ‘<none>’.
skip delete [range]-
Delete the specified skip(s). If range is not specified, delete all
skips. skip enable [range]-
Enable the specified skip(s). If range is not specified, enable all
skips. skip disable [range]-
Disable the specified skip(s). If range is not specified, disable all
skips. set debug skip [on|off]-
Set whether to print the debug output about skipping files and functions.
show debug skip-
Show whether the debug output about skipping files and functions is printed.
5.4 Signals
A signal is an asynchronous event that can happen in a program. The
operating system defines the possible kinds of signals, and gives each
kind a name and a number. For example, in Unix SIGINT is the
signal a program gets when you type an interrupt character (often Ctrl-c);
SIGSEGV is the signal a program gets from referencing a place in
memory far away from all the areas in use; SIGALRM occurs when
the alarm clock timer goes off (which happens only if your program has
requested an alarm).
Some signals, including SIGALRM, are a normal part of the
functioning of your program. Others, such as SIGSEGV, indicate
errors; these signals are fatal (they kill your program immediately) if the
program has not specified in advance some other way to handle the signal.
SIGINT does not indicate an error in your program, but it is normally
fatal so it can carry out the purpose of the interrupt: to kill the program.
GDB has the ability to detect any occurrence of a signal in your
program. You can tell GDB in advance what to do for each kind of
signal.
Normally, GDB is set up to let the non-erroneous signals like
SIGALRM be silently passed to your program
(so as not to interfere with their role in the program’s functioning)
but to stop your program immediately whenever an error signal happens.
You can change these settings with the handle command.
info signalsinfo handle-
Print a table of all the kinds of signals and how GDB has been told to
handle each one. You can use this to see the signal numbers of all
the defined types of signals. info signals sig-
Similar, but print information only about the specified signal number.
info handleis an alias forinfo signals. catch signal [signal… | ‘all’]-
Set a catchpoint for the indicated signals. See Set Catchpoints,
for details about this command. handle signal [keywords…]-
Change the way GDB handles signal signal. The signal
can be the number of a signal or its name (with or without the
‘SIG’ at the beginning); a list of signal numbers of the form
‘low—high’; or the word ‘all’, meaning all the
known signals. Optional arguments keywords, described below,
say what change to make.
The keywords allowed by the handle command can be abbreviated.
Their full names are:
nostop-
GDB should not stop your program when this signal happens. It may
still print a message telling you that the signal has come in. stop-
GDB should stop your program when this signal happens. This implies
theprintkeyword as well. print-
GDB should print a message when this signal happens.
noprint-
GDB should not mention the occurrence of the signal at all. This
implies thenostopkeyword as well. passnoignore-
GDB should allow your program to see this signal; your program
can handle the signal, or else it may terminate if the signal is fatal
and not handled.passandnoignoreare synonyms. nopassignore-
GDB should not allow your program to see this signal.
nopassandignoreare synonyms.
When a signal stops your program, the signal is not visible to the
program until you
continue. Your program sees the signal then, if pass is in
effect for the signal in question at that time. In other words,
after GDB reports a signal, you can use the handle
command with pass or nopass to control whether your
program sees that signal when you continue.
The default is set to nostop, noprint, pass for
non-erroneous signals such as SIGALRM, SIGWINCH and
SIGCHLD, and to stop, print, pass for the
erroneous signals.
You can also use the signal command to prevent your program from
seeing a signal, or cause it to see a signal it normally would not see,
or to give it any signal at any time. For example, if your program stopped
due to some sort of memory reference error, you might store correct
values into the erroneous variables and continue, hoping to see more
execution; but your program would probably terminate immediately as
a result of the fatal signal once it saw the signal. To prevent this,
you can continue with ‘signal 0’. See Giving your
Program a Signal.
GDB optimizes for stepping the mainline code. If a signal
that has handle nostop and handle pass set arrives while
a stepping command (e.g., stepi, step, next) is
in progress, GDB lets the signal handler run and then resumes
stepping the mainline code once the signal handler returns. In other
words, GDB steps over the signal handler. This prevents
signals that you’ve specified as not interesting (with handle) from changing the focus of debugging unexpectedly. Note that
nostop
the signal handler itself may still hit a breakpoint, stop for another
signal that has handle stop in effect, or for any other event
that normally results in stopping the stepping command sooner. Also
note that GDB still informs you that the program received a
signal if handle print is set.
If you set handle pass for a signal, and your program sets up a
handler for it, then issuing a stepping command, such as step
or stepi, when your program is stopped due to the signal will
step into the signal handler (if the target supports that).
Likewise, if you use the queue-signal command to queue a signal
to be delivered to the current thread when execution of the thread
resumes (see Giving your Program a Signal), then a
stepping command will step into the signal handler.
Here’s an example, using stepi to step to the first instruction
of SIGUSR1’s handler:
(gdb) handle SIGUSR1
Signal Stop Print Pass to program Description
SIGUSR1 Yes Yes Yes User defined signal 1
(gdb) c
Continuing.
Program received signal SIGUSR1, User defined signal 1.
main () sigusr1.c:28
28 p = 0;
(gdb) si
sigusr1_handler () at sigusr1.c:9
9 {
The same, but using queue-signal instead of waiting for the
program to receive the signal first:
(gdb) n
28 p = 0;
(gdb) queue-signal SIGUSR1
(gdb) si
sigusr1_handler () at sigusr1.c:9
9 {
(gdb)
On some targets, GDB can inspect extra signal information
associated with the intercepted signal, before it is actually
delivered to the program being debugged. This information is exported
by the convenience variable $_siginfo, and consists of data
that is passed by the kernel to the signal handler at the time of the
receipt of a signal. The data type of the information itself is
target dependent. You can see the data type using the ptype command. On Unix systems, it typically corresponds to the
$_siginfo
standard siginfo_t type, as defined in the signal.h
system header.
Here’s an example, on a GNU/Linux system, printing the stray
referenced address that raised a segmentation fault.
(gdb) continue
Program received signal SIGSEGV, Segmentation fault.
0x0000000000400766 in main ()
69 *(int *)p = 0;
(gdb) ptype $_siginfo
type = struct {
int si_signo;
int si_errno;
int si_code;
union {
int _pad[28];
struct {...} _kill;
struct {...} _timer;
struct {...} _rt;
struct {...} _sigchld;
struct {...} _sigfault;
struct {...} _sigpoll;
} _sifields;
}
(gdb) ptype $_siginfo._sifields._sigfault
type = struct {
void *si_addr;
}
(gdb) p $_siginfo._sifields._sigfault.si_addr
$1 = (void *) 0x7ffff7ff7000
Depending on target support, $_siginfo may also be writable.
On some targets, a SIGSEGV can be caused by a boundary
violation, i.e., accessing an address outside of the allowed range.
In those cases GDB may displays additional information,
depending on how GDB has been told to handle the signal.
With handle stop SIGSEGV, GDB displays the violation
kind: «Upper» or «Lower», the memory address accessed and the
bounds, while with handle nostop SIGSEGV no additional
information is displayed.
The usual output of a segfault is:
Program received signal SIGSEGV, Segmentation fault 0x0000000000400d7c in upper () at i386-mpx-sigsegv.c:68 68 value = *(p + len);
While a bound violation is presented as:
Program received signal SIGSEGV, Segmentation fault Upper bound violation while accessing address 0x7fffffffc3b3 Bounds: [lower = 0x7fffffffc390, upper = 0x7fffffffc3a3] 0x0000000000400d7c in upper () at i386-mpx-sigsegv.c:68 68 value = *(p + len);
5.5 Stopping and Starting Multi-thread Programs
GDB supports debugging programs with multiple threads
(see Debugging Programs with Multiple Threads). There
are two modes of controlling execution of your program within the
debugger. In the default mode, referred to as all-stop mode,
when any thread in your program stops (for example, at a breakpoint
or while being stepped), all other threads in the program are also stopped by
GDB. On some targets, GDB also supports
non-stop mode, in which other threads can continue to run freely while
you examine the stopped thread in the debugger.
5.5.1 All-Stop Mode
In all-stop mode, whenever your program stops under GDB for any reason,
all threads of execution stop, not just the current thread. This
allows you to examine the overall state of the program, including
switching between threads, without worrying that things may change
underfoot.
Conversely, whenever you restart the program, all threads start
executing. This is true even when single-stepping with commands
like step or next.
In particular, GDB cannot single-step all threads in lockstep.
Since thread scheduling is up to your debugging target’s operating
system (not controlled by GDB), other threads may
execute more than one statement while the current thread completes a
single step. Moreover, in general other threads stop in the middle of a
statement, rather than at a clean statement boundary, when the program
stops.
You might even find your program stopped in another thread after
continuing or even single-stepping. This happens whenever some other
thread runs into a breakpoint, a signal, or an exception before the
first thread completes whatever you requested.
Whenever GDB stops your program, due to a breakpoint or a
signal, it automatically selects the thread where that breakpoint or
signal happened. GDB alerts you to the context switch with a
message such as ‘[Switching to Thread n]’ to identify the
thread.
On some OSes, you can modify GDB’s default behavior by
locking the OS scheduler to allow only a single thread to run.
set scheduler-locking mode-
Set the scheduler locking mode. It applies to normal execution,
record mode, and replay mode. mode can be one of
the following:off-
There is no locking and any thread may run at any time.
on-
Only the current thread may run when the inferior is resumed.
step-
Behaves like
onwhen stepping, andoffotherwise.
Threads other than the current never get a chance to run when you
step, and they are completely free to run when you use commands like
‘continue’, ‘until’, or ‘finish’.This mode optimizes for single-stepping; it prevents other threads
from preempting the current thread while you are stepping, so that the
focus of debugging does not change unexpectedly. However, unless
another thread hits a breakpoint during its timeslice, GDB
does not change the current thread away from the thread that you are
debugging. replay-
Behaves like
onin replay mode, andoffin either record
mode or during normal execution. This is the default mode.
show scheduler-locking-
Display the current scheduler locking mode.
By default, when you issue one of the execution commands such as
continue, next or step, GDB allows only
threads of the current inferior to run. For example, if GDB
is attached to two inferiors, each with two threads, the
continue command resumes only the two threads of the current
inferior. This is useful, for example, when you debug a program that
forks and you want to hold the parent stopped (so that, for instance,
it doesn’t run to exit), while you debug the child. In other
situations, you may not be interested in inspecting the current state
of any of the processes GDB is attached to, and you may want
to resume them all until some breakpoint is hit. In the latter case,
you can instruct GDB to allow all threads of all the
inferiors to run with the set schedule-multiple command.
set schedule-multiple-
Set the mode for allowing threads of multiple processes to be resumed
when an execution command is issued. Whenon, all threads of
all processes are allowed to run. Whenoff, only the threads
of the current process are resumed. The default isoff. The
scheduler-lockingmode takes precedence when set toon,
or while you are stepping and set tostep. show schedule-multiple-
Display the current mode for resuming the execution of threads of
multiple processes.
5.5.2 Non-Stop Mode
For some multi-threaded targets, GDB supports an optional
mode of operation in which you can examine stopped program threads in
the debugger while other threads continue to execute freely. This
minimizes intrusion when debugging live systems, such as programs
where some threads have real-time constraints or must continue to
respond to external events. This is referred to as non-stop mode.
In non-stop mode, when a thread stops to report a debugging event,
only that thread is stopped; GDB does not stop other
threads as well, in contrast to the all-stop mode behavior. Additionally,
execution commands such as continue and step apply by default
only to the current thread in non-stop mode, rather than all threads as
in all-stop mode. This allows you to control threads explicitly in
ways that are not possible in all-stop mode — for example, stepping
one thread while allowing others to run freely, stepping
one thread while holding all others stopped, or stepping several threads
independently and simultaneously.
To enter non-stop mode, use this sequence of commands before you run
or attach to your program:
# If using the CLI, pagination breaks non-stop. set pagination off # Finally, turn it on! set non-stop on
You can use these commands to manipulate the non-stop mode setting:
set non-stop on-
Enable selection of non-stop mode.
set non-stop off-
Disable selection of non-stop mode.
show non-stop-
Show the current non-stop enablement setting.
Note these commands only reflect whether non-stop mode is enabled,
not whether the currently-executing program is being run in non-stop mode.
In particular, the set non-stop preference is only consulted when
GDB starts or connects to the target program, and it is generally
not possible to switch modes once debugging has started. Furthermore,
since not all targets support non-stop mode, even when you have enabled
non-stop mode, GDB may still fall back to all-stop operation by
default.
In non-stop mode, all execution commands apply only to the current thread
by default. That is, continue only continues one thread.
To continue all threads, issue continue -a or c -a.
You can use GDB’s background execution commands
(see Background Execution) to run some threads in the background
while you continue to examine or step others from GDB.
The MI execution commands (see GDB/MI Program Execution) are
always executed asynchronously in non-stop mode.
Suspending execution is done with the interrupt command when
running in the background, or Ctrl-c during foreground execution.
In all-stop mode, this stops the whole process;
but in non-stop mode the interrupt applies only to the current thread.
To stop the whole program, use interrupt -a.
Other execution commands do not currently support the -a option.
In non-stop mode, when a thread stops, GDB doesn’t automatically make
that thread current, as it does in all-stop mode. This is because the
thread stop notifications are asynchronous with respect to GDB’s
command interpreter, and it would be confusing if GDB unexpectedly
changed to a different thread just as you entered a command to operate on the
previously current thread.
5.5.3 Background Execution
GDB’s execution commands have two variants: the normal
foreground (synchronous) behavior, and a background
(asynchronous) behavior. In foreground execution, GDB waits for
the program to report that some thread has stopped before prompting for
another command. In background execution, GDB immediately gives
a command prompt so that you can issue other commands while your program runs.
If the target doesn’t support async mode, GDB issues an error
message if you attempt to use the background execution commands.
To specify background execution, add a & to the command. For example,
the background form of the continue command is continue&, or
just c&. The execution commands that accept background execution
are:
run-
See Starting your Program.
attach-
See Debugging an Already-running Process.
step-
See step.
stepi-
See stepi.
next-
See next.
nexti-
See nexti.
continue-
See continue.
finish-
See finish.
until-
See until.
Background execution is especially useful in conjunction with non-stop
mode for debugging programs with multiple threads; see Non-Stop Mode.
However, you can also use these commands in the normal all-stop mode with
the restriction that you cannot issue another execution command until the
previous one finishes. Examples of commands that are valid in all-stop
mode while the program is running include help and info break.
You can interrupt your program while it is running in the background by
using the interrupt command.
interruptinterrupt -a-
Suspend execution of the running program. In all-stop mode,
interruptstops the whole process, but in non-stop mode, it stops
only the current thread. To stop the whole program in non-stop mode,
useinterrupt -a.
5.5.4 Thread-Specific Breakpoints
When your program has multiple threads (see Debugging
Programs with Multiple Threads), you can choose whether to set
breakpoints on all threads, or on a particular thread.
break locspec thread thread-idbreak locspec thread thread-id if …-
locspec specifies a code location or locations in your program.
See Location Specifications, for details.Use the qualifier ‘thread thread-id’ with a breakpoint command
to specify that you only want GDB to stop the program when a
particular thread reaches this breakpoint. The thread-id specifier
is one of the thread identifiers assigned by GDB, shown
in the first column of the ‘info threads’ display.If you do not specify ‘thread thread-id’ when you set a
breakpoint, the breakpoint applies to all threads of your
program.You can use the
threadqualifier on conditional breakpoints as
well; in this case, place ‘thread thread-id’ before or
after the breakpoint condition, like this:(gdb) break frik.c:13 thread 28 if bartab > lim
Thread-specific breakpoints are automatically deleted when
GDB detects the corresponding thread is no longer in the
thread list. For example:
(gdb) c Thread-specific breakpoint 3 deleted - thread 28 no longer in the thread list.
There are several ways for a thread to disappear, such as a regular
thread exit, but also when you detach from the process with the
detach command (see Debugging an Already-running
Process), or if GDB loses the remote connection
(see Remote Debugging), etc. Note that with some targets,
GDB is only able to detect a thread has exited when the user
explictly asks for the thread list with the info threads
command.
5.5.5 Interrupted System Calls
There is an unfortunate side effect when using GDB to debug
multi-threaded programs. If one thread stops for a
breakpoint, or for some other reason, and another thread is blocked in a
system call, then the system call may return prematurely. This is a
consequence of the interaction between multiple threads and the signals
that GDB uses to implement breakpoints and other events that
stop execution.
To handle this problem, your program should check the return value of
each system call and react appropriately. This is good programming
style anyways.
For example, do not write code like this:
The call to sleep will return early if a different thread stops
at a breakpoint or for some other reason.
Instead, write this:
int unslept = 10;
while (unslept > 0)
unslept = sleep (unslept);
A system call is allowed to return early, so the system is still
conforming to its specification. But GDB does cause your
multi-threaded program to behave differently than it would without
GDB.
Also, GDB uses internal breakpoints in the thread library to
monitor certain events such as thread creation and thread destruction.
When such an event happens, a system call in another thread may return
prematurely, even though your program does not appear to stop.
5.5.6 Observer Mode
If you want to build on non-stop mode and observe program behavior
without any chance of disruption by GDB, you can set
variables to disable all of the debugger’s attempts to modify state,
whether by writing memory, inserting breakpoints, etc. These operate
at a low level, intercepting operations from all commands.
When all of these are set to off, then GDB is said to
be observer mode. As a convenience, the variable
observer can be set to disable these, plus enable non-stop
mode.
Note that GDB will not prevent you from making nonsensical
combinations of these settings. For instance, if you have enabled
may-insert-breakpoints but disabled may-write-memory,
then breakpoints that work by writing trap instructions into the code
stream will still not be able to be placed.
set observer onset observer off-
When set to
on, this disables all the permission variables
below (except forinsert-fast-tracepoints), plus enables
non-stop debugging. Setting this tooffswitches back to
normal debugging, though remaining in non-stop mode. show observer-
Show whether observer mode is on or off.
set may-write-registers onset may-write-registers off-
This controls whether GDB will attempt to alter the values of
registers, such as with assignment expressions inprint, or the
jumpcommand. It defaults toon. show may-write-registers-
Show the current permission to write registers.
set may-write-memory onset may-write-memory off-
This controls whether GDB will attempt to alter the contents
of memory, such as with assignment expressions inprint. It
defaults toon. show may-write-memory-
Show the current permission to write memory.
set may-insert-breakpoints onset may-insert-breakpoints off-
This controls whether GDB will attempt to insert breakpoints.
This affects all breakpoints, including internal breakpoints defined
by GDB. It defaults toon. show may-insert-breakpoints-
Show the current permission to insert breakpoints.
set may-insert-tracepoints onset may-insert-tracepoints off-
This controls whether GDB will attempt to insert (regular)
tracepoints at the beginning of a tracing experiment. It affects only
non-fast tracepoints, fast tracepoints being under the control of
may-insert-fast-tracepoints. It defaults toon. show may-insert-tracepoints-
Show the current permission to insert tracepoints.
set may-insert-fast-tracepoints onset may-insert-fast-tracepoints off-
This controls whether GDB will attempt to insert fast
tracepoints at the beginning of a tracing experiment. It affects only
fast tracepoints, regular (non-fast) tracepoints being under the
control ofmay-insert-tracepoints. It defaults toon. show may-insert-fast-tracepoints-
Show the current permission to insert fast tracepoints.
set may-interrupt onset may-interrupt off-
This controls whether GDB will attempt to interrupt or stop
program execution. When this variable isoff, the
interruptcommand will have no effect, nor will
Ctrl-c. It defaults toon. show may-interrupt-
Show the current permission to interrupt or stop the program.
6 Running programs backward
When you are debugging a program, it is not unusual to realize that
you have gone too far, and some event of interest has already happened.
If the target environment supports it, GDB can allow you to
“rewind” the program by running it backward.
A target environment that supports reverse execution should be able
to “undo” the changes in machine state that have taken place as the
program was executing normally. Variables, registers etc. should
revert to their previous values. Obviously this requires a great
deal of sophistication on the part of the target environment; not
all target environments can support reverse execution.
When a program is executed in reverse, the instructions that
have most recently been executed are “un-executed”, in reverse
order. The program counter runs backward, following the previous
thread of execution in reverse. As each instruction is “un-executed”,
the values of memory and/or registers that were changed by that
instruction are reverted to their previous states. After executing
a piece of source code in reverse, all side effects of that code
should be “undone”, and all variables should be returned to their
prior values7.
On some platforms, GDB has built-in support for reverse
execution, activated with the record or record btrace
commands. See Process Record and Replay. Some remote targets,
typically full system emulators, support reverse execution directly
without requiring any special command.
If you are debugging in a target environment that supports
reverse execution, GDB provides the following commands.
reverse-continue [ignore-count]rc [ignore-count]-
Beginning at the point where your program last stopped, start executing
in reverse. Reverse execution will stop for breakpoints and synchronous
exceptions (signals), just like normal execution. Behavior of
asynchronous signals depends on the target environment. reverse-step [count]-
Run the program backward until control reaches the start of a
different source line; then stop it, and return control to GDB.Like the
stepcommand,reverse-stepwill only stop
at the beginning of a source line. It “un-executes” the previously
executed source line. If the previous source line included calls to
debuggable functions,reverse-stepwill step (backward) into
the called function, stopping at the beginning of the last
statement in the called function (typically a return statement).Also, as with the
stepcommand, if non-debuggable functions are
called,reverse-stepwill run thru them backward without stopping. reverse-stepi [count]-
Reverse-execute one machine instruction. Note that the instruction
to be reverse-executed is not the one pointed to by the program
counter, but the instruction executed prior to that one. For instance,
if the last instruction was a jump,reverse-stepiwill take you
back from the destination of the jump to the jump instruction itself. reverse-next [count]-
Run backward to the beginning of the previous line executed in
the current (innermost) stack frame. If the line contains function
calls, they will be “un-executed” without stopping. Starting from
the first line of a function,reverse-nextwill take you back
to the caller of that function, before the function was called,
just as the normalnextcommand would take you from the last
line of a function back to its return to its caller
8. reverse-nexti [count]-
Like
nexti,reverse-nextiexecutes a single instruction
in reverse, except that called functions are “un-executed” atomically.
That is, if the previously executed instruction was a return from
another function,reverse-nextiwill continue to execute
in reverse until the call to that function (from the current stack
frame) is reached. reverse-finish-
Just as the
finishcommand takes you to the point where the
current function returns,reverse-finishtakes you to the point
where it was called. Instead of ending up at the end of the current
function invocation, you end up at the beginning. set exec-direction-
Set the direction of target execution.
set exec-direction reverse-
GDB will perform all execution commands in reverse, until the
exec-direction mode is changed to “forward”. Affected commands include
step, stepi, next, nexti, continue, and finish. Thereturn
command cannot be used in reverse mode. set exec-direction forward-
GDB will perform all execution commands in the normal fashion.
This is the default.
7 Recording Inferior’s Execution and Replaying It
On some platforms, GDB provides a special process record
and replay target that can record a log of the process execution, and
replay it later with both forward and reverse execution commands.
When this target is in use, if the execution log includes the record
for the next instruction, GDB will debug in replay
mode. In the replay mode, the inferior does not really execute code
instructions. Instead, all the events that normally happen during
code execution are taken from the execution log. While code is not
really executed in replay mode, the values of registers (including the
program counter register) and the memory of the inferior are still
changed as they normally would. Their contents are taken from the
execution log.
If the record for the next instruction is not in the execution log,
GDB will debug in record mode. In this mode, the
inferior executes normally, and GDB records the execution log
for future replay.
The process record and replay target supports reverse execution
(see Reverse Execution), even if the platform on which the
inferior runs does not. However, the reverse execution is limited in
this case by the range of the instructions recorded in the execution
log. In other words, reverse execution on platforms that don’t
support it directly can only be done in the replay mode.
When debugging in the reverse direction, GDB will work in
replay mode as long as the execution log includes the record for the
previous instruction; otherwise, it will work in record mode, if the
platform supports reverse execution, or stop if not.
Currently, process record and replay is supported on ARM, Aarch64,
Moxie, PowerPC, PowerPC64, S/390, and x86 (i386/amd64) running
GNU/Linux. Process record and replay can be used both when native
debugging, and when remote debugging via gdbserver.
For architecture environments that support process record and replay,
GDB provides the following commands:
record method-
This command starts the process record and replay target. The
recording method can be specified as parameter. Without a parameter
the command uses thefullrecording method. The following
recording methods are available:full-
Full record/replay recording using GDB’s software record and
replay implementation. This method allows replaying and reverse
execution. btrace format-
Hardware-supported instruction recording, supported on Intel
processors. This method does not record data. Further, the data is
collected in a ring buffer so old data will be overwritten when the
buffer is full. It allows limited reverse execution. Variables and
registers are not available during reverse execution. In remote
debugging, recording continues on disconnect. Recorded data can be
inspected after reconnecting. The recording may be stopped using
record stop.The recording format can be specified as parameter. Without a parameter
the command chooses the recording format. The following recording
formats are available:bts-
Use the Branch Trace Store (BTS) recording format. In
this format, the processor stores a from/to record for each executed
branch in the btrace ring buffer. pt-
Use the Intel Processor Trace recording format. In this
format, the processor stores the execution trace in a compressed form
that is afterwards decoded by GDB.The trace can be recorded with very low overhead. The compressed
trace format also allows small trace buffers to already contain a big
number of instructions compared to BTS.Decoding the recorded execution trace, on the other hand, is more
expensive than decoding BTS trace. This is mostly due to the
increased number of instructions to process. You should increase the
buffer-size with care.
Not all recording formats may be available on all processors.
The process record and replay target can only debug a process that is
already running. Therefore, you need first to start the process with
the run or start commands, and then start the recording
with the record method command.Displaced stepping (see displaced stepping)
will be automatically disabled when process record and replay target
is started. That’s because the process record and replay target
doesn’t support displaced stepping.If the inferior is in the non-stop mode (see Non-Stop Mode) or in
the asynchronous execution mode (see Background Execution), not
all recording methods are available. Thefullrecording method
does not support these two modes. record stop-
Stop the process record and replay target. When process record and
replay target stops, the entire execution log will be deleted and the
inferior will either be terminated, or will remain in its final state.When you stop the process record and replay target in record mode (at
the end of the execution log), the inferior will be stopped at the
next instruction that would have been recorded. In other words, if
you record for a while and then stop recording, the inferior process
will be left in the same state as if the recording never happened.On the other hand, if the process record and replay target is stopped
while in replay mode (that is, not at the end of the execution log,
but at some earlier point), the inferior process will become “live”
at that earlier state, and it will then be possible to continue the
usual “live” debugging of the process from that state.When the inferior process exits, or GDB detaches from it,
process record and replay target will automatically stop itself. record goto-
Go to a specific location in the execution log. There are several
ways to specify the location to go to:record goto beginrecord goto start-
Go to the beginning of the execution log.
record goto end-
Go to the end of the execution log.
record goto n-
Go to instruction number n in the execution log.
record save filename-
Save the execution log to a file filename.
Default filename is gdb_record.process_id, where
process_id is the process ID of the inferior.This command may not be available for all recording methods.
record restore filename-
Restore the execution log from a file filename.
File must have been created withrecord save. set record full insn-number-max limitset record full insn-number-max unlimited-
Set the limit of instructions to be recorded for the
full
recording method. Default value is 200000.If limit is a positive number, then GDB will start
deleting instructions from the log once the number of the record
instructions becomes greater than limit. For every new recorded
instruction, GDB will delete the earliest recorded
instruction to keep the number of recorded instructions at the limit.
(Since deleting recorded instructions loses information, GDB
lets you control what happens when the limit is reached, by means of
thestop-at-limitoption, described below.)If limit is
unlimitedor zero, GDB will never
delete recorded instructions from the execution log. The number of
recorded instructions is limited only by the available memory. show record full insn-number-max-
Show the limit of instructions to be recorded with the
full
recording method. set record full stop-at-limit-
Control the behavior of the
fullrecording method when the
number of recorded instructions reaches the limit. If ON (the
default), GDB will stop when the limit is reached for the
first time and ask you whether you want to stop the inferior or
continue running it and recording the execution log. If you decide
to continue recording, each new recorded instruction will cause the
oldest one to be deleted.If this option is OFF, GDB will automatically delete the
oldest record to make room for each new one, without asking. show record full stop-at-limit-
Show the current setting of
stop-at-limit. set record full memory-query-
Control the behavior when GDB is unable to record memory
changes caused by an instruction for thefullrecording method.
If ON, GDB will query whether to stop the inferior in that
case.If this option is OFF (the default), GDB will automatically
ignore the effect of such instructions on memory. Later, when
GDB replays this execution log, it will mark the log of this
instruction as not accessible, and it will not affect the replay
results. show record full memory-query-
Show the current setting of
memory-query.The
btracerecord target does not trace data. As a
convenience, when replaying, GDB reads read-only memory off
the live program directly, assuming that the addresses of the
read-only areas don’t change. This for example makes it possible to
disassemble code while replaying, but not to print variables.
In some cases, being able to inspect variables might be useful.
You can use the following command for that: set record btrace replay-memory-access-
Control the behavior of the
btracerecording method when
accessing memory during replay. Ifread-only(the default),
GDB will only allow accesses to read-only memory.
Ifread-write, GDB will allow accesses to read-only
and to read-write memory. Beware that the accessed memory corresponds
to the live target and not necessarily to the current replay
position. set record btrace cpu identifier-
Set the processor to be used for enabling workarounds for processor
errata when decoding the trace.Processor errata are defects in processor operation, caused by its
design or manufacture. They can cause a trace not to match the
specification. This, in turn, may cause trace decode to fail.
GDB can detect erroneous trace packets and correct them, thus
avoiding the decoding failures. These corrections are known as
errata workarounds, and are enabled based on the processor on
which the trace was recorded.By default, GDB attempts to detect the processor
automatically, and apply the necessary workarounds for it. However,
you may need to specify the processor if GDB does not yet
support it. This command allows you to do that, and also allows to
disable the workarounds.The argument identifier identifies the CPU and is of the
form:vendor:processor identifier. In addition,
there are two special identifiers,noneandauto
(default).The following vendor identifiers and corresponding processor
identifiers are currently supported:intelfamily/model[/stepping] On GNU/Linux systems, the processor family, model, and
stepping can be obtained from/proc/cpuinfo.If identifier is
auto, enable errata workarounds for the
processor on which the trace was recorded. If identifier is
none, errata workarounds are disabled.For example, when using an old GDB on a new system, decode
may fail because GDB does not support the new processor. It
often suffices to specify an older processor that GDB
supports.(gdb) info record Active record target: record-btrace Recording format: Intel Processor Trace. Buffer size: 16kB. Failed to configure the Intel Processor Trace decoder: unknown cpu. (gdb) set record btrace cpu intel:6/158 (gdb) info record Active record target: record-btrace Recording format: Intel Processor Trace. Buffer size: 16kB. Recorded 84872 instructions in 3189 functions (0 gaps) for thread 1 (...).
show record btrace replay-memory-access-
Show the current setting of
replay-memory-access. show record btrace cpu-
Show the processor to be used for enabling trace decode errata
workarounds. set record btrace bts buffer-size sizeset record btrace bts buffer-size unlimited-
Set the requested ring buffer size for branch tracing in BTS
format. Default is 64KB.If size is a positive number, then GDB will try to
allocate a buffer of at least size bytes for each new thread
that uses the btrace recording method and the BTS format.
The actually obtained buffer size may differ from the requested
size. Use theinfo recordcommand to see the actual
buffer size for each thread that uses the btrace recording method and
the BTS format.If limit is
unlimitedor zero, GDB will try to
allocate a buffer of 4MB.Bigger buffers mean longer traces. On the other hand, GDB will
also need longer to process the branch trace data before it can be used. show record btrace bts buffer-size size-
Show the current setting of the requested ring buffer size for branch
tracing in BTS format. set record btrace pt buffer-size sizeset record btrace pt buffer-size unlimited-
Set the requested ring buffer size for branch tracing in Intel
Processor Trace format. Default is 16KB.If size is a positive number, then GDB will try to
allocate a buffer of at least size bytes for each new thread
that uses the btrace recording method and the Intel Processor Trace
format. The actually obtained buffer size may differ from the
requested size. Use theinfo recordcommand to see the
actual buffer size for each thread.If limit is
unlimitedor zero, GDB will try to
allocate a buffer of 4MB.Bigger buffers mean longer traces. On the other hand, GDB will
also need longer to process the branch trace data before it can be used. show record btrace pt buffer-size size-
Show the current setting of the requested ring buffer size for branch
tracing in Intel Processor Trace format. info record-
Show various statistics about the recording depending on the recording
method:full-
For the
fullrecording method, it shows the state of process
record and its in-memory execution log buffer, including:- Whether in record mode or replay mode.
- Lowest recorded instruction number (counting from when the current execution log started recording instructions).
- Highest recorded instruction number.
- Current instruction about to be replayed (if in replay mode).
- Number of instructions contained in the execution log.
- Maximum number of instructions that may be contained in the execution log.
btrace-
For the
btracerecording method, it shows:- Recording format.
- Number of instructions that have been recorded.
- Number of blocks of sequential control-flow formed by the recorded
instructions. - Whether in record mode or replay mode.
For the
btsrecording format, it also shows:- Size of the perf ring buffer.
For the
ptrecording format, it also shows:- Size of the perf ring buffer.
record delete-
When record target runs in replay mode (“in the past”), delete the
subsequent execution log and begin to record a new execution log starting
from the current address. This means you will abandon the previously
recorded “future” and begin recording a new “future”. record instruction-history-
Disassembles instructions from the recorded execution log. By
default, ten instructions are disassembled. This can be changed using
theset record instruction-history-sizecommand. Instructions
are printed in execution order.It can also print mixed source+disassembly if you specify the the
/mor/smodifier, and print the raw instructions in hex
as well as in symbolic form by specifying the/ror/b
modifier. The behaviour of the/m,/s,/r, and
/bmodifiers are the same as for the disassemble command
(see disassemble).The current position marker is printed for the instruction at the
current program counter value. This instruction can appear multiple
times in the trace and the current position marker will be printed
every time. To omit the current position marker, specify the
/pmodifier.To better align the printed instructions when the trace contains
instructions from more than one function, the function name may be
omitted by specifying the/fmodifier.Speculatively executed instructions are prefixed with ‘?’. This
feature is not available for all recording formats.There are several ways to specify what part of the execution log to
disassemble:record instruction-history insn-
Disassembles ten instructions starting from instruction number
insn. record instruction-history insn, +/-n-
Disassembles n instructions around instruction number
insn. If n is preceded with+, disassembles
n instructions after instruction number insn. If
n is preceded with-, disassembles n
instructions before instruction number insn. record instruction-history-
Disassembles ten more instructions after the last disassembly.
record instruction-history --
Disassembles ten more instructions before the last disassembly.
record instruction-history begin, end-
Disassembles instructions beginning with instruction number
begin until instruction number end. The instruction
number end is included.
This command may not be available for all recording methods.
set record instruction-history-size sizeset record instruction-history-size unlimited-
Define how many instructions to disassemble in the
recordcommand. The default value is 10.
instruction-history
A size ofunlimitedmeans unlimited instructions. show record instruction-history-size-
Show how many instructions to disassemble in the
recordcommand.
instruction-history record function-call-history-
Prints the execution history at function granularity. For each sequence
of instructions that belong to the same function, it prints the name of
that function, the source lines for this instruction sequence (if the
/lmodifier is specified), and the instructions numbers that form
the sequence (if the/imodifier is specified). The function names
are indented to reflect the call stack depth if the/cmodifier is
specified. The/l,/i, and/cmodifiers can be given
together.(gdb) list 1, 10 1 void foo (void) 2 { 3 } 4 5 void bar (void) 6 { 7 ... 8 foo (); 9 ... 10 } (gdb) record function-call-history /ilc 1 bar inst 1,4 at foo.c:6,8 2 foo inst 5,10 at foo.c:2,3 3 bar inst 11,13 at foo.c:9,10By default, ten functions are printed. This can be changed using the
set record function-call-history-sizecommand. Functions are
printed in execution order. There are several ways to specify what
to print:record function-call-history func-
Prints ten functions starting from function number func.
record function-call-history func, +/-n-
Prints n functions around function number func. If
n is preceded with+, prints n functions after
function number func. If n is preceded with-,
prints n functions before function number func. record function-call-history-
Prints ten more functions after the last ten-function print.
record function-call-history --
Prints ten more functions before the last ten-function print.
record function-call-history begin, end-
Prints functions beginning with function number begin until
function number end. The function number end is included.
This command may not be available for all recording methods.
set record function-call-history-size sizeset record function-call-history-size unlimited-
Define how many functions to print in the
record function-call-historycommand. The default value is 10.
A size ofunlimitedmeans unlimited functions. show record function-call-history-size-
Show how many functions to print in the
record function-call-historycommand.
8 Examining the Stack
When your program has stopped, the first thing you need to know is where it
stopped and how it got there.
Each time your program performs a function call, information about the call
is generated.
That information includes the location of the call in your program,
the arguments of the call,
and the local variables of the function being called.
The information is saved in a block of data called a stack frame.
The stack frames are allocated in a region of memory called the call
stack.
When your program stops, the GDB commands for examining the
stack allow you to see all of this information.
One of the stack frames is selected by GDB and many
GDB commands refer implicitly to the selected frame. In
particular, whenever you ask GDB for the value of a variable in
your program, the value is found in the selected frame. There are
special GDB commands to select whichever frame you are
interested in. See Selecting a Frame.
When your program stops, GDB automatically selects the
currently executing frame and describes it briefly, similar to the
frame command (see Information about a Frame).
8.1 Stack Frames
The call stack is divided up into contiguous pieces called stack
frames, or frames for short; each frame is the data associated
with one call to one function. The frame contains the arguments given
to the function, the function’s local variables, and the address at
which the function is executing.
When your program is started, the stack has only one frame, that of the
function main. This is called the initial frame or the
outermost frame. Each time a function is called, a new frame is
made. Each time a function returns, the frame for that function invocation
is eliminated. If a function is recursive, there can be many frames for
the same function. The frame for the function in which execution is
actually occurring is called the innermost frame. This is the most
recently created of all the stack frames that still exist.
Inside your program, stack frames are identified by their addresses. A
stack frame consists of many bytes, each of which has its own address; each
kind of computer has a convention for choosing one byte whose
address serves as the address of the frame. Usually this address is kept
in a register called the frame pointer register
(see $fp) while execution is going on in that frame.
GDB labels each existing stack frame with a level, a
number that is zero for the innermost frame, one for the frame that
called it, and so on upward. These level numbers give you a way of
designating stack frames in GDB commands. The terms
frame number and frame level can be used interchangeably to
describe this number.
Some compilers provide a way to compile functions so that they operate
without stack frames. (For example, the GCC option
generates functions without a frame.)
This is occasionally done with heavily used library functions to save
the frame setup time. GDB has limited facilities for dealing
with these function invocations. If the innermost function invocation
has no stack frame, GDB nevertheless regards it as though
it had a separate frame, which is numbered zero as usual, allowing
correct tracing of the function call chain. However, GDB has
no provision for frameless functions elsewhere in the stack.
8.2 Backtraces
A backtrace is a summary of how your program got where it is. It shows one
line per frame, for many frames, starting with the currently executing
frame (frame zero), followed by its caller (frame one), and on up the
stack.
To print a backtrace of the entire stack, use the backtrace
command, or its alias bt. This command will print one line per
frame for frames in the stack. By default, all stack frames are
printed. You can stop the backtrace at any time by typing the system
interrupt character, normally Ctrl-c.
backtrace [option]… [qualifier]… [count]bt [option]… [qualifier]… [count]-
Print the backtrace of the entire stack.
The optional count can be one of the following:
nn-
Print only the innermost n frames, where n is a positive
number. -n-n-
Print only the outermost n frames, where n is a positive
number.
Options:
-full-
Print the values of the local variables also. This can be combined
with the optional count to limit the number of frames shown. -no-filters-
Do not run Python frame filters on this backtrace. See Frame Filter API, for more information. Additionally use disable frame-filter all to turn off all frame filters. This is only
relevant when GDB has been configured withPython
support. -hide-
A Python frame filter might decide to “elide” some frames. Normally
such elided frames are still printed, but they are indented relative
to the filtered frames that cause them to be elided. The-hide
option causes elided frames to not be printed at all.
The
backtracecommand also supports a number of options that
allow overriding relevant global print settings as set bysetand
backtraceset printsubcommands:-past-main [on|off]-
Set whether backtraces should continue past
main. Related setting:
set backtrace past-main. -past-entry [on|off]-
Set whether backtraces should continue past the entry point of a program.
Related setting: set backtrace past-entry. -entry-valuesno|only|preferred|if-needed|both|compact|default-
Set printing of function arguments at function entry.
Related setting: set print entry-values. -frame-argumentsall|scalars|none-
Set printing of non-scalar frame arguments.
Related setting: set print frame-arguments. -raw-frame-arguments [on|off]-
Set whether to print frame arguments in raw form.
Related setting: set print raw-frame-arguments. -frame-infoauto|source-line|location|source-and-location|location-and-address|short-location-
Set printing of frame information.
Related setting: set print frame-info.
The optional qualifier is maintained for backward compatibility.
It can be one of the following:full-
Equivalent to the
-fulloption. no-filters-
Equivalent to the
-no-filtersoption. hide-
Equivalent to the
-hideoption.
The names where and info stack (abbreviated info s)
are additional aliases for backtrace.
In a multi-threaded program, GDB by default shows the
backtrace only for the current thread. To display the backtrace for
several or all of the threads, use the command thread apply
(see thread apply). For example, if you type thread
apply all backtrace, GDB will display the backtrace for all
the threads; this is handy when you debug a core dump of a
multi-threaded program.
Each line in the backtrace shows the frame number and the function name.
The program counter value is also shown—unless you use set. The backtrace also shows the source file name and
print address off
line number, as well as the arguments to the function. The program
counter value is omitted if it is at the beginning of the code for that
line number.
Here is an example of a backtrace. It was made with the command
‘bt 3’, so it shows the innermost three frames.
#0 m4_traceon (obs=0x24eb0, argc=1, argv=0x2b8c8)
at builtin.c:993
#1 0x6e38 in expand_macro (sym=0x2b600, data=...) at macro.c:242
#2 0x6840 in expand_token (obs=0x0, t=177664, td=0xf7fffb08)
at macro.c:71
(More stack frames follow...)
The display for frame zero does not begin with a program counter
value, indicating that your program has stopped at the beginning of the
code for line 993 of builtin.c.
The value of parameter data in frame 1 has been replaced by
…. By default, GDB prints the value of a parameter
only if it is a scalar (integer, pointer, enumeration, etc). See command
set print frame-arguments in Print Settings for more details
on how to configure the way function parameter values are printed.
The command set print frame-info (see Print Settings) controls
what frame information is printed.
If your program was compiled with optimizations, some compilers will
optimize away arguments passed to functions if those arguments are
never used after the call. Such optimizations generate code that
passes arguments through registers, but doesn’t store those arguments
in the stack frame. GDB has no way of displaying such
arguments in stack frames other than the innermost one. Here’s what
such a backtrace might look like:
#0 m4_traceon (obs=0x24eb0, argc=1, argv=0x2b8c8)
at builtin.c:993
#1 0x6e38 in expand_macro (sym=<optimized out>) at macro.c:242
#2 0x6840 in expand_token (obs=0x0, t=<optimized out>, td=0xf7fffb08)
at macro.c:71
(More stack frames follow...)
The values of arguments that were not saved in their stack frames are
shown as ‘<optimized out>’.
If you need to display the values of such optimized-out arguments,
either deduce that from other variables whose values depend on the one
you are interested in, or recompile without optimizations.
Most programs have a standard user entry point—a place where system
libraries and startup code transition into user code. For C this is
main9.
When GDB finds the entry function in a backtrace
it will terminate the backtrace, to avoid tracing into highly
system-specific (and generally uninteresting) code.
If you need to examine the startup code, or limit the number of levels
in a backtrace, you can change this behavior:
set backtrace past-mainset backtrace past-main on-
Backtraces will continue past the user entry point.
set backtrace past-main off-
Backtraces will stop when they encounter the user entry point. This is the
default. show backtrace past-main-
Display the current user entry point backtrace policy.
set backtrace past-entryset backtrace past-entry on-
Backtraces will continue past the internal entry point of an application.
This entry point is encoded by the linker when the application is built,
and is likely before the user entry pointmain(or equivalent) is called. set backtrace past-entry off-
Backtraces will stop when they encounter the internal entry point of an
application. This is the default. show backtrace past-entry-
Display the current internal entry point backtrace policy.
set backtrace limit nset backtrace limit 0set backtrace limit unlimited-
Limit the backtrace to n levels. A value of
unlimited
or zero means unlimited levels. show backtrace limit-
Display the current limit on backtrace levels.
You can control how file names are displayed.
set filename-displayset filename-display relative-
Display file names relative to the compilation directory. This is the default.
set filename-display basename-
Display only basename of a filename.
set filename-display absolute-
Display an absolute filename.
show filename-display-
Show the current way to display filenames.
8.3 Selecting a Frame
Most commands for examining the stack and other data in your program work on
whichever stack frame is selected at the moment. Here are the commands for
selecting a stack frame; all of them finish by printing a brief description
of the stack frame just selected.
frame [ frame-selection-spec ]f [ frame-selection-spec ]-
The
framecommand allows different stack frames to be
selected. The frame-selection-spec can be any of the following:numlevel num-
Select frame level num. Recall that frame zero is the innermost
(currently executing) frame, frame one is the frame that called the
innermost one, and so on. The highest level frame is usually the one
formain.As this is the most common method of navigating the frame stack, the
stringlevelcan be omitted. For example, the following two
commands are equivalent:(gdb) frame 3 (gdb) frame level 3
address stack-address-
Select the frame with stack address stack-address. The
stack-address for a frame can be seen in the output of
info frame, for example:(gdb) info frame Stack level 1, frame at 0x7fffffffda30: rip = 0x40066d in b (amd64-entry-value.cc:59); saved rip 0x4004c5 tail call frame, caller of frame at 0x7fffffffda30 source language c++. Arglist at unknown address. Locals at unknown address, Previous frame's sp is 0x7fffffffda30
The stack-address for this frame is
0x7fffffffda30as
indicated by the line:Stack level 1, frame at 0x7fffffffda30:
function function-name-
Select the stack frame for function function-name. If there are
multiple stack frames for function function-name then the inner
most stack frame is selected. view stack-address [ pc-addr ]-
View a frame that is not part of GDB’s backtrace. The frame
viewed has stack address stack-addr, and optionally, a program
counter address of pc-addr.This is useful mainly if the chaining of stack frames has been
damaged by a bug, making it impossible for GDB to assign
numbers properly to all frames. In addition, this can be useful
when your program has multiple stacks and switches between them.When viewing a frame outside the current backtrace using
frame viewthen you can always return to the original
stack using one of the previous stack frame selection instructions,
for exampleframe level 0.
up n-
Move n frames up the stack; n defaults to 1. For positive
numbers n, this advances toward the outermost frame, to higher
frame numbers, to frames that have existed longer. down n-
Move n frames down the stack; n defaults to 1. For
positive numbers n, this advances toward the innermost frame, to
lower frame numbers, to frames that were created more recently.
You may abbreviatedownasdo.
All of these commands end by printing two lines of output describing the
frame. The first line shows the frame number, the function name, the
arguments, and the source file and line number of execution in that
frame. The second line shows the text of that source line.
For example:
(gdb) up
#1 0x22f0 in main (argc=1, argv=0xf7fffbf4, env=0xf7fffbfc)
at env.c:10
10 read_input_file (argv[i]);
After such a printout, the list command with no arguments
prints ten lines centered on the point of execution in the frame.
You can also edit the program at the point of execution with your favorite
editing program by typing edit.
See Printing Source Lines,
for details.
select-frame [ frame-selection-spec ]-
The
select-framecommand is a variant offramethat does
not display the new frame after selecting it. This command is
intended primarily for use in GDB command scripts, where the
output might be unnecessary and distracting. The
frame-selection-spec is as for theframecommand
described in Selecting a Frame. up-silently ndown-silently n-
These two commands are variants of
upanddown,
respectively; they differ in that they do their work silently, without
causing display of the new frame. They are intended primarily for use
in GDB command scripts, where the output might be unnecessary and
distracting.
8.4 Information About a Frame
There are several other commands to print information about the selected
stack frame.
framef-
When used without any argument, this command does not change which
frame is selected, but prints a brief description of the currently
selected stack frame. It can be abbreviatedf. With an
argument, this command is used to select a stack frame.
See Selecting a Frame. info frameinfo f-
This command prints a verbose description of the selected stack frame,
including:- the address of the frame
- the address of the next frame down (called by this frame)
- the address of the next frame up (caller of this frame)
- the language in which the source code corresponding to this frame is written
- the address of the frame’s arguments
- the address of the frame’s local variables
- the program counter saved in it (the address of execution in the caller frame)
- which registers were saved in the frame
The verbose description is useful when
something has gone wrong that has made the stack format fail to fit
the usual conventions. info frame [ frame-selection-spec ]info f [ frame-selection-spec ]-
Print a verbose description of the frame selected by
frame-selection-spec. The frame-selection-spec is the
same as for theframecommand (see Selecting
a Frame). The selected frame remains unchanged by this command. info args [-q]-
Print the arguments of the selected frame, each on a separate line.
The optional flag ‘-q’, which stands for ‘quiet’, disables
printing header information and messages explaining why no argument
have been printed. info args [-q] [-t type_regexp] [regexp]-
Like info args, but only print the arguments selected
with the provided regexp(s).If regexp is provided, print only the arguments whose names
match the regular expression regexp.If type_regexp is provided, print only the arguments whose
types, as printed by thewhatiscommand, match
the regular expression type_regexp.
If type_regexp contains space(s), it should be enclosed in
quote characters. If needed, use backslash to escape the meaning
of special characters or quotes.If both regexp and type_regexp are provided, an argument
is printed only if its name matches regexp and its type matches
type_regexp. info locals [-q]-
Print the local variables of the selected frame, each on a separate
line. These are all variables (declared either static or automatic)
accessible at the point of execution of the selected frame.The optional flag ‘-q’, which stands for ‘quiet’, disables
printing header information and messages explaining why no local variables
have been printed. info locals [-q] [-t type_regexp] [regexp]-
Like info locals, but only print the local variables selected
with the provided regexp(s).If regexp is provided, print only the local variables whose names
match the regular expression regexp.If type_regexp is provided, print only the local variables whose
types, as printed by thewhatiscommand, match
the regular expression type_regexp.
If type_regexp contains space(s), it should be enclosed in
quote characters. If needed, use backslash to escape the meaning
of special characters or quotes.If both regexp and type_regexp are provided, a local variable
is printed only if its name matches regexp and its type matches
type_regexp.The command info locals -q -t type_regexp can usefully be
combined with the commands frame apply and thread apply.
For example, your program might use Resource Acquisition Is
Initialization types (RAII) such aslock_something_t: each
local variable of typelock_something_tautomatically places a
lock that is destroyed when the variable goes out of scope. You can
then list all acquired locks in your program by doingthread apply all -s frame apply all -s info locals -q -t lock_something_t
or the equivalent shorter form
tfaas i lo -q -t lock_something_t
8.5 Applying a Command to Several Frames.
frame apply [all | count | -count | level level…] [option]… command-
The
frame applycommand allows you to apply the named
command to one or more frames.all-
Specify
allto apply command to all frames. count-
Use count to apply command to the innermost count
frames, where count is a positive number. -count-
Use -count to apply command to the outermost count
frames, where count is a positive number. level-
Use
levelto apply command to the set of frames identified
by the level list. level is a frame level or a range of frame
levels as level1—level2. The frame level is the number shown
in the first field of the ‘backtrace’ command output.
E.g., ‘2-4 6-8 3’ indicates to apply command for the frames
at levels 2, 3, 4, 6, 7, 8, and then again on frame at level 3.
Note that the frames on which
frame applyapplies a command are
also influenced by theset backtracesettings such assetand
backtrace past-mainset backtrace limit N.
See Backtraces.The
frame applycommand also supports a number of options that
allow overriding relevantset backtracesettings:-past-main [on|off]-
Whether backtraces should continue past
main.
Related setting: set backtrace past-main. -past-entry [on|off]-
Whether backtraces should continue past the entry point of a program.
Related setting: set backtrace past-entry.
By default, GDB displays some frame information before the
output produced by command, and an error raised during the
execution of a command will abortframe apply. The
following options can be used to fine-tune these behaviors:-c-
The flag
-c, which stands for ‘continue’, causes any
errors in command to be displayed, and the execution of
frame applythen continues. -s-
The flag
-s, which stands for ‘silent’, causes any errors
or empty output produced by a command to be silently ignored.
That is, the execution continues, but the frame information and errors
are not printed. -q-
The flag
-q(‘quiet’) disables printing the frame
information.
The following example shows how the flags
-cand-sare
working when applying the commandp jto all frames, where
variablejcan only be successfully printed in the outermost
#1 mainframe.(gdb) frame apply all p j #0 some_function (i=5) at fun.c:4 No symbol "j" in current context. (gdb) frame apply all -c p j #0 some_function (i=5) at fun.c:4 No symbol "j" in current context. #1 0x565555fb in main (argc=1, argv=0xffffd2c4) at fun.c:11 $1 = 5 (gdb) frame apply all -s p j #1 0x565555fb in main (argc=1, argv=0xffffd2c4) at fun.c:11 $2 = 5 (gdb)
By default, ‘frame apply’, prints the frame location
information before the command output:(gdb) frame apply all p $sp #0 some_function (i=5) at fun.c:4 $4 = (void *) 0xffffd1e0 #1 0x565555fb in main (argc=1, argv=0xffffd2c4) at fun.c:11 $5 = (void *) 0xffffd1f0 (gdb)
If the flag
-qis given, no frame information is printed:(gdb) frame apply all -q p $sp $12 = (void *) 0xffffd1e0 $13 = (void *) 0xffffd1f0 (gdb)
faas command-
Shortcut for
frame apply all -s command.
Applies command on all frames, ignoring errors and empty output.It can for example be used to print a local variable or a function
argument without knowing the frame where this variable or argument
is, using:(gdb) faas p some_local_var_i_do_not_remember_where_it_is
The
faascommand accepts the same options as theframecommand. See frame apply.
applyNote that the command
tfaas commandapplies command
on all frames of all threads. See See Threads.
8.6 Management of Frame Filters.
Frame filters are Python based utilities to manage and decorate the
output of frames. See Frame Filter API, for further information.
Managing frame filters is performed by several commands available
within GDB, detailed here.
info frame-filter-
Print a list of installed frame filters from all dictionaries, showing
their name, priority and enabled status. disable frame-filter filter-dictionary filter-name-
Disable a frame filter in the dictionary matching
filter-dictionary and filter-name. The
filter-dictionary may beall,global,
progspace, or the name of the object file where the frame filter
dictionary resides. Whenallis specified, all frame filters
across all dictionaries are disabled. The filter-name is the name
of the frame filter and is used whenallis not the option for
filter-dictionary. A disabled frame-filter is not deleted, it
may be enabled again later. enable frame-filter filter-dictionary filter-name-
Enable a frame filter in the dictionary matching
filter-dictionary and filter-name. The
filter-dictionary may beall,global,
progspaceor the name of the object file where the frame filter
dictionary resides. Whenallis specified, all frame filters across
all dictionaries are enabled. The filter-name is the name of the frame
filter and is used whenallis not the option for
filter-dictionary.Example:
(gdb) info frame-filter global frame-filters: Priority Enabled Name 1000 No PrimaryFunctionFilter 100 Yes Reverse progspace /build/test frame-filters: Priority Enabled Name 100 Yes ProgspaceFilter objfile /build/test frame-filters: Priority Enabled Name 999 Yes BuildProgramFilter (gdb) disable frame-filter /build/test BuildProgramFilter (gdb) info frame-filter global frame-filters: Priority Enabled Name 1000 No PrimaryFunctionFilter 100 Yes Reverse progspace /build/test frame-filters: Priority Enabled Name 100 Yes ProgspaceFilter objfile /build/test frame-filters: Priority Enabled Name 999 No BuildProgramFilter (gdb) enable frame-filter global PrimaryFunctionFilter (gdb) info frame-filter global frame-filters: Priority Enabled Name 1000 Yes PrimaryFunctionFilter 100 Yes Reverse progspace /build/test frame-filters: Priority Enabled Name 100 Yes ProgspaceFilter objfile /build/test frame-filters: Priority Enabled Name 999 No BuildProgramFilter
set frame-filter priority filter-dictionary filter-name priority-
Set the priority of a frame filter in the dictionary matching
filter-dictionary, and the frame filter name matching
filter-name. The filter-dictionary may beglobal,
progspaceor the name of the object file where the frame filter
dictionary resides. The priority is an integer. show frame-filter priority filter-dictionary filter-name-
Show the priority of a frame filter in the dictionary matching
filter-dictionary, and the frame filter name matching
filter-name. The filter-dictionary may beglobal,
progspaceor the name of the object file where the frame filter
dictionary resides.Example:
(gdb) info frame-filter global frame-filters: Priority Enabled Name 1000 Yes PrimaryFunctionFilter 100 Yes Reverse progspace /build/test frame-filters: Priority Enabled Name 100 Yes ProgspaceFilter objfile /build/test frame-filters: Priority Enabled Name 999 No BuildProgramFilter (gdb) set frame-filter priority global Reverse 50 (gdb) info frame-filter global frame-filters: Priority Enabled Name 1000 Yes PrimaryFunctionFilter 50 Yes Reverse progspace /build/test frame-filters: Priority Enabled Name 100 Yes ProgspaceFilter objfile /build/test frame-filters: Priority Enabled Name 999 No BuildProgramFilter
9 Examining Source Files
GDB can print parts of your program’s source, since the debugging
information recorded in the program tells GDB what source files were
used to build it. When your program stops, GDB spontaneously prints
the line where it stopped. Likewise, when you select a stack frame
(see Selecting a Frame), GDB prints the line where
execution in that frame has stopped. You can print other portions of
source files by explicit command.
If you use GDB through its GNU Emacs interface, you may
prefer to use Emacs facilities to view source; see Using
GDB under GNU Emacs.
9.1 Printing Source Lines
To print lines from a source file, use the list command
(abbreviated l). By default, ten lines are printed.
There are several ways to specify what part of the file you want to
print; see Location Specifications, for the full list.
Here are the forms of the list command most commonly used:
list linenum-
Print lines centered around line number linenum in the
current source file. list function-
Print lines centered around the beginning of function
function. list-
Print more lines. If the last lines printed were printed with a
listcommand, this prints lines following the last lines
printed; however, if the last line printed was a solitary line printed
as part of displaying a stack frame (see Examining the
Stack), this prints lines centered around that line. list --
Print lines just before the lines last printed.
By default, GDB prints ten source lines with any of these forms of
the list command. You can change this using set listsize:
set listsize countset listsize unlimited-
Make the
listcommand display count source lines (unless
thelistargument explicitly specifies some other number).
Setting count tounlimitedor 0 means there’s no limit. show listsize-
Display the number of lines that
listprints.
Repeating a list command with RET discards the argument,
so it is equivalent to typing just list. This is more useful
than listing the same lines again. An exception is made for an
argument of ‘—’; that argument is preserved in repetition so that
each repetition moves up in the source file.
In general, the list command expects you to supply zero, one or
two location specs. These location specs are interpreted to resolve
to source code lines; there are several ways of writing them
(see Location Specifications), but the effect is always to resolve
to some source lines to display.
Here is a complete description of the possible arguments for list:
list locspec-
Print lines centered around the line or lines of all the code
locations that result from resolving locspec. list first,last-
Print lines from first to last. Both arguments are
location specs. When alistcommand has two location specs,
and the source file of the second location spec is omitted, this
refers to the same source file as the first location spec. If either
first or last resolve to more than one source line in the
program, then the list command shows the list of resolved source
lines and does not proceed with the source code listing. list ,last-
Print lines ending with last.
Likewise, if last resolves to more than one source line in the
program, then the list command prints the list of resolved source
lines and does not proceed with the source code listing. list first,-
Print lines starting with first.
list +-
Print lines just after the lines last printed.
list --
Print lines just before the lines last printed.
list-
As described in the preceding table.
9.2 Location Specifications
Several GDB commands accept arguments that specify a location
or locations of your program’s code. Many times locations are
specified using a source line number, but they can also be specified
by a function name, an address, a label, etc. The different
forms of specifying a location that GDB recognizes are
collectively known as forms of location specification, or
location spec. This section documents the forms of specifying
locations that GDB recognizes.
When you specify a location, GDB needs to find the place in
your program, known as code location, that corresponds to the
given location spec. We call this process of finding actual code
locations corresponding to a location spec location resolution.
A concrete code location in your program is uniquely identifiable by a
set of several attributes: its source line number, the name of its
source file, the fully-qualified and prototyped function in which it
is defined, and an instruction address. Because each inferior has its
own address space, the inferior number is also a necessary part of
these attributes.
By contrast, location specs you type will many times omit some of
these attributes. For example, it is customary to specify just the
source line number to mean a line in the current source file, or
specify just the basename of the file, omitting its directories. In
other words, a location spec is usually incomplete, a kind of
blueprint, and GDB needs to complete the missing attributes
by using the implied defaults, and by considering the source code and
the debug information available to it. This is what location
resolution is about.
The resolution of an incomplete location spec can produce more than a
single code location, if the spec doesn’t allow distinguishing between
them. Here are some examples of situations that result in a location
spec matching multiple code locations in your program:
- The location spec specifies a function name, and there are several
functions in the program which have that name. (To distinguish
between them, you can specify a fully-qualified and prototyped
function name, such asA::func(int)instead of just
func.) - The location spec specifies a source file name, and there are several
source files in the program that share the same name, for example
several files with the same basename in different subdirectories. (To
distinguish between them, specify enough leading directories with the
file name.) - For a C++ constructor, the GCC compiler generates several
instances of the function body, used in different cases, but their
source-level names are identical. - For a C++ template function, a given line in the function can
correspond to any number of instantiations. - For an inlined function, a given source line can correspond to several
actual code locations with that function’s inlined code.
Resolution of a location spec can also fail to produce a complete code
location, or even fail to produce any code location. Here are some
examples of such situations:
- Some parts of the program lack detailed enough debug info, so the
resolved code location lacks some attributes, like source file name
and line number, leaving just the instruction address and perhaps also
a function name. Such an incomplete code location is only usable in
contexts that work with addresses and/or function names. Some
commands can only work with complete code locations. - The location spec specifies a function name, and there are no
functions in the program by that name, or they only exist in a
yet-unloaded shared library. - The location spec specifies a source file name, and there are no
source files in the program by that name, or they only exist in a
yet-unloaded shared library. - The location spec specifies both a source file name and a source line
number, and even though there are source files in the program that
match the file name, none of those files has the specified line
number.
Locations may be specified using three different formats: linespec
locations, explicit locations, or address locations. The following
subsections describe these formats.
9.2.1 Linespec Locations
A linespec is a colon-separated list of source location parameters such
as file name, function name, etc. Here are all the different ways of
specifying a linespec:
linenum-
Specifies the line number linenum of the current source file.
-offset+offset-
Specifies the line offset lines before or after the current
line. For thelistcommand, the current line is the last one
printed; for the breakpoint commands, this is the line at which
execution stopped in the currently selected stack frame
(see Frames, for a description of stack frames.) When
used as the second of the two linespecs in alistcommand,
this specifies the line offset lines up or down from the first
linespec. filename:linenum-
Specifies the line linenum in the source file filename.
If filename is a relative file name, then it will match any
source file name with the same trailing components. For example, if
filename is ‘gcc/expr.c’, then it will match source file
name of /build/trunk/gcc/expr.c, but not
/build/trunk/libcpp/expr.c or /build/trunk/gcc/x-expr.c. function-
Specifies the line that begins the body of the function function.
For example, in C, this is the line with the open brace.By default, in C++ and Ada, function is interpreted as
specifying all functions named function in all scopes. For
C++, this means in all namespaces and classes. For Ada, this
means in all packages.For example, assuming a program with C++ symbols named
A::B::funcandB::func, both commands break func and break B::func set a breakpoint on both symbols.Commands that accept a linespec let you override this with the
-qualifiedoption. For example, break -qualified func sets a breakpoint on a free-function namedfuncignoring
any C++ class methods and namespace functions calledfunc.See Explicit Locations.
function:label-
Specifies the line where label appears in function.
filename:function-
Specifies the line that begins the body of the function function
in the file filename. You only need the file name with a
function name to avoid ambiguity when there are identically named
functions in different source files. label-
Specifies the line at which the label named label appears
in the function corresponding to the currently selected stack frame.
If there is no current selected stack frame (for instance, if the inferior
is not running), then GDB will not search for a label. -pstap|-probe-stap [objfile:[provider:]]name-
The GNU/Linux tool
SystemTapprovides a way for
applications to embed static probes. See Static Probe Points, for more
information on finding and using static probes. This form of linespec
specifies the location of such a static probe.If objfile is given, only probes coming from that shared library
or executable matching objfile as a regular expression are considered.
If provider is given, then only probes from that provider are considered.
If several probes match the spec, GDB will insert a breakpoint at
each one of those probes.
9.2.2 Explicit Locations
Explicit locations allow the user to directly specify the source
location’s parameters using option-value pairs.
Explicit locations are useful when several functions, labels, or
file names have the same name (base name for files) in the program’s
sources. In these cases, explicit locations point to the source
line you meant more accurately and unambiguously. Also, using
explicit locations might be faster in large programs.
For example, the linespec ‘foo:bar’ may refer to a function bar
defined in the file named foo or the label bar in a function
named foo. GDB must search either the file system or
the symbol table to know.
The list of valid explicit location options is summarized in the
following table:
-source filename-
The value specifies the source file name. To differentiate between
files with the same base name, prepend as many directories as is necessary
to uniquely identify the desired file, e.g., foo/bar/baz.c. Otherwise
GDB will use the first file it finds with the given base
name. This option requires the use of either-functionor-line. -function function-
The value specifies the name of a function. Operations
on function locations unmodified by other options (such as-label
or-line) refer to the line that begins the body of the function.
In C, for example, this is the line with the open brace.By default, in C++ and Ada, function is interpreted as
specifying all functions named function in all scopes. For
C++, this means in all namespaces and classes. For Ada, this
means in all packages.For example, assuming a program with C++ symbols named
A::B::funcandB::func, both commands break -function func and break -function B::func set a
breakpoint on both symbols.You can use the -qualified flag to override this (see below).
-qualified-
This flag makes GDB interpret a function name specified with
-function as a complete fully-qualified name.For example, assuming a C++ program with symbols named
A::B::funcandB::func, the break -qualified -function B::func command sets a breakpoint onB::func, only.(Note: the -qualified option can precede a linespec as well
(see Linespec Locations), so the particular example above could be
simplified as break -qualified B::func.) -label label-
The value specifies the name of a label. When the function
name is not specified, the label is searched in the function of the currently
selected stack frame. -line number-
The value specifies a line offset for the location. The offset may either
be absolute (-line 3) or relative (-line +3), depending on
the command. When specified without any other options, the line offset is
relative to the current line.
Explicit location options may be abbreviated by omitting any non-unique
trailing characters from the option name, e.g., break -s main.c -li 3.
9.2.3 Address Locations
Address locations indicate a specific program address. They have
the generalized form *address.
For line-oriented commands, such as list and edit, this
specifies a source line that contains address. For break and
other breakpoint-oriented commands, this can be used to set breakpoints in
parts of your program which do not have debugging information or
source files.
Here address may be any expression valid in the current working
language (see working language) that specifies a code
address. In addition, as a convenience, GDB extends the
semantics of expressions used in locations to cover several situations
that frequently occur during debugging. Here are the various forms
of address:
expression-
Any expression valid in the current working language.
funcaddr-
An address of a function or procedure derived from its name. In C,
C++, Objective-C, Fortran, minimal, and assembly, this is
simply the function’s name function (and actually a special case
of a valid expression). In Pascal and Modula-2, this is
&function. In Ada, this isfunction'Address
(although the Pascal form also works).This form specifies the address of the function’s first instruction,
before the stack frame and arguments have been set up. 'filename':funcaddr-
Like funcaddr above, but also specifies the name of the source
file explicitly. This is useful if the name of the function does not
specify the function unambiguously, e.g., if there are several
functions with identical names in different source files.
9.3 Editing Source Files
To edit the lines in a source file, use the edit command.
The editing program of your choice
is invoked with the current line set to
the active line in the program.
Alternatively, there are several ways to specify what part of the file you
want to print if you want to see other parts of the program:
edit locspec-
Edit the source file of the code location that results from resolving
locspec. Editing starts at the source file and source line
locspecresolves to.
See Location Specifications, for all the possible forms of the
locspec argument.If
locspecresolves to more than one source line in your
program, then the command prints the list of resolved source lines and
does not proceed with the editing.Here are the forms of the
editcommand most commonly used:edit number-
Edit the current source file with number as the active line number.
edit function-
Edit the file containing function at the beginning of its definition.
9.3.1 Choosing your Editor
You can customize GDB to use any editor you want
10.
By default, it is /bin/ex, but you can change this
by setting the environment variable EDITOR before using
GDB. For example, to configure GDB to use the
vi editor, you could use these commands with the sh shell:
EDITOR=/usr/bin/vi export EDITOR gdb …
or in the csh shell,
setenv EDITOR /usr/bin/vi gdb …
9.4 Searching Source Files
There are two commands for searching through the current source file for a
regular expression.
forward-search regexpsearch regexp-
The command ‘forward-search regexp’ checks each line,
starting with the one following the last line listed, for a match for
regexp. It lists the line that is found. You can use the
synonym ‘search regexp’ or abbreviate the command name as
fo. reverse-search regexp-
The command ‘reverse-search regexp’ checks each line, starting
with the one before the last line listed and going backward, for a match
for regexp. It lists the line that is found. You can abbreviate
this command asrev.
9.5 Specifying Source Directories
Executable programs sometimes do not record the directories of the source
files from which they were compiled, just the names. Even when they do,
the directories could be moved between the compilation and your debugging
session. GDB has a list of directories to search for source files;
this is called the source path. Each time GDB wants a source file,
it tries all the directories in the list, in the order they are present
in the list, until it finds a file with the desired name.
For example, suppose an executable references the file
/usr/src/foo-1.0/lib/foo.c, does not record a compilation
directory, and the source path is /mnt/cross.
GDB would look for the source file in the following
locations:
- /usr/src/foo-1.0/lib/foo.c
- /mnt/cross/usr/src/foo-1.0/lib/foo.c
- /mnt/cross/foo.c
If the source file is not present at any of the above locations then
an error is printed. GDB does not look up the parts of the
source file name, such as /mnt/cross/src/foo-1.0/lib/foo.c.
Likewise, the subdirectories of the source path are not searched: if
the source path is /mnt/cross, and the binary refers to
foo.c, GDB would not find it under
/mnt/cross/usr/src/foo-1.0/lib.
Plain file names, relative file names with leading directories, file
names containing dots, etc. are all treated as described above,
except that non-absolute file names are not looked up literally. If
the source path is /mnt/cross, the source file is
recorded as ../lib/foo.c, and no compilation directory is
recorded, then GDB will search in the following locations:
- /mnt/cross/../lib/foo.c
- /mnt/cross/foo.c
The source path will always include two special entries
‘$cdir’ and ‘$cwd’, these refer to the compilation directory
(if one is recorded) and the current working directory respectively.
‘$cdir’ causes GDB to search within the compilation
directory, if one is recorded in the debug information. If no
compilation directory is recorded in the debug information then
‘$cdir’ is ignored.
‘$cwd’ is not the same as ‘.’—the former tracks the
current working directory as it changes during your GDB
session, while the latter is immediately expanded to the current
directory at the time you add an entry to the source path.
If a compilation directory is recorded in the debug information, and
GDB has not found the source file after the first search
using source path, then GDB will combine the
compilation directory and the filename, and then search for the source
file again using the source path.
For example, if the executable records the source file as
/usr/src/foo-1.0/lib/foo.c, the compilation directory is
recorded as /project/build, and the source path is
/mnt/cross:$cdir:$cwd while the current working directory of
the GDB session is /home/user, then GDB will
search for the source file in the following locations:
- /usr/src/foo-1.0/lib/foo.c
- /mnt/cross/usr/src/foo-1.0/lib/foo.c
- /project/build/usr/src/foo-1.0/lib/foo.c
- /home/user/usr/src/foo-1.0/lib/foo.c
- /mnt/cross/project/build/usr/src/foo-1.0/lib/foo.c
- /project/build/project/build/usr/src/foo-1.0/lib/foo.c
- /home/user/project/build/usr/src/foo-1.0/lib/foo.c
- /mnt/cross/foo.c
- /project/build/foo.c
- /home/user/foo.c
If the file name in the previous example had been recorded in the
executable as a relative path rather than an absolute path, then the
first look up would not have occurred, but all of the remaining steps
would be similar.
When searching for source files on MS-DOS and MS-Windows, where
absolute paths start with a drive letter (e.g.
C:/project/foo.c), GDB will remove the drive letter
from the file name before appending it to a search directory from
source path; for instance if the executable references the
source file C:/project/foo.c and source path is set to
D:/mnt/cross, then GDB will search in the following
locations for the source file:
- C:/project/foo.c
- D:/mnt/cross/project/foo.c
- D:/mnt/cross/foo.c
Note that the executable search path is not used to locate the
source files.
Whenever you reset or rearrange the source path, GDB clears out
any information it has cached about where source files are found and where
each line is in the file.
When you start GDB, its source path includes only ‘$cdir’
and ‘$cwd’, in that order.
To add other directories, use the directory command.
The search path is used to find both program source files and GDB
script files (read using the ‘-command’ option and ‘source’ command).
In addition to the source path, GDB provides a set of commands
that manage a list of source path substitution rules. A substitution
rule specifies how to rewrite source directories stored in the program’s
debug information in case the sources were moved to a different
directory between compilation and debugging. A rule is made of
two strings, the first specifying what needs to be rewritten in
the path, and the second specifying how it should be rewritten.
In set substitute-path, we name these two parts from and
to respectively. GDB does a simple string replacement
of from with to at the start of the directory part of the
source file name, and uses that result instead of the original file
name to look up the sources.
Using the previous example, suppose the foo-1.0 tree has been
moved from /usr/src to /mnt/cross, then you can tell
GDB to replace /usr/src in all source path names with
/mnt/cross. The first lookup will then be
/mnt/cross/foo-1.0/lib/foo.c in place of the original location
of /usr/src/foo-1.0/lib/foo.c. To define a source path
substitution rule, use the set substitute-path command
(see set substitute-path).
To avoid unexpected substitution results, a rule is applied only if the
from part of the directory name ends at a directory separator.
For instance, a rule substituting /usr/source into
/mnt/cross will be applied to /usr/source/foo-1.0 but
not to /usr/sourceware/foo-2.0. And because the substitution
is applied only at the beginning of the directory name, this rule will
not be applied to /root/usr/source/baz.c either.
In many cases, you can achieve the same result using the directory
command. However, set substitute-path can be more efficient in
the case where the sources are organized in a complex tree with multiple
subdirectories. With the directory command, you need to add each
subdirectory of your project. If you moved the entire tree while
preserving its internal organization, then set substitute-path
allows you to direct the debugger to all the sources with one single
command.
set substitute-path is also more than just a shortcut command.
The source path is only used if the file at the original location no
longer exists. On the other hand, set substitute-path modifies
the debugger behavior to look at the rewritten location instead. So, if
for any reason a source file that is not relevant to your executable is
located at the original location, a substitution rule is the only
method available to point GDB at the new location.
You can configure a default source path substitution rule by
configuring GDB with the
‘—with-relocated-sources=dir’ option. The dir
should be the name of a directory under GDB’s configured
prefix (set with ‘—prefix’ or ‘—exec-prefix’), and
directory names in debug information under dir will be adjusted
automatically if the installed GDB is moved to a new
location. This is useful if GDB, libraries or executables
with debug information and corresponding source code are being moved
together.
directory dirname …dir dirname …-
Add directory dirname to the front of the source path. Several
directory names may be given to this command, separated by ‘:’
(‘;’ on MS-DOS and MS-Windows, where ‘:’ usually appears as
part of absolute file names) or
whitespace. You may specify a directory that is already in the source
path; this moves it forward, so GDB searches it sooner.The special strings ‘$cdir’ (to refer to the compilation
directory, if one is recorded), and ‘$cwd’ (to refer to the
current working directory) can also be included in the list of
directories dirname. Though these will already be in the source
path they will be moved forward in the list so GDB searches
them sooner. directory-
Reset the source path to its default value (‘$cdir:$cwd’ on Unix systems). This requires confirmation.
set directories path-list-
Set the source path to path-list.
‘$cdir:$cwd’ are added if missing. show directories-
Print the source path: show which directories it contains.
set substitute-path from to-
Define a source path substitution rule, and add it at the end of the
current list of existing substitution rules. If a rule with the same
from was already defined, then the old rule is also deleted.For example, if the file /foo/bar/baz.c was moved to
/mnt/cross/baz.c, then the command(gdb) set substitute-path /foo/bar /mnt/cross
will tell GDB to replace ‘/foo/bar’ with
‘/mnt/cross’, which will allow GDB to find the file
baz.c even though it was moved.In the case when more than one substitution rule have been defined,
the rules are evaluated one by one in the order where they have been
defined. The first one matching, if any, is selected to perform
the substitution.For instance, if we had entered the following commands:
(gdb) set substitute-path /usr/src/include /mnt/include (gdb) set substitute-path /usr/src /mnt/src
GDB would then rewrite /usr/src/include/defs.h into
/mnt/include/defs.h by using the first rule. However, it would
use the second rule to rewrite /usr/src/lib/foo.c into
/mnt/src/lib/foo.c. unset substitute-path [path]-
If a path is specified, search the current list of substitution rules
for a rule that would rewrite that path. Delete that rule if found.
A warning is emitted by the debugger if no rule could be found.If no path is specified, then all substitution rules are deleted.
show substitute-path [path]-
If a path is specified, then print the source path substitution rule
which would rewrite that path, if any.If no path is specified, then print all existing source path substitution
rules.
If your source path is cluttered with directories that are no longer of
interest, GDB may sometimes cause confusion by finding the wrong
versions of source. You can correct the situation as follows:
- Use
directorywith no argument to reset the source path to its default value. - Use
directorywith suitable arguments to reinstall the
directories you want in the source path. You can add all the
directories in one command.
9.6 Source and Machine Code
You can use the command info line to map source lines to program
addresses (and vice versa), and the command disassemble to display
a range of addresses as machine instructions. You can use the command
set disassemble-next-line to set whether to disassemble next
source line when execution stops. When run under GNU Emacs
mode, the info line command causes the arrow to point to the
line specified. Also, info line prints addresses in symbolic form as
well as hex.
info lineinfo line locspec-
Print the starting and ending addresses of the compiled code for the
source lines of the code locations that result from resolving
locspec. See Location Specifications, for the various forms
of locspec.
With no locspec, information about the current source line is
printed.
For example, we can use info line to discover the location of
the object code for the first line of function
m4_changequote:
(gdb) info line m4_changequote
Line 895 of "builtin.c" starts at pc 0x634c <m4_changequote> and
ends at 0x6350 <m4_changequote+4>.
We can also inquire, using *addr as the form for
locspec, what source line covers a particular address
addr:
(gdb) info line *0x63ff
Line 926 of "builtin.c" starts at pc 0x63e4 <m4_changequote+152> and
ends at 0x6404 <m4_changequote+184>.
After info line, the default address for the x command
is changed to the starting address of the line, so that ‘x/i’ is
sufficient to begin examining the machine code (see Examining Memory). Also, this address is saved as the value of the
convenience variable $_ (see Convenience
Variables).
After info line, using info line again without
specifying a location will display information about the next source
line.
disassembledisassemble /mdisassemble /sdisassemble /rdisassemble /b-
This specialized command dumps a range of memory as machine
instructions. It can also print mixed source+disassembly by specifying
the/mor/smodifier and print the raw instructions in
hex as well as in symbolic form by specifying the/ror/b
modifier. The default memory range is the function surrounding the
program counter of the selected frame. A single argument to this
command is a program counter value; GDB dumps the function
surrounding this value. When two arguments are given, they should be
separated by a comma, possibly surrounded by whitespace. The arguments
specify a range of addresses to dump, in one of two forms:start,end-
the addresses from start (inclusive) to end (exclusive)
start,+length-
the addresses from start (inclusive) to
start+length(exclusive).
When 2 arguments are specified, the name of the function is also
printed (since there could be several functions in the given range).The argument(s) can be any expression yielding a numeric value, such as
‘0x32c4’, ‘&main+10’ or ‘$pc — 8’.If the range of memory being disassembled contains current program counter,
the instruction at that location is shown with a=>marker.
The following example shows the disassembly of a range of addresses of
HP PA-RISC 2.0 code:
(gdb) disas 0x32c4, 0x32e4 Dump of assembler code from 0x32c4 to 0x32e4: 0x32c4 <main+204>: addil 0,dp 0x32c8 <main+208>: ldw 0x22c(sr0,r1),r26 0x32cc <main+212>: ldil 0x3000,r31 0x32d0 <main+216>: ble 0x3f8(sr4,r31) 0x32d4 <main+220>: ldo 0(r31),rp 0x32d8 <main+224>: addil -0x800,dp 0x32dc <main+228>: ldo 0x588(r1),r26 0x32e0 <main+232>: ldil 0x3000,r31 End of assembler dump.
The following two examples are for RISC-V, and demonstrates the
difference between the /r and /b modifiers. First with
/b, the bytes of the instruction are printed, in hex, in memory
order:
(gdb) disassemble /b 0x00010150,0x0001015c Dump of assembler code from 0x10150 to 0x1015c: 0x00010150 <call_me+4>: 22 dc sw s0,56(sp) 0x00010152 <call_me+6>: 80 00 addi s0,sp,64 0x00010154 <call_me+8>: 23 26 a4 fe sw a0,-20(s0) 0x00010158 <call_me+12>: 23 24 b4 fe sw a1,-24(s0) End of assembler dump.
In contrast, with /r the bytes of the instruction are displayed
in the instruction order, for RISC-V this means that the bytes have been
swapped to little-endian order:
(gdb) disassemble /r 0x00010150,0x0001015c Dump of assembler code from 0x10150 to 0x1015c: 0x00010150 <call_me+4>: dc22 sw s0,56(sp) 0x00010152 <call_me+6>: 0080 addi s0,sp,64 0x00010154 <call_me+8>: fea42623 sw a0,-20(s0) 0x00010158 <call_me+12>: feb42423 sw a1,-24(s0) End of assembler dump.
Here is an example showing mixed source+assembly for Intel x86
with /m or /s, when the program is stopped just after
function prologue in a non-optimized function with no inline code.
(gdb) disas /m main
Dump of assembler code for function main:
5 {
0x08048330 <+0>: push %ebp
0x08048331 <+1>: mov %esp,%ebp
0x08048333 <+3>: sub $0x8,%esp
0x08048336 <+6>: and $0xfffffff0,%esp
0x08048339 <+9>: sub $0x10,%esp
6 printf ("Hello.n");
=> 0x0804833c <+12>: movl $0x8048440,(%esp)
0x08048343 <+19>: call 0x8048284 <puts@plt>
7 return 0;
8 }
0x08048348 <+24>: mov $0x0,%eax
0x0804834d <+29>: leave
0x0804834e <+30>: ret
End of assembler dump.
The /m option is deprecated as its output is not useful when
there is either inlined code or re-ordered code.
The /s option is the preferred choice.
Here is an example for AMD x86-64 showing the difference between
/m output and /s output.
This example has one inline function defined in a header file,
and the code is compiled with ‘-O2’ optimization.
Note how the /m output is missing the disassembly of
several instructions that are present in the /s output.
foo.h:
int
foo (int a)
{
if (a < 0)
return a * 2;
if (a == 0)
return 1;
return a + 10;
}
foo.c:
#include "foo.h"
volatile int x, y;
int
main ()
{
x = foo (y);
return 0;
}
(gdb) disas /m main
Dump of assembler code for function main:
5 {
6 x = foo (y);
0x0000000000400400 <+0>: mov 0x200c2e(%rip),%eax # 0x601034 <y>
0x0000000000400417 <+23>: mov %eax,0x200c13(%rip) # 0x601030 <x>
7 return 0;
8 }
0x000000000040041d <+29>: xor %eax,%eax
0x000000000040041f <+31>: retq
0x0000000000400420 <+32>: add %eax,%eax
0x0000000000400422 <+34>: jmp 0x400417 <main+23>
End of assembler dump.
(gdb) disas /s main
Dump of assembler code for function main:
foo.c:
5 {
6 x = foo (y);
0x0000000000400400 <+0>: mov 0x200c2e(%rip),%eax # 0x601034 <y>
foo.h:
4 if (a < 0)
0x0000000000400406 <+6>: test %eax,%eax
0x0000000000400408 <+8>: js 0x400420 <main+32>
6 if (a == 0)
7 return 1;
8 return a + 10;
0x000000000040040a <+10>: lea 0xa(%rax),%edx
0x000000000040040d <+13>: test %eax,%eax
0x000000000040040f <+15>: mov $0x1,%eax
0x0000000000400414 <+20>: cmovne %edx,%eax
foo.c:
6 x = foo (y);
0x0000000000400417 <+23>: mov %eax,0x200c13(%rip) # 0x601030 <x>
7 return 0;
8 }
0x000000000040041d <+29>: xor %eax,%eax
0x000000000040041f <+31>: retq
foo.h:
5 return a * 2;
0x0000000000400420 <+32>: add %eax,%eax
0x0000000000400422 <+34>: jmp 0x400417 <main+23>
End of assembler dump.
Here is another example showing raw instructions in hex for AMD x86-64,
(gdb) disas /r 0x400281,+10 Dump of assembler code from 0x400281 to 0x40028b: 0x0000000000400281: 38 36 cmp %dh,(%rsi) 0x0000000000400283: 2d 36 34 2e 73 sub $0x732e3436,%eax 0x0000000000400288: 6f outsl %ds:(%rsi),(%dx) 0x0000000000400289: 2e 32 00 xor %cs:(%rax),%al End of assembler dump.
Note that the ‘disassemble’ command’s address arguments are
specified using expressions in your programming language
(see Expressions), not location specs
(see Location Specifications). So, for example, if you want to
disassemble function bar in file foo.c, you must type
‘disassemble ‘foo.c’::bar’ and not ‘disassemble foo.c:bar’.
Some architectures have more than one commonly-used set of instruction
mnemonics or other syntax.
For programs that were dynamically linked and use shared libraries,
instructions that call functions or branch to locations in the shared
libraries might show a seemingly bogus location—it’s actually a
location of the relocation table. On some architectures, GDB
might be able to resolve these to actual function names.
set disassembler-options option1[,option2…]-
This command controls the passing of target specific information to
the disassembler. For a list of valid options, please refer to the
-M/--disassembler-optionssection of the ‘objdump’
manual and/or the output of objdump --help
(see objdump in The GNU Binary Utilities).
The default value is the empty string.If it is necessary to specify more than one disassembler option, then
multiple options can be placed together into a comma separated list.
Currently this command is only supported on targets ARC, ARM, MIPS,
PowerPC and S/390. show disassembler-options-
Show the current setting of the disassembler options.
set disassembly-flavor instruction-set-
Select the instruction set to use when disassembling the
program via thedisassembleorx/icommands.Currently this command is only defined for the Intel x86 family. You
can set instruction-set to eitherinteloratt.
The default isatt, the AT&T flavor used by default by Unix
assemblers for x86-based targets. show disassembly-flavor-
Show the current setting of the disassembly flavor.
set disassemble-next-lineshow disassemble-next-line-
Control whether or not GDB will disassemble the next source
line or instruction when execution stops. If ON, GDB will
display disassembly of the next source line when execution of the
program being debugged stops. This is in addition to
displaying the source line itself, which GDB always does if
possible. If the next source line cannot be displayed for some reason
(e.g., if GDB cannot find the source file, or there’s no line
info in the debug info), GDB will display disassembly of the
next instruction instead of showing the next source line. If
AUTO, GDB will display disassembly of next instruction only
if the source line cannot be displayed. This setting causes
GDB to display some feedback when you step through a function
with no line info or whose source file is unavailable. The default is
OFF, which means never display the disassembly of the next line or
instruction.
9.7 Disable Reading Source Code
In some cases it can be desirable to prevent GDB from
accessing source code files. One case where this might be desirable
is if the source code files are located over a slow network
connection.
The following command can be used to control whether GDB
should access source code files or not:
set source open [on|off]show source open-
When this option is
on, which is the default, GDB will
access source code files when needed, for example to print source
lines when GDB stops, or in response to thelist
command.When this option is
off, GDB will not access source
code files.
10 Examining Data
The usual way to examine data in your program is with the print
command (abbreviated p), or its synonym inspect. It
evaluates and prints the value of an expression of the language your
program is written in (see Using GDB with
Different Languages). It may also print the expression using a
Python-based pretty-printer (see Pretty Printing).
print [[options] --] exprprint [[options] --] /f expr-
expr is an expression (in the source language). By default the
value of expr is printed in a format appropriate to its data type;
you can choose a different format by specifying ‘/f’, where
f is a letter specifying the format; see Output
Formats.The
printcommand supports a number of options that allow
overriding relevant global print settings as set byset print
subcommands:-address [on|off]-
Set printing of addresses.
Related setting: set print address. -array [on|off]-
Pretty formatting of arrays.
Related setting: set print array. -array-indexes [on|off]-
Set printing of array indexes.
Related setting: set print array-indexes. -elements number-of-elements|unlimited-
Set limit on string chars or array elements to print. The value
unlimitedcauses there to be no limit. Related setting:
set print elements. -max-depth depth|unlimited-
Set the threshold after which nested structures are replaced with
ellipsis. Related setting: set print max-depth. -nibbles [on|off]-
Set whether to print binary values in groups of four bits, known
as “nibbles”. See set print nibbles. -memory-tag-violations [on|off]-
Set printing of additional information about memory tag violations.
See set print memory-tag-violations. -null-stop [on|off]-
Set printing of char arrays to stop at first null char. Related
setting: set print null-stop. -object [on|off]-
Set printing C++ virtual function tables. Related setting:
set print object. -pretty [on|off]-
Set pretty formatting of structures. Related setting: set print pretty.
-raw-values [on|off]-
Set whether to print values in raw form, bypassing any
pretty-printers for that value. Related setting: set print raw-values. -repeats number-of-repeats|unlimited-
Set threshold for repeated print elements.
unlimitedcauses
all elements to be individually printed. Related setting: set print repeats. -static-members [on|off]-
Set printing C++ static members. Related setting: set print static-members.
-symbol [on|off]-
Set printing of symbol names when printing pointers. Related setting:
set print symbol. -union [on|off]-
Set printing of unions interior to structures. Related setting:
set print union. -vtbl [on|off]-
Set printing of C++ virtual function tables. Related setting:
set print vtbl.
Because the
printcommand accepts arbitrary expressions which
may look like options (including abbreviations), if you specify any
command option, then you must use a double dash (--) to mark
the end of option processing.For example, this prints the value of the
-pexpression:While this repeats the last value in the value history (see below)
with the-prettyoption in effect:Here is an example including both on option and an expression:
(gdb) print -pretty -- *myptr $1 = { next = 0x0, flags = { sweet = 1, sour = 1 }, meat = 0x54 "Pork" } print [options]print [options] /f-
If you omit expr, GDB displays the last value again (from the
value history; see Value History). This allows you to
conveniently inspect the same value in an alternative format.
If the architecture supports memory tagging, the print command will
display pointer/memory tag mismatches if what is being printed is a pointer
or reference type. See Memory Tagging.
A more low-level way of examining data is with the x command.
It examines data in memory at a specified address and prints it in a
specified format. See Examining Memory.
If you are interested in information about types, or about how the
fields of a struct or a class are declared, use the ptype expr
command rather than print. See Examining the Symbol
Table.
Another way of examining values of expressions and type information is
through the Python extension command explore (available only if
the GDB build is configured with --with-python). It
offers an interactive way to start at the highest level (or, the most
abstract level) of the data type of an expression (or, the data type
itself) and explore all the way down to leaf scalar values/fields
embedded in the higher level data types.
explore arg-
arg is either an expression (in the source language), or a type
visible in the current context of the program being debugged.
The working of the explore command can be illustrated with an
example. If a data type struct ComplexStruct is defined in your
C program as
struct SimpleStruct
{
int i;
double d;
};
struct ComplexStruct
{
struct SimpleStruct *ss_p;
int arr[10];
};
followed by variable declarations as
struct SimpleStruct ss = { 10, 1.11 };
struct ComplexStruct cs = { &ss, { 0, 1, 2, 3, 4, 5, 6, 7, 8, 9 } };
then, the value of the variable cs can be explored using the
explore command as follows.
(gdb) explore cs The value of `cs' is a struct/class of type `struct ComplexStruct' with the following fields: ss_p = <Enter 0 to explore this field of type `struct SimpleStruct *'> arr = <Enter 1 to explore this field of type `int [10]'> Enter the field number of choice:
Since the fields of cs are not scalar values, you are being
prompted to chose the field you want to explore. Let’s say you choose
the field ss_p by entering 0. Then, since this field is a
pointer, you will be asked if it is pointing to a single value. From
the declaration of cs above, it is indeed pointing to a single
value, hence you enter y. If you enter n, then you will
be asked if it were pointing to an array of values, in which case this
field will be explored as if it were an array.
`cs.ss_p' is a pointer to a value of type `struct SimpleStruct' Continue exploring it as a pointer to a single value [y/n]: y The value of `*(cs.ss_p)' is a struct/class of type `struct SimpleStruct' with the following fields: i = 10 .. (Value of type `int') d = 1.1100000000000001 .. (Value of type `double') Press enter to return to parent value:
If the field arr of cs was chosen for exploration by
entering 1 earlier, then since it is as array, you will be
prompted to enter the index of the element in the array that you want
to explore.
`cs.arr' is an array of `int'. Enter the index of the element you want to explore in `cs.arr': 5 `(cs.arr)[5]' is a scalar value of type `int'. (cs.arr)[5] = 4 Press enter to return to parent value:
In general, at any stage of exploration, you can go deeper towards the
leaf values by responding to the prompts appropriately, or hit the
return key to return to the enclosing data structure (the higher
level data structure).
Similar to exploring values, you can use the explore command to
explore types. Instead of specifying a value (which is typically a
variable name or an expression valid in the current context of the
program being debugged), you specify a type name. If you consider the
same example as above, your can explore the type
struct ComplexStruct by passing the argument
struct ComplexStruct to the explore command.
(gdb) explore struct ComplexStruct
By responding to the prompts appropriately in the subsequent interactive
session, you can explore the type struct ComplexStruct in a
manner similar to how the value cs was explored in the above
example.
The explore command also has two sub-commands,
explore value and explore type. The former sub-command is
a way to explicitly specify that value exploration of the argument is
being invoked, while the latter is a way to explicitly specify that type
exploration of the argument is being invoked.
explore value expr-
This sub-command of
exploreexplores the value of the
expression expr (if expr is an expression valid in the
current context of the program being debugged). The behavior of this
command is identical to that of the behavior of theexplore
command being passed the argument expr. explore type arg-
This sub-command of
exploreexplores the type of arg (if
arg is a type visible in the current context of program being
debugged), or the type of the value/expression arg (if arg
is an expression valid in the current context of the program being
debugged). If arg is a type, then the behavior of this command is
identical to that of theexplorecommand being passed the
argument arg. If arg is an expression, then the behavior of
this command will be identical to that of theexplorecommand
being passed the type of arg as the argument.
10.1 Expressions
print and many other GDB commands accept an expression and
compute its value. Any kind of constant, variable or operator defined
by the programming language you are using is valid in an expression in
GDB. This includes conditional expressions, function calls,
casts, and string constants. It also includes preprocessor macros, if
you compiled your program to include this information; see
Compilation.
GDB supports array constants in expressions input by
the user. The syntax is {element, element…}. For example,
you can use the command print {1, 2, 3} to create an array
of three integers. If you pass an array to a function or assign it
to a program variable, GDB copies the array to memory that
is malloced in the target program.
Because C is so widespread, most of the expressions shown in examples in
this manual are in C. See Using GDB with Different
Languages, for information on how to use expressions in other
languages.
In this section, we discuss operators that you can use in GDB
expressions regardless of your programming language.
Casts are supported in all languages, not just in C, because it is so
useful to cast a number into a pointer in order to examine a structure
at that address in memory.
GDB supports these operators, in addition to those common
to programming languages:
@-
‘@’ is a binary operator for treating parts of memory as arrays.
See Artificial Arrays, for more information. ::-
‘::’ allows you to specify a variable in terms of the file or
function where it is defined. See Program Variables. {type} addr-
Refers to an object of type type stored at address addr in
memory. The address addr may be any expression whose value is
an integer or pointer (but parentheses are required around binary
operators, just as in a cast). This construct is allowed regardless
of what kind of data is normally supposed to reside at addr.
10.2 Ambiguous Expressions
Expressions can sometimes contain some ambiguous elements. For instance,
some programming languages (notably Ada, C++ and Objective-C) permit
a single function name to be defined several times, for application in
different contexts. This is called overloading. Another example
involving Ada is generics. A generic package is similar to C++
templates and is typically instantiated several times, resulting in
the same function name being defined in different contexts.
In some cases and depending on the language, it is possible to adjust
the expression to remove the ambiguity. For instance in C++, you
can specify the signature of the function you want to break on, as in
break function(types). In Ada, using the fully
qualified name of your function often makes the expression unambiguous
as well.
When an ambiguity that needs to be resolved is detected, the debugger
has the capability to display a menu of numbered choices for each
possibility, and then waits for the selection with the prompt ‘>’.
The first option is always ‘[0] cancel’, and typing 0 RET
aborts the current command. If the command in which the expression was
used allows more than one choice to be selected, the next option in the
menu is ‘[1] all’, and typing 1 RET selects all possible
choices.
For example, the following session excerpt shows an attempt to set a
breakpoint at the overloaded symbol String::after.
We choose three particular definitions of that function name:
(gdb) b String::after [0] cancel [1] all [2] file:String.cc; line number:867 [3] file:String.cc; line number:860 [4] file:String.cc; line number:875 [5] file:String.cc; line number:853 [6] file:String.cc; line number:846 [7] file:String.cc; line number:735 > 2 4 6 Breakpoint 1 at 0xb26c: file String.cc, line 867. Breakpoint 2 at 0xb344: file String.cc, line 875. Breakpoint 3 at 0xafcc: file String.cc, line 846. Multiple breakpoints were set. Use the "delete" command to delete unwanted breakpoints. (gdb)
set multiple-symbols mode-
This option allows you to adjust the debugger behavior when an expression
is ambiguous.By default, mode is set to
all. If the command with which
the expression is used allows more than one choice, then GDB
automatically selects all possible choices. For instance, inserting
a breakpoint on a function using an ambiguous name results in a breakpoint
inserted on each possible match. However, if a unique choice must be made,
then GDB uses the menu to help you disambiguate the expression.
For instance, printing the address of an overloaded function will result
in the use of the menu.When mode is set to
ask, the debugger always uses the menu
when an ambiguity is detected.Finally, when mode is set to
cancel, the debugger reports
an error due to the ambiguity and the command is aborted. show multiple-symbols-
Show the current value of the
multiple-symbolssetting.
10.3 Program Variables
The most common kind of expression to use is the name of a variable
in your program.
Variables in expressions are understood in the selected stack frame
(see Selecting a Frame); they must be either:
- global (or file-static)
or
- visible according to the scope rules of the
programming language from the point of execution in that frame
This means that in the function
foo (a)
int a;
{
bar (a);
{
int b = test ();
bar (b);
}
}
you can examine and use the variable a whenever your program is
executing within the function foo, but you can only use or
examine the variable b while your program is executing inside
the block where b is declared.
There is an exception: you can refer to a variable or function whose
scope is a single source file even if the current execution point is not
in this file. But it is possible to have more than one such variable or
function with the same name (in different source files). If that
happens, referring to that name has unpredictable effects. If you wish,
you can specify a static variable in a particular function or file by
using the colon-colon (::) notation:
file::variable function::variable
Here file or function is the name of the context for the
static variable. In the case of file names, you can use quotes to
make sure GDB parses the file name as a single word—for example,
to print a global value of x defined in f2.c:
The :: notation is normally used for referring to
static variables, since you typically disambiguate uses of local variables
in functions by selecting the appropriate frame and using the
simple name of the variable. However, you may also use this notation
to refer to local variables in frames enclosing the selected frame:
void
foo (int a)
{
if (a < 10)
bar (a);
else
process (a); /* Stop here */
}
int
bar (int a)
{
foo (a + 5);
}
For example, if there is a breakpoint at the commented line,
here is what you might see
when the program stops after executing the call bar(0):
(gdb) p a $1 = 10 (gdb) p bar::a $2 = 5 (gdb) up 2 #2 0x080483d0 in foo (a=5) at foobar.c:12 (gdb) p a $3 = 5 (gdb) p bar::a $4 = 0
These uses of ‘::’ are very rarely in conflict with the very
similar use of the same notation in C++. When they are in
conflict, the C++ meaning takes precedence; however, this can be
overridden by quoting the file or function name with single quotes.
For example, suppose the program is stopped in a method of a class
that has a field named includefile, and there is also an
include file named includefile that defines a variable,
some_global.
(gdb) p includefile $1 = 23 (gdb) p includefile::some_global A syntax error in expression, near `'. (gdb) p 'includefile'::some_global $2 = 27
Warning: Occasionally, a local variable may appear to have the
wrong value at certain points in a function—just after entry to a new
scope, and just before exit.
You may see this problem when you are stepping by machine instructions.
This is because, on most machines, it takes more than one instruction to
set up a stack frame (including local variable definitions); if you are
stepping by machine instructions, variables may appear to have the wrong
values until the stack frame is completely built. On exit, it usually
also takes more than one machine instruction to destroy a stack frame;
after you begin stepping through that group of instructions, local
variable definitions may be gone.
This may also happen when the compiler does significant optimizations.
To be sure of always seeing accurate values, turn off all optimization
when compiling.
Another possible effect of compiler optimizations is to optimize
unused variables out of existence, or assign variables to registers (as
opposed to memory addresses). Depending on the support for such cases
offered by the debug info format used by the compiler, GDB
might not be able to display values for such local variables. If that
happens, GDB will print a message like this:
No symbol "foo" in current context.
To solve such problems, either recompile without optimizations, or use a
different debug info format, if the compiler supports several such
formats. See Compilation, for more information on choosing compiler
options. See C and C++, for more information about debug
info formats that are best suited to C++ programs.
If you ask to print an object whose contents are unknown to
GDB, e.g., because its data type is not completely specified
by the debug information, GDB will say ‘<incomplete
type>’. See incomplete type, for more about this.
If you try to examine or use the value of a (global) variable for
which GDB has no type information, e.g., because the program
includes no debug information, GDB displays an error message.
See unknown type, for more about unknown types. If you
cast the variable to its declared type, GDB gets the
variable’s value using the cast-to type as the variable’s type. For
example, in a C program:
(gdb) p var 'var' has unknown type; cast it to its declared type (gdb) p (float) var $1 = 3.14
If you append @entry string to a function parameter name you get its
value at the time the function got called. If the value is not available an
error message is printed. Entry values are available only with some compilers.
Entry values are normally also printed at the function parameter list according
to set print entry-values.
Breakpoint 1, d (i=30) at gdb.base/entry-value.c:29 29 i++; (gdb) next 30 e (i); (gdb) print i $1 = 31 (gdb) print i@entry $2 = 30
Strings are identified as arrays of char values without specified
signedness. Arrays of either signed char or unsigned char get
printed as arrays of 1 byte sized integers. -fsigned-char or
-funsigned-char GCC options have no effect as GDB
defines literal string type "char" as char without a sign.
For program code
char var0[] = "A"; signed char var1[] = "A";
You get during debugging
(gdb) print var0
$1 = "A"
(gdb) print var1
$2 = {65 'A', 0 ''}
10.4 Artificial Arrays
It is often useful to print out several successive objects of the
same type in memory; a section of an array, or an array of
dynamically determined size for which only a pointer exists in the
program.
You can do this by referring to a contiguous span of memory as an
artificial array, using the binary operator ‘@’. The left
operand of ‘@’ should be the first element of the desired array
and be an individual object. The right operand should be the desired length
of the array. The result is an array value whose elements are all of
the type of the left argument. The first element is actually the left
argument; the second element comes from bytes of memory immediately
following those that hold the first element, and so on. Here is an
example. If a program says
int *array = (int *) malloc (len * sizeof (int));
you can print the contents of array with
The left operand of ‘@’ must reside in memory. Array values made
with ‘@’ in this way behave just like other arrays in terms of
subscripting, and are coerced to pointers when used in expressions.
Artificial arrays most often appear in expressions via the value history
(see Value History), after printing one out.
Another way to create an artificial array is to use a cast.
This re-interprets a value as if it were an array.
The value need not be in memory:
(gdb) p/x (short[2])0x12345678
$1 = {0x1234, 0x5678}
As a convenience, if you leave the array length out (as in
‘(type[])value’) GDB calculates the size to fill
the value (as ‘sizeof(value)/sizeof(type)’:
(gdb) p/x (short[])0x12345678
$2 = {0x1234, 0x5678}
Sometimes the artificial array mechanism is not quite enough; in
moderately complex data structures, the elements of interest may not
actually be adjacent—for example, if you are interested in the values
of pointers in an array. One useful work-around in this situation is
to use a convenience variable (see Convenience
Variables) as a counter in an expression that prints the first
interesting value, and then repeat that expression via RET. For
instance, suppose you have an array dtab of pointers to
structures, and you are interested in the values of a field fv
in each structure. Here is an example of what you might type:
set $i = 0 p dtab[$i++]->fv RET RET …
10.5 Output Formats
By default, GDB prints a value according to its data type. Sometimes
this is not what you want. For example, you might want to print a number
in hex, or a pointer in decimal. Or you might want to view data in memory
at a certain address as a character string or as an instruction. To do
these things, specify an output format when you print a value.
The simplest use of output formats is to say how to print a value
already computed. This is done by starting the arguments of the
print command with a slash and a format letter. The format
letters supported are:
x-
Print the binary representation of the value in hexadecimal.
d-
Print the binary representation of the value in decimal.
u-
Print the binary representation of the value as an decimal, as if it
were unsigned. o-
Print the binary representation of the value in octal.
t-
Print the binary representation of the value in binary. The letter
‘t’ stands for “two”. 11 a-
Print as an address, both absolute in hexadecimal and as an offset from
the nearest preceding symbol. You can use this format used to discover
where (in what function) an unknown address is located:(gdb) p/a 0x54320 $3 = 0x54320 <_initialize_vx+396>
The command
info symbol 0x54320yields similar results.
See info symbol. c-
Cast the value to an integer (unlike other formats, this does not just
reinterpret the underlying bits) and print it as a character constant.
This prints both the numerical value and its character representation.
The character representation is replaced with the octal escape
‘nnn’ for characters outside the 7-bit ASCII range.Without this format, GDB displays
char,
unsigned char, andsigned chardata as character
constants. Single-byte members of vectors are displayed as integer
data. f-
Regard the bits of the value as a floating point number and print
using typical floating point syntax. s-
Regard as a string, if possible. With this format, pointers to single-byte
data are displayed as null-terminated strings and arrays of single-byte data
are displayed as fixed-length strings. Other values are displayed in their
natural types.Without this format, GDB displays pointers to and arrays of
char,unsigned char, andsigned charas
strings. Single-byte members of a vector are displayed as an integer
array. z-
Like ‘x’ formatting, the value is treated as an integer and
printed as hexadecimal, but leading zeros are printed to pad the value
to the size of the integer type. r-
Print using the ‘raw’ formatting. By default, GDB will
use a Python-based pretty-printer, if one is available (see Pretty Printing). This typically results in a higher-level display of the
value’s contents. The ‘r’ format bypasses any Python
pretty-printer which might exist.
For example, to print the program counter in hex (see Registers), type
Note that no space is required before the slash; this is because command
names in GDB cannot contain a slash.
To reprint the last value in the value history with a different format,
you can use the print command with just a format and no
expression. For example, ‘p/x’ reprints the last value in hex.
10.6 Examining Memory
You can use the command x (for “examine”) to examine memory in
any of several formats, independently of your program’s data types.
x/nfu addrx addrx-
Use the
xcommand to examine memory.
n, f, and u are all optional parameters that specify how
much memory to display and how to format it; addr is an
expression giving the address where you want to start displaying memory.
If you use defaults for nfu, you need not type the slash ‘/’.
Several commands set convenient defaults for addr.
- n, the repeat count
-
The repeat count is a decimal integer; the default is 1. It specifies
how much memory (counting by units u) to display. If a negative
number is specified, memory is examined backward from addr. - f, the display format
-
The display format is one of the formats used by
print
(‘x’, ‘d’, ‘u’, ‘o’, ‘t’, ‘a’, ‘c’,
‘f’, ‘s’), ‘i’ (for machine instructions) and
‘m’ (for displaying memory tags).
The default is ‘x’ (hexadecimal) initially. The default changes
each time you use eitherxorprint. - u, the unit size
-
The unit size is any of
b-
Bytes.
h-
Halfwords (two bytes).
w-
Words (four bytes). This is the initial default.
g-
Giant words (eight bytes).
Each time you specify a unit size with
x, that size becomes the
default unit the next time you usex. For the ‘i’ format,
the unit size is ignored and is normally not written. For the ‘s’ format,
the unit size defaults to ‘b’, unless it is explicitly given.
Use x /hs to display 16-bit char strings and x /ws to display
32-bit strings. The next use of x /s will again display 8-bit strings.
Note that the results depend on the programming language of the
current compilation unit. If the language is C, the ‘s’
modifier will use the UTF-16 encoding while ‘w’ will use
UTF-32. The encoding is set by the programming language and cannot
be altered. - addr, starting display address
-
addr is the address where you want GDB to begin displaying
memory. The expression need not have a pointer value (though it may);
it is always interpreted as an integer address of a byte of memory.
See Expressions, for more information on expressions. The default for
addr is usually just after the last address examined—but several
other commands also set the default address:info breakpoints(to
the address of the last breakpoint listed),info line(to the
starting address of a line), andprint(if you use it to display
a value from memory).
For example, ‘x/3uh 0x54320’ is a request to display three halfwords
(h) of memory, formatted as unsigned decimal integers (‘u’),
starting at address 0x54320. ‘x/4xw $sp’ prints the four
words (‘w’) of memory above the stack pointer (here, ‘$sp’;
see Registers) in hexadecimal (‘x’).
You can also specify a negative repeat count to examine memory backward
from the given address. For example, ‘x/-3uh 0x54320’ prints three
halfwords (h) at 0x5431a, 0x5431c, and 0x5431e.
Since the letters indicating unit sizes are all distinct from the
letters specifying output formats, you do not have to remember whether
unit size or format comes first; either order works. The output
specifications ‘4xw’ and ‘4wx’ mean exactly the same thing.
(However, the count n must come first; ‘wx4’ does not work.)
Even though the unit size u is ignored for the formats ‘s’
and ‘i’, you might still want to use a count n; for example,
‘3i’ specifies that you want to see three machine instructions,
including any operands. For convenience, especially when used with
the display command, the ‘i’ format also prints branch delay
slot instructions, if any, beyond the count specified, which immediately
follow the last instruction that is within the count. The command
disassemble gives an alternative way of inspecting machine
instructions; see Source and Machine Code.
If a negative repeat count is specified for the formats ‘s’ or ‘i’,
the command displays null-terminated strings or instructions before the given
address as many as the absolute value of the given number. For the ‘i’
format, we use line number information in the debug info to accurately locate
instruction boundaries while disassembling backward. If line info is not
available, the command stops examining memory with an error message.
All the defaults for the arguments to x are designed to make it
easy to continue scanning memory with minimal specifications each time
you use x. For example, after you have inspected three machine
instructions with ‘x/3i addr’, you can inspect the next seven
with just ‘x/7’. If you use RET to repeat the x command,
the repeat count n is used again; the other arguments default as
for successive uses of x.
When examining machine instructions, the instruction at current program
counter is shown with a => marker. For example:
(gdb) x/5i $pc-6 0x804837f <main+11>: mov %esp,%ebp 0x8048381 <main+13>: push %ecx 0x8048382 <main+14>: sub $0x4,%esp => 0x8048385 <main+17>: movl $0x8048460,(%esp) 0x804838c <main+24>: call 0x80482d4 <puts@plt>
If the architecture supports memory tagging, the tags can be displayed by
using ‘m’. See Memory Tagging.
The information will be displayed once per granule size
(the amount of bytes a particular memory tag covers). For example, AArch64
has a granule size of 16 bytes, so it will display a tag every 16 bytes.
Due to the way GDB prints information with the x command (not
aligned to a particular boundary), the tag information will refer to the
initial address displayed on a particular line. If a memory tag boundary
is crossed in the middle of a line displayed by the x command, it
will be displayed on the next line.
The ‘m’ format doesn’t affect any other specified formats that were
passed to the x command.
The addresses and contents printed by the x command are not saved
in the value history because there is often too much of them and they
would get in the way. Instead, GDB makes these values available for
subsequent use in expressions as values of the convenience variables
$_ and $__. After an x command, the last address
examined is available for use in expressions in the convenience variable
$_. The contents of that address, as examined, are available in
the convenience variable $__.
If the x command has a repeat count, the address and contents saved
are from the last memory unit printed; this is not the same as the last
address printed if several units were printed on the last line of output.
Most targets have an addressable memory unit size of 8 bits. This means
that to each memory address are associated 8 bits of data. Some
targets, however, have other addressable memory unit sizes.
Within GDB and this document, the term
addressable memory unit (or memory unit for short) is used
when explicitly referring to a chunk of data of that size. The word
byte is used to refer to a chunk of data of 8 bits, regardless of
the addressable memory unit size of the target. For most systems,
addressable memory unit is a synonym of byte.
When you are debugging a program running on a remote target machine
(see Remote Debugging), you may wish to verify the program’s image
in the remote machine’s memory against the executable file you
downloaded to the target. Or, on any target, you may want to check
whether the program has corrupted its own read-only sections. The
compare-sections command is provided for such situations.
compare-sections [section-name|-r]-
Compare the data of a loadable section section-name in the
executable file of the program being debugged with the same section in
the target machine’s memory, and report any mismatches. With no
arguments, compares all loadable sections. With an argument of
-r, compares all loadable read-only sections.Note: for remote targets, this command can be accelerated if the
target supports computing the CRC checksum of a block of memory
(see qCRC packet).
10.7 Memory Tagging
Memory tagging is a memory protection technology that uses a pair of tags to
validate memory accesses through pointers. The tags are integer values
usually comprised of a few bits, depending on the architecture.
There are two types of tags that are used in this setup: logical and
allocation. A logical tag is stored in the pointers themselves, usually at the
higher bits of the pointers. An allocation tag is the tag associated
with particular ranges of memory in the physical address space, against which
the logical tags from pointers are compared.
The pointer tag (logical tag) must match the memory tag (allocation tag)
for the memory access to be valid. If the logical tag does not match the
allocation tag, that will raise a memory violation.
Allocation tags cover multiple contiguous bytes of physical memory. This
range of bytes is called a memory tag granule and is architecture-specific.
For example, AArch64 has a tag granule of 16 bytes, meaning each allocation
tag spans 16 bytes of memory.
If the underlying architecture supports memory tagging, like AArch64 MTE
or SPARC ADI do, GDB can make use of it to validate pointers
against memory allocation tags.
The print (see Data) and x (see Memory) commands will
display tag information when appropriate, and a command prefix of
memory-tag gives access to the various memory tagging commands.
The memory-tag commands are the following:
memory-tag print-logical-tag pointer_expression-
Print the logical tag stored in pointer_expression.
memory-tag with-logical-tag pointer_expression tag_bytes-
Print the pointer given by pointer_expression, augmented with a logical
tag of tag_bytes. memory-tag print-allocation-tag address_expression-
Print the allocation tag associated with the memory address given by
address_expression. memory-tag setatag starting_address length tag_bytes-
Set the allocation tag(s) for memory range [starting_address,
starting_address + length) to tag_bytes. memory-tag check pointer_expression-
Check if the logical tag in the pointer given by pointer_expression
matches the allocation tag for the memory referenced by the pointer.This essentially emulates the hardware validation that is done when tagged
memory is accessed through a pointer, but does not cause a memory fault as
it would during hardware validation.It can be used to inspect potential memory tagging violations in the running
process, before any faults get triggered.
10.8 Automatic Display
If you find that you want to print the value of an expression frequently
(to see how it changes), you might want to add it to the automatic
display list so that GDB prints its value each time your program stops.
Each expression added to the list is given a number to identify it;
to remove an expression from the list, you specify that number.
The automatic display looks like this:
2: foo = 38 3: bar[5] = (struct hack *) 0x3804
This display shows item numbers, expressions and their current values. As with
displays you request manually using x or print, you can
specify the output format you prefer; in fact, display decides
whether to use print or x depending your format
specification—it uses x if you specify either the ‘i’
or ‘s’ format, or a unit size; otherwise it uses print.
display expr-
Add the expression expr to the list of expressions to display
each time your program stops. See Expressions.displaydoes not repeat if you press RET again after using it. display/fmt expr-
For fmt specifying only a display format and not a size or
count, add the expression expr to the auto-display list but
arrange to display it each time in the specified format fmt.
See Output Formats. display/fmt addr-
For fmt ‘i’ or ‘s’, or including a unit-size or a
number of units, add the expression addr as a memory address to
be examined each time your program stops. Examining means in effect
doing ‘x/fmt addr’. See Examining Memory.
For example, ‘display/i $pc’ can be helpful, to see the machine
instruction about to be executed each time execution stops (‘$pc’
is a common name for the program counter; see Registers).
undisplay dnums…delete display dnums…-
Remove items from the list of expressions to display. Specify the
numbers of the displays that you want affected with the command
argument dnums. It can be a single display number, one of the
numbers shown in the first field of the ‘info display’ display;
or it could be a range of display numbers, as in2-4.undisplaydoes not repeat if you press RET after using it.
(Otherwise you would just get the error ‘No display number …’.) disable display dnums…-
Disable the display of item numbers dnums. A disabled display
item is not printed automatically, but is not forgotten. It may be
enabled again later. Specify the numbers of the displays that you
want affected with the command argument dnums. It can be a
single display number, one of the numbers shown in the first field of
the ‘info display’ display; or it could be a range of display
numbers, as in2-4. enable display dnums…-
Enable display of item numbers dnums. It becomes effective once
again in auto display of its expression, until you specify otherwise.
Specify the numbers of the displays that you want affected with the
command argument dnums. It can be a single display number, one
of the numbers shown in the first field of the ‘info display’
display; or it could be a range of display numbers, as in2-4. display-
Display the current values of the expressions on the list, just as is
done when your program stops. info display-
Print the list of expressions previously set up to display
automatically, each one with its item number, but without showing the
values. This includes disabled expressions, which are marked as such.
It also includes expressions which would not be displayed right now
because they refer to automatic variables not currently available.
If a display expression refers to local variables, then it does not make
sense outside the lexical context for which it was set up. Such an
expression is disabled when execution enters a context where one of its
variables is not defined. For example, if you give the command
display last_char while inside a function with an argument
last_char, GDB displays this argument while your program
continues to stop inside that function. When it stops elsewhere—where
there is no variable last_char—the display is disabled
automatically. The next time your program stops where last_char
is meaningful, you can enable the display expression once again.
10.9 Print Settings
GDB provides the following ways to control how arrays, structures,
and symbols are printed.
These settings are useful for debugging programs in any language:
set print addressset print address on-
GDB prints memory addresses showing the location of stack
traces, structure values, pointer values, breakpoints, and so forth,
even when it also displays the contents of those addresses. The default
ison. For example, this is what a stack frame display looks like with
set print address on:(gdb) f #0 set_quotes (lq=0x34c78 "<<", rq=0x34c88 ">>") at input.c:530 530 if (lquote != def_lquote) set print address off-
Do not print addresses when displaying their contents. For example,
this is the same stack frame displayed withset print address off:(gdb) set print addr off (gdb) f #0 set_quotes (lq="<<", rq=">>") at input.c:530 530 if (lquote != def_lquote)
You can use ‘set print address off’ to eliminate all machine
dependent displays from the GDB interface. For example, with
print address off, you should get the same text for backtraces on
all machines—whether or not they involve pointer arguments. show print address-
Show whether or not addresses are to be printed.
When GDB prints a symbolic address, it normally prints the
closest earlier symbol plus an offset. If that symbol does not uniquely
identify the address (for example, it is a name whose scope is a single
source file), you may need to clarify. One way to do this is with
info line, for example ‘info line *0x4537’. Alternately,
you can set GDB to print the source file and line number when
it prints a symbolic address:
set print symbol-filename on-
Tell GDB to print the source file name and line number of a
symbol in the symbolic form of an address. set print symbol-filename off-
Do not print source file name and line number of a symbol. This is the
default. show print symbol-filename-
Show whether or not GDB will print the source file name and
line number of a symbol in the symbolic form of an address.
Another situation where it is helpful to show symbol filenames and line
numbers is when disassembling code; GDB shows you the line
number and source file that corresponds to each instruction.
Also, you may wish to see the symbolic form only if the address being
printed is reasonably close to the closest earlier symbol:
set print max-symbolic-offset max-offsetset print max-symbolic-offset unlimited-
Tell GDB to only display the symbolic form of an address if the
offset between the closest earlier symbol and the address is less than
max-offset. The default isunlimited, which tells GDB
to always print the symbolic form of an address if any symbol precedes
it. Zero is equivalent tounlimited. show print max-symbolic-offset-
Ask how large the maximum offset is that GDB prints in a
symbolic address.
If you have a pointer and you are not sure where it points, try
‘set print symbol-filename on’. Then you can determine the name
and source file location of the variable where it points, using
‘p/a pointer’. This interprets the address in symbolic form.
For example, here GDB shows that a variable ptt points
at another variable t, defined in hi2.c:
(gdb) set print symbol-filename on (gdb) p/a ptt $4 = 0xe008 <t in hi2.c>
Warning: For pointers that point to a local variable, ‘p/a’
does not show the symbol name and filename of the referent, even with
the appropriateset printoptions turned on.
You can also enable ‘/a’-like formatting all the time using
‘set print symbol on’:
set print symbol on-
Tell GDB to print the symbol corresponding to an address, if
one exists. set print symbol off-
Tell GDB not to print the symbol corresponding to an
address. In this mode, GDB will still print the symbol
corresponding to pointers to functions. This is the default. show print symbol-
Show whether GDB will display the symbol corresponding to an
address.
Other settings control how different kinds of objects are printed:
set print arrayset print array on-
Pretty print arrays. This format is more convenient to read,
but uses more space. The default is off. set print array off-
Return to compressed format for arrays.
show print array-
Show whether compressed or pretty format is selected for displaying
arrays. set print array-indexesset print array-indexes on-
Print the index of each element when displaying arrays. May be more
convenient to locate a given element in the array or quickly find the
index of a given element in that printed array. The default is off. set print array-indexes off-
Stop printing element indexes when displaying arrays.
show print array-indexes-
Show whether the index of each element is printed when displaying
arrays. set print nibblesset print nibbles on-
Print binary values in groups of four bits, known as nibbles,
when using the print command of GDB with the option ‘/t’.
For example, this is what it looks like withset print nibbles on:(gdb) print val_flags $1 = 1230 (gdb) print/t val_flags $2 = 0100 1100 1110
set print nibbles off-
Don’t printing binary values in groups. This is the default.
show print nibbles-
Show whether to print binary values in groups of four bits.
set print elements number-of-elementsset print elements unlimited-
Set a limit on how many elements of an array GDB will print.
If GDB is printing a large array, it stops printing after it has
printed the number of elements set by theset print elementscommand.
This limit also applies to the display of strings.
When GDB starts, this limit is set to 200.
Setting number-of-elements tounlimitedor zero means
that the number of elements to print is unlimited. show print elements-
Display the number of elements of a large array that GDB will print.
set print frame-arguments value-
This command allows to control how the values of arguments are printed
when the debugger prints a frame (see Frames). The possible
values are:all-
The values of all arguments are printed.
scalars-
Print the value of an argument only if it is a scalar. The value of more
complex arguments such as arrays, structures, unions, etc, is replaced
by…. This is the default. Here is an example where
only scalar arguments are shown:#1 0x08048361 in call_me (i=3, s=…, ss=0xbf8d508c, u=…, e=green) at frame-args.c:23
none-
None of the argument values are printed. Instead, the value of each argument
is replaced by…. In this case, the example above now becomes:#1 0x08048361 in call_me (i=…, s=…, ss=…, u=…, e=…) at frame-args.c:23
presence-
Only the presence of arguments is indicated by
….
The…are not printed for function without any arguments.
None of the argument names and values are printed.
In this case, the example above now becomes:#1 0x08048361 in call_me (…) at frame-args.c:23
By default, only scalar arguments are printed. This command can be used
to configure the debugger to print the value of all arguments, regardless
of their type. However, it is often advantageous to not print the value
of more complex parameters. For instance, it reduces the amount of
information printed in each frame, making the backtrace more readable.
Also, it improves performance when displaying Ada frames, because
the computation of large arguments can sometimes be CPU-intensive,
especially in large applications. Settingprint frame-arguments
toscalars(the default),noneorpresenceavoids
this computation, thus speeding up the display of each Ada frame. show print frame-arguments-
Show how the value of arguments should be displayed when printing a frame.
set print raw-frame-arguments on-
Print frame arguments in raw, non pretty-printed, form.
set print raw-frame-arguments off-
Print frame arguments in pretty-printed form, if there is a pretty-printer
for the value (see Pretty Printing),
otherwise print the value in raw form.
This is the default. show print raw-frame-arguments-
Show whether to print frame arguments in raw form.
set print entry-values value-
Set printing of frame argument values at function entry. In some cases
GDB can determine the value of function argument which was passed by
the function caller, even if the value was modified inside the called function
and therefore is different. With optimized code, the current value could be
unavailable, but the entry value may still be known.The default value is
default(see below for its description). Older
GDB behaved as with the settingno. Compilers not supporting
this feature will behave in thedefaultsetting the same way as with the
nosetting.This functionality is currently supported only by DWARF 2 debugging format and
the compiler has to produce ‘DW_TAG_call_site’ tags. With
GCC, you need to specify -O -g during compilation, to get
this information.The value parameter can be one of the following:
no-
Print only actual parameter values, never print values from function entry
point.#0 equal (val=5) #0 different (val=6) #0 lost (val=<optimized out>) #0 born (val=10) #0 invalid (val=<optimized out>)
only-
Print only parameter values from function entry point. The actual parameter
values are never printed.#0 equal (val@entry=5) #0 different (val@entry=5) #0 lost (val@entry=5) #0 born (val@entry=<optimized out>) #0 invalid (val@entry=<optimized out>)
preferred-
Print only parameter values from function entry point. If value from function
entry point is not known while the actual value is known, print the actual
value for such parameter.#0 equal (val@entry=5) #0 different (val@entry=5) #0 lost (val@entry=5) #0 born (val=10) #0 invalid (val@entry=<optimized out>)
if-needed-
Print actual parameter values. If actual parameter value is not known while
value from function entry point is known, print the entry point value for such
parameter.#0 equal (val=5) #0 different (val=6) #0 lost (val@entry=5) #0 born (val=10) #0 invalid (val=<optimized out>)
both-
Always print both the actual parameter value and its value from function entry
point, even if values of one or both are not available due to compiler
optimizations.#0 equal (val=5, val@entry=5) #0 different (val=6, val@entry=5) #0 lost (val=<optimized out>, val@entry=5) #0 born (val=10, val@entry=<optimized out>) #0 invalid (val=<optimized out>, val@entry=<optimized out>)
compact-
Print the actual parameter value if it is known and also its value from
function entry point if it is known. If neither is known, print for the actual
value<optimized out>. If not in MI mode (see GDB/MI) and if both
values are known and identical, print the shortened
param=param@entry=VALUEnotation.#0 equal (val=val@entry=5) #0 different (val=6, val@entry=5) #0 lost (val@entry=5) #0 born (val=10) #0 invalid (val=<optimized out>)
default-
Always print the actual parameter value. Print also its value from function
entry point, but only if it is known. If not in MI mode (see GDB/MI) and
if both values are known and identical, print the shortened
param=param@entry=VALUEnotation.#0 equal (val=val@entry=5) #0 different (val=6, val@entry=5) #0 lost (val=<optimized out>, val@entry=5) #0 born (val=10) #0 invalid (val=<optimized out>)
For analysis messages on possible failures of frame argument values at function
entry resolution see set debug entry-values. show print entry-values-
Show the method being used for printing of frame argument values at function
entry. set print frame-info value-
This command allows to control the information printed when
the debugger prints a frame. See Frames, Backtrace,
for a general explanation about frames and frame information.
Note that some other settings (such asset print frame-arguments
andset print address) are also influencing if and how some frame
information is displayed. In particular, the frame program counter is never
printed ifset print addressis off.The possible values for
set print frame-infoare:short-location-
Print the frame level, the program counter (if not at the
beginning of the location source line), the function, the function
arguments. location-
Same as
short-locationbut also print the source file and source line
number. location-and-address-
Same as
locationbut print the program counter even if located at the
beginning of the location source line. source-line-
Print the program counter (if not at the beginning of the location
source line), the line number and the source line. source-and-location-
Print what
locationandsource-lineare printing. auto-
The information printed for a frame is decided automatically
by the GDB command that prints a frame.
For example,frameprints the information printed by
source-and-locationwhilestepiwill switch between
source-lineandsource-and-locationdepending on the program
counter.
The default value isauto.
set print repeats number-of-repeatsset print repeats unlimited-
Set the threshold for suppressing display of repeated array
elements. When the number of consecutive identical elements of an
array exceeds the threshold, GDB prints the string
"<repeats n times>", where n is the number of
identical repetitions, instead of displaying the identical elements
themselves. Setting the threshold tounlimitedor zero will
cause all elements to be individually printed. The default threshold
is 10. show print repeats-
Display the current threshold for printing repeated identical
elements. set print max-depth depthset print max-depth unlimited-
Set the threshold after which nested structures are replaced with
ellipsis, this can make visualising deeply nested structures easier.For example, given this C code
typedef struct s1 { int a; } s1; typedef struct s2 { s1 b; } s2; typedef struct s3 { s2 c; } s3; typedef struct s4 { s3 d; } s4; s4 var = { { { { 3 } } } };The following table shows how different values of depth will
effect howvaris printed by GDB:depth setting Result of ‘p var’ unlimited $1 = {d = {c = {b = {a = 3}}}}0$1 = {...}1$1 = {d = {...}}2$1 = {d = {c = {...}}}3$1 = {d = {c = {b = {...}}}}4$1 = {d = {c = {b = {a = 3}}}}To see the contents of structures that have been hidden the user can
either increase the print max-depth, or they can print the elements of
the structure that are visible, for example(gdb) set print max-depth 2 (gdb) p var $1 = {d = {c = {...}}} (gdb) p var.d $2 = {c = {b = {...}}} (gdb) p var.d.c $3 = {b = {a = 3}}The pattern used to replace nested structures varies based on
language, for most languages{...}is used, but Fortran uses
(...). show print max-depth-
Display the current threshold after which nested structures are
replaces with ellipsis. set print memory-tag-violationsset print memory-tag-violations on-
Cause GDB to display additional information about memory tag violations
when printing pointers and addresses. set print memory-tag-violations off-
Stop printing memory tag violation information.
show print memory-tag-violations-
Show whether memory tag violation information is displayed when printing
pointers and addresses. set print null-stop-
Cause GDB to stop printing the characters of an array when the first
NULL is encountered. This is useful when large arrays actually
contain only short strings.
The default is off. show print null-stop-
Show whether GDB stops printing an array on the first
NULL character. set print pretty on-
Cause GDB to print structures in an indented format with one member
per line, like this:$1 = { next = 0x0, flags = { sweet = 1, sour = 1 }, meat = 0x54 "Pork" } set print pretty off-
Cause GDB to print structures in a compact format, like this:
$1 = {next = 0x0, flags = {sweet = 1, sour = 1}, meat = 0x54 "Pork"}This is the default format.
show print pretty-
Show which format GDB is using to print structures.
set print raw-values on-
Print values in raw form, without applying the pretty
printers for the value. set print raw-values off-
Print values in pretty-printed form, if there is a pretty-printer
for the value (see Pretty Printing),
otherwise print the value in raw form.The default setting is “off”.
show print raw-values-
Show whether to print values in raw form.
set print sevenbit-strings on-
Print using only seven-bit characters; if this option is set,
GDB displays any eight-bit characters (in strings or
character values) using the notationnnn. This setting is
best if you are working in English (ASCII) and you use the
high-order bit of characters as a marker or “meta” bit. set print sevenbit-strings off-
Print full eight-bit characters. This allows the use of more
international character sets, and is the default. show print sevenbit-strings-
Show whether or not GDB is printing only seven-bit characters.
set print union on-
Tell GDB to print unions which are contained in structures
and other unions. This is the default setting. set print union off-
Tell GDB not to print unions which are contained in
structures and other unions. GDB will print"{...}"
instead. show print union-
Ask GDB whether or not it will print unions which are contained in
structures and other unions.For example, given the declarations
typedef enum {Tree, Bug} Species; typedef enum {Big_tree, Acorn, Seedling} Tree_forms; typedef enum {Caterpillar, Cocoon, Butterfly} Bug_forms; struct thing { Species it; union { Tree_forms tree; Bug_forms bug; } form; }; struct thing foo = {Tree, {Acorn}};with
set print union onin effect ‘p foo’ would print$1 = {it = Tree, form = {tree = Acorn, bug = Cocoon}}and with
set print union offin effect it would print$1 = {it = Tree, form = {...}}set print unionaffects programs written in C-like languages
and in Pascal.
These settings are of interest when debugging C++ programs:
set print demangleset print demangle on-
Print C++ names in their source form rather than in the encoded
(“mangled”) form passed to the assembler and linker for type-safe
linkage. The default is on. show print demangle-
Show whether C++ names are printed in mangled or demangled form.
set print asm-demangleset print asm-demangle on-
Print C++ names in their source form rather than their mangled form, even
in assembler code printouts such as instruction disassemblies.
The default is off. show print asm-demangle-
Show whether C++ names in assembly listings are printed in mangled
or demangled form. set demangle-style style-
Choose among several encoding schemes used by different compilers to represent
C++ names. If you omit style, you will see a list of possible
formats. The default value is auto, which lets GDB choose a
decoding style by inspecting your program. show demangle-style-
Display the encoding style currently in use for decoding C++ symbols.
set print objectset print object on-
When displaying a pointer to an object, identify the actual
(derived) type of the object rather than the declared type, using
the virtual function table. Note that the virtual function table is
required—this feature can only work for objects that have run-time
type identification; a single virtual method in the object’s declared
type is sufficient. Note that this setting is also taken into account when
working with variable objects via MI (see GDB/MI). set print object off-
Display only the declared type of objects, without reference to the
virtual function table. This is the default setting. show print object-
Show whether actual, or declared, object types are displayed.
set print static-membersset print static-members on-
Print static members when displaying a C++ object. The default is on.
set print static-members off-
Do not print static members when displaying a C++ object.
show print static-members-
Show whether C++ static members are printed or not.
set print pascal_static-membersset print pascal_static-members on-
Print static members when displaying a Pascal object. The default is on.
set print pascal_static-members off-
Do not print static members when displaying a Pascal object.
show print pascal_static-members-
Show whether Pascal static members are printed or not.
set print vtblset print vtbl on-
Pretty print C++ virtual function tables. The default is off.
(Thevtblcommands do not work on programs compiled with the HP
ANSI C++ compiler (aCC).) set print vtbl off-
Do not pretty print C++ virtual function tables.
show print vtbl-
Show whether C++ virtual function tables are pretty printed, or not.
10.10 Pretty Printing
GDB provides a mechanism to allow pretty-printing of values using
Python code. It greatly simplifies the display of complex objects. This
mechanism works for both MI and the CLI.
10.10.1 Pretty-Printer Introduction
When GDB prints a value, it first sees if there is a pretty-printer
registered for the value. If there is then GDB invokes the
pretty-printer to print the value. Otherwise the value is printed normally.
Pretty-printers are normally named. This makes them easy to manage.
The ‘info pretty-printer’ command will list all the installed
pretty-printers with their names.
If a pretty-printer can handle multiple data types, then its
subprinters are the printers for the individual data types.
Each such subprinter has its own name.
The format of the name is printer-name;subprinter-name.
Pretty-printers are installed by registering them with GDB.
Typically they are automatically loaded and registered when the corresponding
debug information is loaded, thus making them available without having to
do anything special.
There are three places where a pretty-printer can be registered.
- Pretty-printers registered globally are available when debugging
all inferiors. - Pretty-printers registered with a program space are available only
when debugging that program.
See Progspaces In Python, for more details on program spaces in Python. - Pretty-printers registered with an objfile are loaded and unloaded
with the corresponding objfile (e.g., shared library).
See Objfiles In Python, for more details on objfiles in Python.
See Selecting Pretty-Printers, for further information on how
pretty-printers are selected,
See Writing a Pretty-Printer, for implementing pretty printers
for new types.
10.10.2 Pretty-Printer Example
Here is how a C++ std::string looks without a pretty-printer:
(gdb) print s
$1 = {
static npos = 4294967295,
_M_dataplus = {
<std::allocator<char>> = {
<__gnu_cxx::new_allocator<char>> = {
<No data fields>}, <No data fields>
},
members of std::basic_string<char, std::char_traits<char>,
std::allocator<char> >::_Alloc_hider:
_M_p = 0x804a014 "abcd"
}
}
With a pretty-printer for std::string only the contents are printed:
(gdb) print s $2 = "abcd"
10.10.3 Pretty-Printer Commands
info pretty-printer [object-regexp [name-regexp]]-
Print the list of installed pretty-printers.
This includes disabled pretty-printers, which are marked as such.object-regexp is a regular expression matching the objects
whose pretty-printers to list.
Objects can beglobal, the program space’s file
(see Progspaces In Python),
and the object files within that program space (see Objfiles In Python).
See Selecting Pretty-Printers, for details on how GDB
looks up a printer from these three objects.name-regexp is a regular expression matching the name of the printers
to list. disable pretty-printer [object-regexp [name-regexp]]-
Disable pretty-printers matching object-regexp and name-regexp.
A disabled pretty-printer is not forgotten, it may be enabled again later. enable pretty-printer [object-regexp [name-regexp]]-
Enable pretty-printers matching object-regexp and name-regexp.
Example:
Suppose we have three pretty-printers installed: one from library1.so
named foo that prints objects of type foo, and
another from library2.so named bar that prints two types of objects,
bar1 and bar2.
(gdb) info pretty-printer
library1.so:
foo
library2.so:
bar
bar1
bar2
(gdb) info pretty-printer library2
library2.so:
bar
bar1
bar2
(gdb) disable pretty-printer library1
1 printer disabled
2 of 3 printers enabled
(gdb) info pretty-printer
library1.so:
foo [disabled]
library2.so:
bar
bar1
bar2
(gdb) disable pretty-printer library2 bar;bar1
1 printer disabled
1 of 3 printers enabled
(gdb) info pretty-printer library2
library2.so:
bar
bar1 [disabled]
bar2
(gdb) disable pretty-printer library2 bar
1 printer disabled
0 of 3 printers enabled
(gdb) info pretty-printer
library1.so:
foo [disabled]
library2.so:
bar [disabled]
bar1 [disabled]
bar2
Note that for bar the entire printer can be disabled,
as can each individual subprinter.
Printing values and frame arguments is done by default using
the enabled pretty printers.
The print option -raw-values and GDB setting
set print raw-values (see set print raw-values) can be
used to print values without applying the enabled pretty printers.
Similarly, the backtrace option -raw-frame-arguments and
GDB setting set print raw-frame-arguments
(see set print raw-frame-arguments) can be used to ignore the
enabled pretty printers when printing frame argument values.
10.11 Value History
Values printed by the print command are saved in the GDB
value history. This allows you to refer to them in other expressions.
Values are kept until the symbol table is re-read or discarded
(for example with the file or symbol-file commands).
When the symbol table changes, the value history is discarded,
since the values may contain pointers back to the types defined in the
symbol table.
The values printed are given history numbers by which you can
refer to them. These are successive integers starting with one.
print shows you the history number assigned to a value by
printing ‘$num = ’ before the value; here num is the
history number.
To refer to any previous value, use ‘$’ followed by the value’s
history number. The way print labels its output is designed to
remind you of this. Just $ refers to the most recent value in
the history, and $$ refers to the value before that.
$$n refers to the nth value from the end; $$2
is the value just prior to $$, $$1 is equivalent to
$$, and $$0 is equivalent to $.
For example, suppose you have just printed a pointer to a structure and
want to see the contents of the structure. It suffices to type
If you have a chain of structures where the component next points
to the next one, you can print the contents of the next one with this:
You can print successive links in the chain by repeating this
command—which you can do by just typing RET.
Note that the history records values, not expressions. If the value of
x is 4 and you type these commands:
then the value recorded in the value history by the print command
remains 4 even though the value of x has changed.
show values-
Print the last ten values in the value history, with their item numbers.
This is like ‘p $$9’ repeated ten times, except thatshowdoes not change the history.
values show values n-
Print ten history values centered on history item number n.
show values +-
Print ten history values just after the values last printed. If no more
values are available,show values +produces no display.
Pressing RET to repeat show values n has exactly the
same effect as ‘show values +’.
10.12 Convenience Variables
GDB provides convenience variables that you can use within
GDB to hold on to a value and refer to it later. These variables
exist entirely within GDB; they are not part of your program, and
setting a convenience variable has no direct effect on further execution
of your program. That is why you can use them freely.
Convenience variables are prefixed with ‘$’. Any name preceded by
‘$’ can be used for a convenience variable, unless it is one of
the predefined machine-specific register names (see Registers).
(Value history references, in contrast, are numbers preceded
by ‘$’. See Value History.)
You can save a value in a convenience variable with an assignment
expression, just as you would set a variable in your program.
For example:
would save in $foo the value contained in the object pointed to by
object_ptr.
Using a convenience variable for the first time creates it, but its
value is void until you assign a new value. You can alter the
value with another assignment at any time.
Convenience variables have no fixed types. You can assign a convenience
variable any type of value, including structures and arrays, even if
that variable already has a value of a different type. The convenience
variable, when used as an expression, has the type of its current value.
show convenience-
Print a list of convenience variables used so far, and their values,
as well as a list of the convenience functions.
Abbreviatedshow conv. init-if-undefined $variable = expression-
Set a convenience variable if it has not already been set. This is useful
for user-defined commands that keep some state. It is similar, in concept,
to using local static variables with initializers in C (except that
convenience variables are global). It can also be used to allow users to
override default values used in a command script.If the variable is already defined then the expression is not evaluated so
any side-effects do not occur.
One of the ways to use a convenience variable is as a counter to be
incremented or a pointer to be advanced. For example, to print
a field from successive elements of an array of structures:
set $i = 0 print bar[$i++]->contents
Repeat that command by typing RET.
Some convenience variables are created automatically by GDB and given
values likely to be useful.
$_-
The variable
$_is automatically set by thexcommand to
the last address examined (see Examining Memory). Other
commands which provide a default address forxto examine also
set$_to that address; these commands includeinfo line
andinfo breakpoint. The type of$_isvoid *
except when set by thexcommand, in which case it is a pointer
to the type of$__. $__-
The variable
$__is automatically set by thexcommand
to the value found in the last address examined. Its type is chosen
to match the format in which the data was printed. $_exitcode-
When the program being debugged terminates normally, GDB
automatically sets this variable to the exit code of the program, and
resets$_exitsignaltovoid. $_exitsignal-
When the program being debugged dies due to an uncaught signal,
GDB automatically sets this variable to that signal’s number,
and resets$_exitcodetovoid.To distinguish between whether the program being debugged has exited
(i.e.,$_exitcodeis notvoid) or signalled (i.e.,
$_exitsignalis notvoid), the convenience function
$_isvoidcan be used (see Convenience
Functions). For example, considering the following source code:#include <signal.h> int main (int argc, char *argv[]) { raise (SIGALRM); return 0; }A valid way of telling whether the program being debugged has exited
or signalled would be:(gdb) define has_exited_or_signalled Type commands for definition of ``has_exited_or_signalled''. End with a line saying just ``end''. >if $_isvoid ($_exitsignal) >echo The program has exitedn >else >echo The program has signalledn >end >end (gdb) run Starting program: Program terminated with signal SIGALRM, Alarm clock. The program no longer exists. (gdb) has_exited_or_signalled The program has signalled
As can be seen, GDB correctly informs that the program being
debugged has signalled, since it callsraiseand raises a
SIGALRMsignal. If the program being debugged had not called
raise, then GDB would report a normal exit:(gdb) has_exited_or_signalled The program has exited
$_exception-
The variable
$_exceptionis set to the exception object being
thrown at an exception-related catchpoint. See Set Catchpoints. $_ada_exception-
The variable
$_ada_exceptionis set to the address of the
exception being caught or thrown at an Ada exception-related
catchpoint. See Set Catchpoints. $_probe_argc$_probe_arg0…$_probe_arg11-
Arguments to a static probe. See Static Probe Points.
$_sdata-
The variable
$_sdatacontains extra collected static tracepoint
data. See Tracepoint Action Lists. Note that
$_sdatacould be empty, if not inspecting a trace buffer, or
if extra static tracepoint data has not been collected. $_siginfo-
The variable
$_siginfocontains extra signal information
(see extra signal information). Note that$_siginfo
could be empty, if the application has not yet received any signals.
For example, it will be empty before you execute theruncommand. $_tlb-
The variable
$_tlbis automatically set when debugging
applications running on MS-Windows in native mode or connected to
gdbserver that supports theqGetTIBAddrrequest.
See General Query Packets.
This variable contains the address of the thread information block. $_inferior-
The number of the current inferior. See Debugging Multiple Inferiors Connections and Programs.
$_thread-
The thread number of the current thread. See thread numbers.
$_gthread-
The global number of the current thread. See global thread numbers.
$_inferior_thread_count-
The number of live threads in the current inferior. See Threads.
$_gdb_major$_gdb_minor-
The major and minor version numbers of the running GDB.
Development snapshots and pretest versions have their minor version
incremented by one; thus, GDB pretest 9.11.90 will produce
the value 12 for$_gdb_minor. These variables allow you to
write scripts that work with different versions of GDB
without errors caused by features unavailable in some of those
versions. $_shell_exitcode$_shell_exitsignal-
GDB commands such as
shelland|are launching
shell commands. When a launched command terminates, GDB
automatically maintains the variables$_shell_exitcode
and$_shell_exitsignalaccording to the exit status of the last
launched command. These variables are set and used similarly to
the variables$_exitcodeand$_exitsignal.
10.13 Convenience Functions
GDB also supplies some convenience functions. These
have a syntax similar to convenience variables. A convenience
function can be used in an expression just like an ordinary function;
however, a convenience function is implemented internally to
GDB.
These functions do not require GDB to be configured with
Python support, which means that they are always available.
$_isvoid (expr)-
Return one if the expression expr is
void. Otherwise it
returns zero.A
voidexpression is an expression where the type of the result
isvoid. For example, you can examine a convenience variable
(see Convenience Variables) to check whether
it isvoid:(gdb) print $_exitcode $1 = void (gdb) print $_isvoid ($_exitcode) $2 = 1 (gdb) run Starting program: ./a.out [Inferior 1 (process 29572) exited normally] (gdb) print $_exitcode $3 = 0 (gdb) print $_isvoid ($_exitcode) $4 = 0
In the example above, we used
$_isvoidto check whether
$_exitcodeisvoidbefore and after the execution of the
program being debugged. Before the execution there is no exit code to
be examined, therefore$_exitcodeisvoid. After the
execution the program being debugged returned zero, therefore
$_exitcodeis zero, which means that it is notvoid
anymore.The
voidexpression can also be a call of a function from the
program being debugged. For example, given the following function:The result of calling it inside GDB is
void:(gdb) print foo () $1 = void (gdb) print $_isvoid (foo ()) $2 = 1 (gdb) set $v = foo () (gdb) print $v $3 = void (gdb) print $_isvoid ($v) $4 = 1
$_gdb_setting_str (setting)-
Return the value of the GDB setting as a string.
setting is any setting that can be used in asetor
showcommand (see Controlling GDB).(gdb) show print frame-arguments Printing of non-scalar frame arguments is "scalars". (gdb) p $_gdb_setting_str("print frame-arguments") $1 = "scalars" (gdb) p $_gdb_setting_str("height") $2 = "30" (gdb) $_gdb_setting (setting)-
Return the value of the GDB setting.
The type of the returned value depends on the setting.The value type for boolean and auto boolean settings is
int.
The boolean valuesoffandonare converted to
the integer values0and1. The valueautois
converted to the value-1.The value type for integer settings is either
unsigned int
orint, depending on the setting.Some integer settings accept an
unlimitedvalue.
Depending on the setting, thesetcommand also accepts
the value0or the value-1as a synonym for
unlimited.
For example,set height unlimitedis equivalent to
set height 0.Some other settings that accept the
unlimitedvalue
use the value0to literally mean zero.
For example,set history size 0indicates to not
record any GDB commands in the command history.
For such settings,-1is the synonym
forunlimited.See the documentation of the corresponding
setcommand for
the numerical value equivalent tounlimited.The
$_gdb_settingfunction converts the unlimited value
to a0or a-1value according to what the
setcommand uses.(gdb) p $_gdb_setting_str("height") $1 = "30" (gdb) p $_gdb_setting("height") $2 = 30 (gdb) set height unlimited (gdb) p $_gdb_setting_str("height") $3 = "unlimited" (gdb) p $_gdb_setting("height") $4 = 0(gdb) p $_gdb_setting_str("history size") $5 = "unlimited" (gdb) p $_gdb_setting("history size") $6 = -1 (gdb) p $_gdb_setting_str("disassemble-next-line") $7 = "auto" (gdb) p $_gdb_setting("disassemble-next-line") $8 = -1 (gdb)Other setting types (enum, filename, optional filename, string, string noescape)
are returned as string values. $_gdb_maint_setting_str (setting)-
Like the
$_gdb_setting_strfunction, but works with
maintenance setvariables. $_gdb_maint_setting (setting)-
Like the
$_gdb_settingfunction, but works with
maintenance setvariables.
The following functions require GDB to be configured with
Python support.
$_memeq(buf1, buf2, length)-
Returns one if the length bytes at the addresses given by
buf1 and buf2 are equal.
Otherwise it returns zero. $_regex(str, regex)-
Returns one if the string str matches the regular expression
regex. Otherwise it returns zero.
The syntax of the regular expression is that specified byPython’s
regular expression support. $_streq(str1, str2)-
Returns one if the strings str1 and str2 are equal.
Otherwise it returns zero. $_strlen(str)-
Returns the length of string str.
$_caller_is(name[, number_of_frames])-
Returns one if the calling function’s name is equal to name.
Otherwise it returns zero.If the optional argument number_of_frames is provided,
it is the number of frames up in the stack to look.
The default is 1.Example:
(gdb) backtrace #0 bottom_func () at testsuite/gdb.python/py-caller-is.c:21 #1 0x00000000004005a0 in middle_func () at testsuite/gdb.python/py-caller-is.c:27 #2 0x00000000004005ab in top_func () at testsuite/gdb.python/py-caller-is.c:33 #3 0x00000000004005b6 in main () at testsuite/gdb.python/py-caller-is.c:39 (gdb) print $_caller_is ("middle_func") $1 = 1 (gdb) print $_caller_is ("top_func", 2) $1 = 1 $_caller_matches(regexp[, number_of_frames])-
Returns one if the calling function’s name matches the regular expression
regexp. Otherwise it returns zero.If the optional argument number_of_frames is provided,
it is the number of frames up in the stack to look.
The default is 1. $_any_caller_is(name[, number_of_frames])-
Returns one if any calling function’s name is equal to name.
Otherwise it returns zero.If the optional argument number_of_frames is provided,
it is the number of frames up in the stack to look.
The default is 1.This function differs from
$_caller_isin that this function
checks all stack frames from the immediate caller to the frame specified
by number_of_frames, whereas$_caller_isonly checks the
frame specified by number_of_frames. $_any_caller_matches(regexp[, number_of_frames])-
Returns one if any calling function’s name matches the regular expression
regexp. Otherwise it returns zero.If the optional argument number_of_frames is provided,
it is the number of frames up in the stack to look.
The default is 1.This function differs from
$_caller_matchesin that this function
checks all stack frames from the immediate caller to the frame specified
by number_of_frames, whereas$_caller_matchesonly checks the
frame specified by number_of_frames. $_as_string(value)-
Return the string representation of value.
This function is useful to obtain the textual label (enumerator) of an
enumeration value. For example, assuming the variable node is of
an enumerated type:(gdb) printf "Visiting node of type %sn", $_as_string(node) Visiting node of type NODE_INTEGER
$_cimag(value)$_creal(value)-
Return the imaginary (
$_cimag) or real ($_creal) part of
the complex number value.The type of the imaginary or real part depends on the type of the
complex number, e.g., using$_cimagon afloat complex
will return an imaginary part of typefloat.
GDB provides the ability to list and get help on
convenience functions.
help function-
Print a list of all convenience functions.
10.14 Registers
You can refer to machine register contents, in expressions, as variables
with names starting with ‘$’. The names of registers are different
for each machine; use info registers to see the names used on
your machine.
info registers-
Print the names and values of all registers except floating-point
and vector registers (in the selected stack frame). info all-registers-
Print the names and values of all registers, including floating-point
and vector registers (in the selected stack frame). info registers reggroup …-
Print the name and value of the registers in each of the specified
reggroups. The reggroup can be any of those returned by
maint print reggroups(see Maintenance Commands). info registers regname …-
Print the relativized value of each specified register regname.
As discussed in detail below, register values are normally relative to
the selected stack frame. The regname may be any register name valid on
the machine you are using, with or without the initial ‘$’.
GDB has four “standard” register names that are available (in
expressions) on most machines—whenever they do not conflict with an
architecture’s canonical mnemonics for registers. The register names
$pc and $sp are used for the program counter register and
the stack pointer. $fp is used for a register that contains a
pointer to the current stack frame, and $ps is used for a
register that contains the processor status. For example,
you could print the program counter in hex with
or print the instruction to be executed next with
or add four to the stack pointer12 with
Whenever possible, these four standard register names are available on
your machine even though the machine has different canonical mnemonics,
so long as there is no conflict. The info registers command
shows the canonical names. For example, on the SPARC, info displays the processor status register as
registers$psr but you
can also refer to it as $ps; and on x86-based machines $ps
is an alias for the EFLAGS register.
GDB always considers the contents of an ordinary register as an
integer when the register is examined in this way. Some machines have
special registers which can hold nothing but floating point; these
registers are considered to have floating point values. There is no way
to refer to the contents of an ordinary register as floating point value
(although you can print it as a floating point value with
‘print/f $regname’).
Some registers have distinct “raw” and “virtual” data formats. This
means that the data format in which the register contents are saved by
the operating system is not the same one that your program normally
sees. For example, the registers of the 68881 floating point
coprocessor are always saved in “extended” (raw) format, but all C
programs expect to work with “double” (virtual) format. In such
cases, GDB normally works with the virtual format only (the format
that makes sense for your program), but the info registers command
prints the data in both formats.
Some machines have special registers whose contents can be interpreted
in several different ways. For example, modern x86-based machines
have SSE and MMX registers that can hold several values packed
together in several different formats. GDB refers to such
registers in struct notation:
(gdb) print $xmm1
$1 = {
v4_float = {0, 3.43859137e-038, 1.54142831e-044, 1.821688e-044},
v2_double = {9.92129282474342e-303, 2.7585945287983262e-313},
v16_int8 = "000000003706;01v000000r0000",
v8_int16 = {0, 0, 14072, 315, 11, 0, 13, 0},
v4_int32 = {0, 20657912, 11, 13},
v2_int64 = {88725056443645952, 55834574859},
uint128 = 0x0000000d0000000b013b36f800000000
}
To set values of such registers, you need to tell GDB which
view of the register you wish to change, as if you were assigning
value to a struct member:
(gdb) set $xmm1.uint128 = 0x000000000000000000000000FFFFFFFF
Normally, register values are relative to the selected stack frame
(see Selecting a Frame). This means that you get the
value that the register would contain if all stack frames farther in
were exited and their saved registers restored. In order to see the
true contents of hardware registers, you must select the innermost
frame (with ‘frame 0’).
Usually ABIs reserve some registers as not needed to be saved by the
callee (a.k.a.: “caller-saved”, “call-clobbered” or “volatile”
registers). It may therefore not be possible for GDB to know
the value a register had before the call (in other words, in the outer
frame), if the register value has since been changed by the callee.
GDB tries to deduce where the inner frame saved
(“callee-saved”) registers, from the debug info, unwind info, or the
machine code generated by your compiler. If some register is not
saved, and GDB knows the register is “caller-saved” (via
its own knowledge of the ABI, or because the debug/unwind info
explicitly says the register’s value is undefined), GDB
displays ‘<not saved>’ as the register’s value. With targets
that GDB has no knowledge of the register saving convention,
if a register was not saved by the callee, then its value and location
in the outer frame are assumed to be the same of the inner frame.
This is usually harmless, because if the register is call-clobbered,
the caller either does not care what is in the register after the
call, or has code to restore the value that it does care about. Note,
however, that if you change such a register in the outer frame, you
may also be affecting the inner frame. Also, the more “outer” the
frame is you’re looking at, the more likely a call-clobbered
register’s value is to be wrong, in the sense that it doesn’t actually
represent the value the register had just before the call.
10.15 Floating Point Hardware
Depending on the configuration, GDB may be able to give
you more information about the status of the floating point hardware.
info float-
Display hardware-dependent information about the floating
point unit. The exact contents and layout vary depending on the
floating point chip. Currently, ‘info float’ is supported on
the ARM and x86 machines.
10.16 Vector Unit
Depending on the configuration, GDB may be able to give you
more information about the status of the vector unit.
info vector-
Display information about the vector unit. The exact contents and
layout vary depending on the hardware.
10.17 Operating System Auxiliary Information
GDB provides interfaces to useful OS facilities that can help
you debug your program.
Some operating systems supply an auxiliary vector to programs at
startup. This is akin to the arguments and environment that you
specify for a program, but contains a system-dependent variety of
binary values that tell system libraries important details about the
hardware, operating system, and process. Each value’s purpose is
identified by an integer tag; the meanings are well-known but system-specific.
Depending on the configuration and operating system facilities,
GDB may be able to show you this information. For remote
targets, this functionality may further depend on the remote stub’s
support of the ‘qXfer:auxv:read’ packet, see
qXfer auxiliary vector read.
info auxv-
Display the auxiliary vector of the inferior, which can be either a
live process or a core dump file. GDB prints each tag value
numerically, and also shows names and text descriptions for recognized
tags. Some values in the vector are numbers, some bit masks, and some
pointers to strings or other data. GDB displays each value in the
most appropriate form for a recognized tag, and in hexadecimal for
an unrecognized tag.
On some targets, GDB can access operating system-specific
information and show it to you. The types of information available
will differ depending on the type of operating system running on the
target. The mechanism used to fetch the data is described in
Operating System Information. For remote targets, this
functionality depends on the remote stub’s support of the
‘qXfer:osdata:read’ packet, see qXfer osdata read.
info os infotype-
Display OS information of the requested type.
On GNU/Linux, the following values of infotype are valid:
cpus-
Display the list of all CPUs/cores. For each CPU/core, GDB prints
the available fields from /proc/cpuinfo. For each supported architecture
different fields are available. Two common entries are processor which gives
CPU number and bogomips; a system constant that is calculated during
kernel initialization. files-
Display the list of open file descriptors on the target. For each
file descriptor, GDB prints the identifier of the process
owning the descriptor, the command of the owning process, the value
of the descriptor, and the target of the descriptor. modules-
Display the list of all loaded kernel modules on the target. For each
module, GDB prints the module name, the size of the module in
bytes, the number of times the module is used, the dependencies of the
module, the status of the module, and the address of the loaded module
in memory. msg-
Display the list of all System V message queues on the target. For each
message queue, GDB prints the message queue key, the message
queue identifier, the access permissions, the current number of bytes
on the queue, the current number of messages on the queue, the processes
that last sent and received a message on the queue, the user and group
of the owner and creator of the message queue, the times at which a
message was last sent and received on the queue, and the time at which
the message queue was last changed. processes-
Display the list of processes on the target. For each process,
GDB prints the process identifier, the name of the user, the
command corresponding to the process, and the list of processor cores
that the process is currently running on. (To understand what these
properties mean, for this and the following info types, please consult
the general GNU/Linux documentation.) procgroups-
Display the list of process groups on the target. For each process,
GDB prints the identifier of the process group that it belongs
to, the command corresponding to the process group leader, the process
identifier, and the command line of the process. The list is sorted
first by the process group identifier, then by the process identifier,
so that processes belonging to the same process group are grouped together
and the process group leader is listed first. semaphores-
Display the list of all System V semaphore sets on the target. For each
semaphore set, GDB prints the semaphore set key, the semaphore
set identifier, the access permissions, the number of semaphores in the
set, the user and group of the owner and creator of the semaphore set,
and the times at which the semaphore set was operated upon and changed. shm-
Display the list of all System V shared-memory regions on the target.
For each shared-memory region, GDB prints the region key,
the shared-memory identifier, the access permissions, the size of the
region, the process that created the region, the process that last
attached to or detached from the region, the current number of live
attaches to the region, and the times at which the region was last
attached to, detach from, and changed. sockets-
Display the list of Internet-domain sockets on the target. For each
socket, GDB prints the address and port of the local and
remote endpoints, the current state of the connection, the creator of
the socket, the IP address family of the socket, and the type of the
connection. threads-
Display the list of threads running on the target. For each thread,
GDB prints the identifier of the process that the thread
belongs to, the command of the process, the thread identifier, and the
processor core that it is currently running on. The main thread of a
process is not listed.
info os-
If infotype is omitted, then list the possible values for
infotype and the kind of OS information available for each
infotype. If the target does not return a list of possible
types, this command will report an error.
10.18 Memory Region Attributes
Memory region attributes allow you to describe special handling
required by regions of your target’s memory. GDB uses
attributes to determine whether to allow certain types of memory
accesses; whether to use specific width accesses; and whether to cache
target memory. By default the description of memory regions is
fetched from the target (if the current target supports this), but the
user can override the fetched regions.
Defined memory regions can be individually enabled and disabled. When a
memory region is disabled, GDB uses the default attributes when
accessing memory in that region. Similarly, if no memory regions have
been defined, GDB uses the default attributes when accessing
all memory.
When a memory region is defined, it is given a number to identify it;
to enable, disable, or remove a memory region, you specify that number.
mem lower upper attributes…-
Define a memory region bounded by lower and upper with
attributes attributes…, and add it to the list of regions
monitored by GDB. Note that upper == 0 is a special
case: it is treated as the target’s maximum memory address.
(0xffff on 16 bit targets, 0xffffffff on 32 bit targets, etc.) mem auto-
Discard any user changes to the memory regions and use target-supplied
regions, if available, or no regions if the target does not support. delete mem nums…-
Remove memory regions nums… from the list of regions
monitored by GDB. disable mem nums…-
Disable monitoring of memory regions nums….
A disabled memory region is not forgotten.
It may be enabled again later. enable mem nums…-
Enable monitoring of memory regions nums….
info mem-
Print a table of all defined memory regions, with the following columns
for each region:- Memory Region Number
- Enabled or Disabled.
-
Enabled memory regions are marked with ‘y’.
Disabled memory regions are marked with ‘n’. - Lo Address
-
The address defining the inclusive lower bound of the memory region.
- Hi Address
-
The address defining the exclusive upper bound of the memory region.
- Attributes
-
The list of attributes set for this memory region.
10.18.1 Attributes
10.18.1.1 Memory Access Mode
The access mode attributes set whether GDB may make read or
write accesses to a memory region.
While these attributes prevent GDB from performing invalid
memory accesses, they do nothing to prevent the target system, I/O DMA,
etc. from accessing memory.
ro-
Memory is read only.
wo-
Memory is write only.
rw-
Memory is read/write. This is the default.
10.18.1.2 Memory Access Size
The access size attribute tells GDB to use specific sized
accesses in the memory region. Often memory mapped device registers
require specific sized accesses. If no access size attribute is
specified, GDB may use accesses of any size.
8-
Use 8 bit memory accesses.
16-
Use 16 bit memory accesses.
32-
Use 32 bit memory accesses.
64-
Use 64 bit memory accesses.
10.18.1.3 Data Cache
The data cache attributes set whether GDB will cache target
memory. While this generally improves performance by reducing debug
protocol overhead, it can lead to incorrect results because GDB
does not know about volatile variables or memory mapped device
registers.
cache-
Enable GDB to cache target memory.
nocache-
Disable GDB from caching target memory. This is the default.
10.18.2 Memory Access Checking
GDB can be instructed to refuse accesses to memory that is
not explicitly described. This can be useful if accessing such
regions has undesired effects for a specific target, or to provide
better error checking. The following commands control this behaviour.
set mem inaccessible-by-default [on|off]-
If
onis specified, make GDB treat memory not
explicitly described by the memory ranges as non-existent and refuse accesses
to such memory. The checks are only performed if there’s at least one
memory range defined. Ifoffis specified, make GDB
treat the memory not explicitly described by the memory ranges as RAM.
The default value ison. show mem inaccessible-by-default-
Show the current handling of accesses to unknown memory.
10.19 Copy Between Memory and a File
You can use the commands dump, append, and
restore to copy data between target memory and a file. The
dump and append commands write data to a file, and the
restore command reads data from a file back into the inferior’s
memory. Files may be in binary, Motorola S-record, Intel hex,
Tektronix Hex, or Verilog Hex format; however, GDB can only
append to binary files, and cannot read from Verilog Hex files.
dump [format] memory filename start_addr end_addrdump [format] value filename expr-
Dump the contents of memory from start_addr to end_addr,
or the value of expr, to filename in the given format.The format parameter may be any one of:
binary-
Raw binary form.
ihex-
Intel hex format.
srec-
Motorola S-record format.
tekhex-
Tektronix Hex format.
verilog-
Verilog Hex format.
GDB uses the same definitions of these formats as the
GNU binary utilities, like ‘objdump’ and ‘objcopy’. If
format is omitted, GDB dumps the data in raw binary
form. append [binary] memory filename start_addr end_addrappend [binary] value filename expr-
Append the contents of memory from start_addr to end_addr,
or the value of expr, to the file filename, in raw binary form.
(GDB can only append data to files in raw binary form.) restore filename [binary] bias start end-
Restore the contents of file filename into memory. The
restorecommand can automatically recognize any known BFD
file format, except for raw binary. To restore a raw binary file you
must specify the optional keywordbinaryafter the filename.If bias is non-zero, its value will be added to the addresses
contained in the file. Binary files always start at address zero, so
they will be restored at address bias. Other bfd files have
a built-in location; they will be restored at offset bias
from that location.If start and/or end are non-zero, then only data between
file offset start and file offset end will be restored.
These offsets are relative to the addresses in the file, before
the bias argument is applied.
10.20 How to Produce a Core File from Your Program
A core file or core dump is a file that records the memory
image of a running process and its process status (register values
etc.). Its primary use is post-mortem debugging of a program that
crashed while it ran outside a debugger. A program that crashes
automatically produces a core file, unless this feature is disabled by
the user. See Files, for information on invoking GDB in
the post-mortem debugging mode.
Occasionally, you may wish to produce a core file of the program you
are debugging in order to preserve a snapshot of its state.
GDB has a special command for that.
generate-core-file [file]gcore [file]-
Produce a core dump of the inferior process. The optional argument
file specifies the file name where to put the core dump. If not
specified, the file name defaults to core.pid, where
pid is the inferior process ID.Note that this command is implemented only for some systems (as of
this writing, GNU/Linux, FreeBSD, Solaris, and S390).On GNU/Linux, this command can take into account the value of the
file /proc/pid/coredump_filter when generating the core
dump (see set use-coredump-filter), and by default honors the
VM_DONTDUMPflag for mappings where it is present in the file
/proc/pid/smaps (see set dump-excluded-mappings). set use-coredump-filter onset use-coredump-filter off-
Enable or disable the use of the file
/proc/pid/coredump_filter when generating core dump
files. This file is used by the Linux kernel to decide what types of
memory mappings will be dumped or ignored when generating a core dump
file. pid is the process ID of a currently running process.To make use of this feature, you have to write in the
/proc/pid/coredump_filter file a value, in hexadecimal,
which is a bit mask representing the memory mapping types. If a bit
is set in the bit mask, then the memory mappings of the corresponding
types will be dumped; otherwise, they will be ignored. This
configuration is inherited by child processes. For more information
about the bits that can be set in the
/proc/pid/coredump_filter file, please refer to the
manpage ofcore(5).By default, this option is
on. If this option is turned
off, GDB does not read the coredump_filter file
and instead uses the same default value as the Linux kernel in order
to decide which pages will be dumped in the core dump file. This
value is currently0x33, which means that bits0
(anonymous private mappings),1(anonymous shared mappings),
4(ELF headers) and5(private huge pages) are active.
This will cause these memory mappings to be dumped automatically. set dump-excluded-mappings onset dump-excluded-mappings off-
If
onis specified, GDB will dump memory mappings
marked with theVM_DONTDUMPflag. This flag is represented in
the file /proc/pid/smaps with the acronymdd.The default value is
off.
10.21 Character Sets
If the program you are debugging uses a different character set to
represent characters and strings than the one GDB uses itself,
GDB can automatically translate between the character sets for
you. The character set GDB uses we call the host
character set; the one the inferior program uses we call the
target character set.
For example, if you are running GDB on a GNU/Linux system, which
uses the ISO Latin 1 character set, but you are using GDB’s
remote protocol (see Remote Debugging) to debug a program
running on an IBM mainframe, which uses the EBCDIC character set,
then the host character set is Latin-1, and the target character set is
EBCDIC. If you give GDB the command set, then GDB translates between
target-charset EBCDIC-US
EBCDIC and Latin 1 as you print character or string values, or use
character and string literals in expressions.
GDB has no way to automatically recognize which character set
the inferior program uses; you must tell it, using the set command, described below.
target-charset
Here are the commands for controlling GDB’s character set
support:
set target-charset charset-
Set the current target character set to charset. To display the
list of supported target character sets, type
set target-charset TABTAB. set host-charset charset-
Set the current host character set to charset.
By default, GDB uses a host character set appropriate to the
system it is running on; you can override that default using the
set host-charsetcommand. On some systems, GDB cannot
automatically determine the appropriate host character set. In this
case, GDB uses ‘UTF-8’.GDB can only use certain character sets as its host character
set. If you type set host-charset TABTAB,
GDB will list the host character sets it supports. set charset charset-
Set the current host and target character sets to charset. As
above, if you type set charset TABTAB,
GDB will list the names of the character sets that can be used
for both host and target. show charset-
Show the names of the current host and target character sets.
show host-charset-
Show the name of the current host character set.
show target-charset-
Show the name of the current target character set.
set target-wide-charset charset-
Set the current target’s wide character set to charset. This is
the character set used by the target’swchar_ttype. To
display the list of supported wide character sets, type
set target-wide-charset TABTAB. show target-wide-charset-
Show the name of the current target’s wide character set.
Here is an example of GDB’s character set support in action.
Assume that the following source code has been placed in the file
charset-test.c:
#include <stdio.h>
char ascii_hello[]
= {72, 101, 108, 108, 111, 44, 32, 119,
111, 114, 108, 100, 33, 10, 0};
char ibm1047_hello[]
= {200, 133, 147, 147, 150, 107, 64, 166,
150, 153, 147, 132, 90, 37, 0};
main ()
{
printf ("Hello, world!n");
}
In this program, ascii_hello and ibm1047_hello are arrays
containing the string ‘Hello, world!’ followed by a newline,
encoded in the ASCII and IBM1047 character sets.
We compile the program, and invoke the debugger on it:
$ gcc -g charset-test.c -o charset-test $ gdb -nw charset-test GNU gdb 2001-12-19-cvs Copyright 2001 Free Software Foundation, Inc. … (gdb)
We can use the show charset command to see what character sets
GDB is currently using to interpret and display characters and
strings:
(gdb) show charset The current host and target character set is `ISO-8859-1'. (gdb)
For the sake of printing this manual, let’s use ASCII as our
initial character set:
(gdb) set charset ASCII (gdb) show charset The current host and target character set is `ASCII'. (gdb)
Let’s assume that ASCII is indeed the correct character set for our
host system — in other words, let’s assume that if GDB prints
characters using the ASCII character set, our terminal will display
them properly. Since our current target character set is also
ASCII, the contents of ascii_hello print legibly:
(gdb) print ascii_hello $1 = 0x401698 "Hello, world!n" (gdb) print ascii_hello[0] $2 = 72 'H' (gdb)
GDB uses the target character set for character and string
literals you use in expressions:
(gdb) print '+' $3 = 43 '+' (gdb)
The ASCII character set uses the number 43 to encode the ‘+’
character.
GDB relies on the user to tell it which character set the
target program uses. If we print ibm1047_hello while our target
character set is still ASCII, we get jibberish:
(gdb) print ibm1047_hello $4 = 0x4016a8 "310205223223226k@246226231223204Z%" (gdb) print ibm1047_hello[0] $5 = 200 '310' (gdb)
If we invoke the set target-charset followed by TABTAB,
GDB tells us the character sets it supports:
(gdb) set target-charset ASCII EBCDIC-US IBM1047 ISO-8859-1 (gdb) set target-charset
We can select IBM1047 as our target character set, and examine the
program’s strings again. Now the ASCII string is wrong, but
GDB translates the contents of ibm1047_hello from the
target character set, IBM1047, to the host character set,
ASCII, and they display correctly:
(gdb) set target-charset IBM1047 (gdb) show charset The current host character set is `ASCII'. The current target character set is `IBM1047'. (gdb) print ascii_hello $6 = 0x401698 "110145%%?5440167?162%1444112" (gdb) print ascii_hello[0] $7 = 72 '110' (gdb) print ibm1047_hello $8 = 0x4016a8 "Hello, world!n" (gdb) print ibm1047_hello[0] $9 = 200 'H' (gdb)
As above, GDB uses the target character set for character and
string literals you use in expressions:
(gdb) print '+' $10 = 78 '+' (gdb)
The IBM1047 character set uses the number 78 to encode the ‘+’
character.
10.22 Caching Data of Targets
GDB caches data exchanged between the debugger and a target.
Each cache is associated with the address space of the inferior.
See Inferiors Connections and Programs, about inferior and address space.
Such caching generally improves performance in remote debugging
(see Remote Debugging), because it reduces the overhead of the
remote protocol by bundling memory reads and writes into large chunks.
Unfortunately, simply caching everything would lead to incorrect results,
since GDB does not necessarily know anything about volatile
values, memory-mapped I/O addresses, etc. Furthermore, in non-stop mode
(see Non-Stop Mode) memory can be changed while a gdb command
is executing.
Therefore, by default, GDB only caches data
known to be on the stack13 or
in the code segment.
Other regions of memory can be explicitly marked as
cacheable; see Memory Region Attributes.
set remotecache onset remotecache off-
This option no longer does anything; it exists for compatibility
with old scripts. show remotecache-
Show the current state of the obsolete remotecache flag.
set stack-cache onset stack-cache off-
Enable or disable caching of stack accesses. When
on, use
caching. By default, this option ison. show stack-cache-
Show the current state of data caching for memory accesses.
set code-cache onset code-cache off-
Enable or disable caching of code segment accesses. When
on,
use caching. By default, this option ison. This improves
performance of disassembly in remote debugging. show code-cache-
Show the current state of target memory cache for code segment
accesses. info dcache [line]-
Print the information about the performance of data cache of the
current inferior’s address space. The information displayed
includes the dcache width and depth, and for each cache line, its
number, address, and how many times it was referenced. This
command is useful for debugging the data cache operation.If a line number is specified, the contents of that line will be
printed in hex. set dcache size size-
Set maximum number of entries in dcache (dcache depth above).
set dcache line-size line-size-
Set number of bytes each dcache entry caches (dcache width above).
Must be a power of 2. show dcache size-
Show maximum number of dcache entries. See info dcache.
show dcache line-size-
Show default size of dcache lines.
maint flush dcache-
Flush the contents (if any) of the dcache. This maintainer command is
useful when debugging the dcache implementation.
10.23 Search Memory
Memory can be searched for a particular sequence of bytes with the
find command.
find [/sn] start_addr, +len, val1 [, val2, …]find [/sn] start_addr, end_addr, val1 [, val2, …]-
Search memory for the sequence of bytes specified by val1, val2,
etc. The search begins at address start_addr and continues for either
len bytes or through to end_addr inclusive.
s and n are optional parameters.
They may be specified in either order, apart or together.
- s, search query size
-
The size of each search query value.
b-
bytes
h-
halfwords (two bytes)
w-
words (four bytes)
g-
giant words (eight bytes)
All values are interpreted in the current language.
This means, for example, that if the current source language is C/C++
then searching for the string “hello” includes the trailing ’’.
The null terminator can be removed from searching by using casts,
e.g.: ‘{char[5]}»hello»’.If the value size is not specified, it is taken from the
value’s type in the current language.
This is useful when one wants to specify the search
pattern as a mixture of types.
Note that this means, for example, that in the case of C-like languages
a search for an untyped 0x42 will search for ‘(int) 0x42’
which is typically four bytes. - n, maximum number of finds
-
The maximum number of matches to print. The default is to print all finds.
You can use strings as search values. Quote them with double-quotes
(").
The string value is copied into the search pattern byte by byte,
regardless of the endianness of the target and the size specification.
The address of each match found is printed as well as a count of the
number of matches found.
The address of the last value found is stored in convenience variable
‘$_’.
A count of the number of matches is stored in ‘$numfound’.
For example, if stopped at the printf in this function:
void
hello ()
{
static char hello[] = "hello-hello";
static struct { char c; short s; int i; }
__attribute__ ((packed)) mixed
= { 'c', 0x1234, 0x87654321 };
printf ("%sn", hello);
}
you get during debugging:
(gdb) find &hello[0], +sizeof(hello), "hello"
0x804956d <hello.1620+6>
1 pattern found
(gdb) find &hello[0], +sizeof(hello), 'h', 'e', 'l', 'l', 'o'
0x8049567 <hello.1620>
0x804956d <hello.1620+6>
2 patterns found.
(gdb) find &hello[0], +sizeof(hello), {char[5]}"hello"
0x8049567 <hello.1620>
0x804956d <hello.1620+6>
2 patterns found.
(gdb) find /b1 &hello[0], +sizeof(hello), 'h', 0x65, 'l'
0x8049567 <hello.1620>
1 pattern found
(gdb) find &mixed, +sizeof(mixed), (char) 'c', (short) 0x1234, (int) 0x87654321
0x8049560 <mixed.1625>
1 pattern found
(gdb) print $numfound
$1 = 1
(gdb) print $_
$2 = (void *) 0x8049560
10.24 Value Sizes
Whenever GDB prints a value memory will be allocated within
GDB to hold the contents of the value. It is possible in
some languages with dynamic typing systems, that an invalid program
may indicate a value that is incorrectly large, this in turn may cause
GDB to try and allocate an overly large amount of memory.
set max-value-size bytesset max-value-size unlimited-
Set the maximum size of memory that GDB will allocate for the
contents of a value to bytes, trying to display a value that
requires more memory than that will result in an error.Setting this variable does not effect values that have already been
allocated within GDB, only future allocations.There’s a minimum size that
max-value-sizecan be set to in
order that GDB can still operate correctly, this minimum is
currently 16 bytes.The limit applies to the results of some subexpressions as well as to
complete expressions. For example, an expression denoting a simple
integer component, such asx.y.z, may fail if the size of
x.y is dynamic and exceeds bytes. On the other hand,
GDB is sometimes clever; the expressionA[i], where
A is an array variable with non-constant size, will generally
succeed regardless of the bounds on A, as long as the component
size is less than bytes.The default value of
max-value-sizeis currently 64k. show max-value-size-
Show the maximum size of memory, in bytes, that GDB will
allocate for the contents of a value.
11 Debugging Optimized Code
Almost all compilers support optimization. With optimization
disabled, the compiler generates assembly code that corresponds
directly to your source code, in a simplistic way. As the compiler
applies more powerful optimizations, the generated assembly code
diverges from your original source code. With help from debugging
information generated by the compiler, GDB can map from
the running program back to constructs from your original source.
GDB is more accurate with optimization disabled. If you
can recompile without optimization, it is easier to follow the
progress of your program during debugging. But, there are many cases
where you may need to debug an optimized version.
When you debug a program compiled with ‘-g -O’, remember that the
optimizer has rearranged your code; the debugger shows you what is
really there. Do not be too surprised when the execution path does not
exactly match your source file! An extreme example: if you define a
variable, but never use it, GDB never sees that
variable—because the compiler optimizes it out of existence.
Some things do not work as well with ‘-g -O’ as with just
‘-g’, particularly on machines with instruction scheduling. If in
doubt, recompile with ‘-g’ alone, and if this fixes the problem,
please report it to us as a bug (including a test case!).
See Variables, for more information about debugging optimized code.
11.1 Inline Functions
Inlining is an optimization that inserts a copy of the function
body directly at each call site, instead of jumping to a shared
routine. GDB displays inlined functions just like
non-inlined functions. They appear in backtraces. You can view their
arguments and local variables, step into them with step, skip
them with next, and escape from them with finish.
You can check whether a function was inlined by using the
info frame command.
For GDB to support inlined functions, the compiler must
record information about inlining in the debug information —
GCC using the DWARF 2 format does this, and several
other compilers do also. GDB only supports inlined functions
when using DWARF 2. Versions of GCC before 4.1
do not emit two required attributes (‘DW_AT_call_file’ and
‘DW_AT_call_line’); GDB does not display inlined
function calls with earlier versions of GCC. It instead
displays the arguments and local variables of inlined functions as
local variables in the caller.
The body of an inlined function is directly included at its call site;
unlike a non-inlined function, there are no instructions devoted to
the call. GDB still pretends that the call site and the
start of the inlined function are different instructions. Stepping to
the call site shows the call site, and then stepping again shows
the first line of the inlined function, even though no additional
instructions are executed.
This makes source-level debugging much clearer; you can see both the
context of the call and then the effect of the call. Only stepping by
a single instruction using stepi or nexti does not do
this; single instruction steps always show the inlined body.
There are some ways that GDB does not pretend that inlined
function calls are the same as normal calls:
- Setting breakpoints at the call site of an inlined function may not
work, because the call site does not contain any code. GDB
may incorrectly move the breakpoint to the next line of the enclosing
function, after the call. This limitation will be removed in a future
version of GDB; until then, set a breakpoint on an earlier line
or inside the inlined function instead. - GDB cannot locate the return value of inlined calls after
using thefinishcommand. This is a limitation of compiler-generated
debugging information; afterfinish, you can step to the next line
and print a variable where your program stored the return value.
11.2 Tail Call Frames
Function B can call function C in its very last statement. In
unoptimized compilation the call of C is immediately followed by return
instruction at the end of B code. Optimizing compiler may replace the
call and return in function B into one jump to function C
instead. Such use of a jump instruction is called tail call.
During execution of function C, there will be no indication in the
function call stack frames that it was tail-called from B. If function
A regularly calls function B which tail-calls function C,
then GDB will see A as the caller of C. However, in
some cases GDB can determine that C was tail-called from
B, and it will then create fictitious call frame for that, with the
return address set up as if B called C normally.
This functionality is currently supported only by DWARF 2 debugging format and
the compiler has to produce ‘DW_TAG_call_site’ tags. With
GCC, you need to specify -O -g during compilation, to get
this information.
info frame command (see Frame Info) will indicate the tail call frame
kind by text tail call frame such as in this sample GDB output:
(gdb) x/i $pc - 2 0x40066b <b(int, double)+11>: jmp 0x400640 <c(int, double)> (gdb) info frame Stack level 1, frame at 0x7fffffffda30: rip = 0x40066d in b (amd64-entry-value.cc:59); saved rip 0x4004c5 tail call frame, caller of frame at 0x7fffffffda30 source language c++. Arglist at unknown address. Locals at unknown address, Previous frame's sp is 0x7fffffffda30
The detection of all the possible code path executions can find them ambiguous.
There is no execution history stored (possible Reverse Execution is never
used for this purpose) and the last known caller could have reached the known
callee by multiple different jump sequences. In such case GDB still
tries to show at least all the unambiguous top tail callers and all the
unambiguous bottom tail calees, if any.
set debug entry-values-
When set to on, enables printing of analysis messages for both frame argument
values at function entry and tail calls. It will show all the possible valid
tail calls code paths it has considered. It will also print the intersection
of them with the final unambiguous (possibly partial or even empty) code path
result. show debug entry-values-
Show the current state of analysis messages printing for both frame argument
values at function entry and tail calls.
The analysis messages for tail calls can for example show why the virtual tail
call frame for function c has not been recognized (due to the indirect
reference by variable x):
static void __attribute__((noinline, noclone)) c (void);
void (*x) (void) = c;
static void __attribute__((noinline, noclone)) a (void) { x++; }
static void __attribute__((noinline, noclone)) c (void) { a (); }
int main (void) { x (); return 0; }
Breakpoint 1, DW_OP_entry_value resolving cannot find
DW_TAG_call_site 0x40039a in main
a () at t.c:3
3 static void __attribute__((noinline, noclone)) a (void) { x++; }
(gdb) bt
#0 a () at t.c:3
#1 0x000000000040039a in main () at t.c:5
Another possibility is an ambiguous virtual tail call frames resolution:
int i;
static void __attribute__((noinline, noclone)) f (void) { i++; }
static void __attribute__((noinline, noclone)) e (void) { f (); }
static void __attribute__((noinline, noclone)) d (void) { f (); }
static void __attribute__((noinline, noclone)) c (void) { d (); }
static void __attribute__((noinline, noclone)) b (void)
{ if (i) c (); else e (); }
static void __attribute__((noinline, noclone)) a (void) { b (); }
int main (void) { a (); return 0; }
tailcall: initial: 0x4004d2(a) 0x4004ce(b) 0x4004b2(c) 0x4004a2(d)
tailcall: compare: 0x4004d2(a) 0x4004cc(b) 0x400492(e)
tailcall: reduced: 0x4004d2(a) |
(gdb) bt
#0 f () at t.c:2
#1 0x00000000004004d2 in a () at t.c:8
#2 0x0000000000400395 in main () at t.c:9
Frames #0 and #2 are real, #1 is a virtual tail call frame.
The code can have possible execution paths main→a→b→c→d→f or
main→a→b→e→f, GDB cannot find which one from the inferior state.
initial: state shows some random possible calling sequence GDB
has found. It then finds another possible calling sequence — that one is
prefixed by compare:. The non-ambiguous intersection of these two is
printed as the reduced: calling sequence. That one could have many
further compare: and reduced: statements as long as there remain
any non-ambiguous sequence entries.
For the frame of function b in both cases there are different possible
$pc values (0x4004cc or 0x4004ce), therefore this frame is
also ambiguous. The only non-ambiguous frame is the one for function a,
therefore this one is displayed to the user while the ambiguous frames are
omitted.
There can be also reasons why printing of frame argument values at function
entry may fail:
int v;
static void __attribute__((noinline, noclone)) c (int i) { v++; }
static void __attribute__((noinline, noclone)) a (int i);
static void __attribute__((noinline, noclone)) b (int i) { a (i); }
static void __attribute__((noinline, noclone)) a (int i)
{ if (i) b (i - 1); else c (0); }
int main (void) { a (5); return 0; }
(gdb) bt
#0 c (i=i@entry=0) at t.c:2
#1 0x0000000000400428 in a (DW_OP_entry_value resolving has found
function "a" at 0x400420 can call itself via tail calls
i=<optimized out>) at t.c:6
#2 0x000000000040036e in main () at t.c:7
GDB cannot find out from the inferior state if and how many times did
function a call itself (via function b) as these calls would be
tail calls. Such tail calls would modify the i variable, therefore
GDB cannot be sure the value it knows would be right — GDB
prints <optimized out> instead.
12 C Preprocessor Macros
Some languages, such as C and C++, provide a way to define and invoke
“preprocessor macros” which expand into strings of tokens.
GDB can evaluate expressions containing macro invocations, show
the result of macro expansion, and show a macro’s definition, including
where it was defined.
You may need to compile your program specially to provide GDB
with information about preprocessor macros. Most compilers do not
include macros in their debugging information, even when you compile
with the -g flag. See Compilation.
A program may define a macro at one point, remove that definition later,
and then provide a different definition after that. Thus, at different
points in the program, a macro may have different definitions, or have
no definition at all. If there is a current stack frame, GDB
uses the macros in scope at that frame’s source code line. Otherwise,
GDB uses the macros in scope at the current listing location;
see List.
Whenever GDB evaluates an expression, it always expands any
macro invocations present in the expression. GDB also provides
the following commands for working with macros explicitly.
macro expand expressionmacro exp expression-
Show the results of expanding all preprocessor macro invocations in
expression. Since GDB simply expands macros, but does
not parse the result, expression need not be a valid expression;
it can be any string of tokens. macro expand-once expressionmacro exp1 expression-
(This command is not yet implemented.) Show the results of
expanding those preprocessor macro invocations that appear explicitly in
expression. Macro invocations appearing in that expansion are
left unchanged. This command allows you to see the effect of a
particular macro more clearly, without being confused by further
expansions. Since GDB simply expands macros, but does not
parse the result, expression need not be a valid expression; it
can be any string of tokens. info macro [-a|-all] [--] macro-
Show the current definition or all definitions of the named macro,
and describe the source location or compiler command-line where that
definition was established. The optional double dash is to signify the end of
argument processing and the beginning of macro for non C-like macros where
the macro may begin with a hyphen. info macros locspec-
Show all macro definitions that are in effect at the source line of
the code location that results from resolving locspec, and
describe the source location or compiler command-line where those
definitions were established. macro define macro replacement-listmacro define macro(arglist) replacement-list-
Introduce a definition for a preprocessor macro named macro,
invocations of which are replaced by the tokens given in
replacement-list. The first form of this command defines an
“object-like” macro, which takes no arguments; the second form
defines a “function-like” macro, which takes the arguments given in
arglist.A definition introduced by this command is in scope in every
expression evaluated in GDB, until it is removed with the
macro undefcommand, described below. The definition overrides
all definitions for macro present in the program being debugged,
as well as any previous user-supplied definition. macro undef macro-
Remove any user-supplied definition for the macro named macro.
This command only affects definitions provided with themacrocommand, described above; it cannot remove definitions present
define
in the program being debugged. macro list-
List all the macros defined using the
macro definecommand.
Here is a transcript showing the above commands in action. First, we
show our source files:
$ cat sample.c
#include <stdio.h>
#include "sample.h"
#define M 42
#define ADD(x) (M + x)
main ()
{
#define N 28
printf ("Hello, world!n");
#undef N
printf ("We're so creative.n");
#define N 1729
printf ("Goodbye, world!n");
}
$ cat sample.h
#define Q <
$
Now, we compile the program using the GNU C compiler,
GCC. We pass the -gdwarf-214 and -g3 flags to ensure the compiler
includes information about preprocessor macros in the debugging
information.
$ gcc -gdwarf-2 -g3 sample.c -o sample $
Now, we start GDB on our sample program:
$ gdb -nw sample GNU gdb 2002-05-06-cvs Copyright 2002 Free Software Foundation, Inc. GDB is free software, … (gdb)
We can expand macros and examine their definitions, even when the
program is not running. GDB uses the current listing position
to decide which macro definitions are in scope:
(gdb) list main
3
4 #define M 42
5 #define ADD(x) (M + x)
6
7 main ()
8 {
9 #define N 28
10 printf ("Hello, world!n");
11 #undef N
12 printf ("We're so creative.n");
(gdb) info macro ADD
Defined at /home/jimb/gdb/macros/play/sample.c:5
#define ADD(x) (M + x)
(gdb) info macro Q
Defined at /home/jimb/gdb/macros/play/sample.h:1
included at /home/jimb/gdb/macros/play/sample.c:2
#define Q <
(gdb) macro expand ADD(1)
expands to: (42 + 1)
(gdb) macro expand-once ADD(1)
expands to: once (M + 1)
(gdb)
In the example above, note that macro expand-once expands only
the macro invocation explicit in the original text — the invocation of
ADD — but does not expand the invocation of the macro M,
which was introduced by ADD.
Once the program is running, GDB uses the macro definitions in
force at the source line of the current stack frame:
(gdb) break main
Breakpoint 1 at 0x8048370: file sample.c, line 10.
(gdb) run
Starting program: /home/jimb/gdb/macros/play/sample
Breakpoint 1, main () at sample.c:10
10 printf ("Hello, world!n");
(gdb)
At line 10, the definition of the macro N at line 9 is in force:
(gdb) info macro N Defined at /home/jimb/gdb/macros/play/sample.c:9 #define N 28 (gdb) macro expand N Q M expands to: 28 < 42 (gdb) print N Q M $1 = 1 (gdb)
As we step over directives that remove N’s definition, and then
give it a new definition, GDB finds the definition (or lack
thereof) in force at each point:
(gdb) next
Hello, world!
12 printf ("We're so creative.n");
(gdb) info macro N
The symbol `N' has no definition as a C/C++ preprocessor macro
at /home/jimb/gdb/macros/play/sample.c:12
(gdb) next
We're so creative.
14 printf ("Goodbye, world!n");
(gdb) info macro N
Defined at /home/jimb/gdb/macros/play/sample.c:13
#define N 1729
(gdb) macro expand N Q M
expands to: 1729 < 42
(gdb) print N Q M
$2 = 0
(gdb)
In addition to source files, macros can be defined on the compilation command
line using the -Dname=value syntax. For macros defined in
such a way, GDB displays the location of their definition as line zero
of the source file submitted to the compiler.
(gdb) info macro __STDC__ Defined at /home/jimb/gdb/macros/play/sample.c:0 -D__STDC__=1 (gdb)
13 Tracepoints
In some applications, it is not feasible for the debugger to interrupt
the program’s execution long enough for the developer to learn
anything helpful about its behavior. If the program’s correctness
depends on its real-time behavior, delays introduced by a debugger
might cause the program to change its behavior drastically, or perhaps
fail, even when the code itself is correct. It is useful to be able
to observe the program’s behavior without interrupting it.
Using GDB’s trace and collect commands, you can
specify locations in the program, called tracepoints, and
arbitrary expressions to evaluate when those tracepoints are reached.
Later, using the tfind command, you can examine the values
those expressions had when the program hit the tracepoints. The
expressions may also denote objects in memory—structures or arrays,
for example—whose values GDB should record; while visiting
a particular tracepoint, you may inspect those objects as if they were
in memory at that moment. However, because GDB records these
values without interacting with you, it can do so quickly and
unobtrusively, hopefully not disturbing the program’s behavior.
The tracepoint facility is currently available only for remote
targets. See Targets. In addition, your remote target must know
how to collect trace data. This functionality is implemented in the
remote stub; however, none of the stubs distributed with GDB
support tracepoints as of this writing. The format of the remote
packets used to implement tracepoints are described in Tracepoint Packets.
It is also possible to get trace data from a file, in a manner reminiscent
of corefiles; you specify the filename, and use tfind to search
through the file. See Trace Files, for more details.
This chapter describes the tracepoint commands and features.
13.1 Commands to Set Tracepoints
Before running such a trace experiment, an arbitrary number of
tracepoints can be set. A tracepoint is actually a special type of
breakpoint (see Set Breaks), so you can manipulate it using
standard breakpoint commands. For instance, as with breakpoints,
tracepoint numbers are successive integers starting from one, and many
of the commands associated with tracepoints take the tracepoint number
as their argument, to identify which tracepoint to work on.
For each tracepoint, you can specify, in advance, some arbitrary set
of data that you want the target to collect in the trace buffer when
it hits that tracepoint. The collected data can include registers,
local variables, or global data. Later, you can use GDB
commands to examine the values these data had at the time the
tracepoint was hit.
Tracepoints do not support every breakpoint feature. Ignore counts on
tracepoints have no effect, and tracepoints cannot run GDB
commands when they are hit. Tracepoints may not be thread-specific
either.
Some targets may support fast tracepoints, which are inserted in
a different way (such as with a jump instead of a trap), that is
faster but possibly restricted in where they may be installed.
Regular and fast tracepoints are dynamic tracing facilities, meaning
that they can be used to insert tracepoints at (almost) any location
in the target. Some targets may also support controlling static
tracepoints from GDB. With static tracing, a set of
instrumentation points, also known as markers, are embedded in
the target program, and can be activated or deactivated by name or
address. These are usually placed at locations which facilitate
investigating what the target is actually doing. GDB’s
support for static tracing includes being able to list instrumentation
points, and attach them with GDB defined high level
tracepoints that expose the whole range of convenience of
GDB’s tracepoints support. Namely, support for collecting
registers values and values of global or local (to the instrumentation
point) variables; tracepoint conditions and trace state variables.
The act of installing a GDB static tracepoint on an
instrumentation point, or marker, is referred to as probing a
static tracepoint marker.
gdbserver supports tracepoints on some target systems.
See Tracepoints support in gdbserver.
This section describes commands to set tracepoints and associated
conditions and actions.
13.1.1 Create and Delete Tracepoints
trace locspec-
The
tracecommand is very similar to thebreakcommand.
Its argument locspec can be any valid location specification.
See Location Specifications. Thetracecommand defines a tracepoint,
which is a point in the target program where the debugger will briefly stop,
collect some data, and then allow the program to continue. Setting a tracepoint
or changing its actions takes effect immediately if the remote stub
supports the ‘InstallInTrace’ feature (see install tracepoint in tracing).
If remote stub doesn’t support the ‘InstallInTrace’ feature, all
these changes don’t take effect until the nexttstart
command, and once a trace experiment is running, further changes will
not have any effect until the next trace experiment starts. In addition,
GDB supports pending tracepoints—tracepoints whose
address is not yet resolved. (This is similar to pending breakpoints.)
Pending tracepoints are not downloaded to the target and not installed
until they are resolved. The resolution of pending tracepoints requires
GDB support—when debugging with the remote target, and
GDB disconnects from the remote stub (see disconnected tracing), pending tracepoints can not be resolved (and downloaded to
the remote stub) while GDB is disconnected.Here are some examples of using the
tracecommand:(gdb) trace foo.c:121 // a source file and line number (gdb) trace +2 // 2 lines forward (gdb) trace my_function // first source line of function (gdb) trace *my_function // EXACT start address of function (gdb) trace *0x2117c4 // an address
You can abbreviate
traceastr. trace locspec if cond-
Set a tracepoint with condition cond; evaluate the expression
cond each time the tracepoint is reached, and collect data only
if the value is nonzero—that is, if cond evaluates as true.
See Tracepoint Conditions, for more
information on tracepoint conditions. ftrace locspec [ if cond ]-
The
ftracecommand sets a fast tracepoint. For targets that
support them, fast tracepoints will use a more efficient but possibly
less general technique to trigger data collection, such as a jump
instruction instead of a trap, or some sort of hardware support. It
may not be possible to create a fast tracepoint at the desired
location, in which case the command will exit with an explanatory
message.GDB handles arguments to
ftraceexactly as for
trace.On 32-bit x86-architecture systems, fast tracepoints normally need to
be placed at an instruction that is 5 bytes or longer, but can be
placed at 4-byte instructions if the low 64K of memory of the target
program is available to install trampolines. Some Unix-type systems,
such as GNU/Linux, exclude low addresses from the program’s
address space; but for instance with the Linux kernel it is possible
to let GDB use this area by doing asysctlcommand
to set themmap_min_addrkernel parameter, as insudo sysctl -w vm.mmap_min_addr=32768
which sets the low address to 32K, which leaves plenty of room for
trampolines. The minimum address should be set to a page boundary. strace [locspec | -m marker] [ if cond ]-
The
stracecommand sets a static tracepoint. For targets that
support it, setting a static tracepoint probes a static
instrumentation point, or marker, found at the code locations that
result from resolving locspec. It may not be possible to set a
static tracepoint at the desired code location, in which case the
command will exit with an explanatory message.GDB handles arguments to
straceexactly as for
trace, with the addition that the user can also specify
-m markerinstead of a location spec. This probes the marker
identified by the marker string identifier. This identifier
depends on the static tracepoint backend library your program is
using. You can find all the marker identifiers in the ‘ID’ field
of theinfo static-tracepoint-markerscommand output.
See Listing Static Tracepoint
Markers. For example, in the following small program using the UST
tracing engine:main () { trace_mark(ust, bar33, "str %s", "FOOBAZ"); }the marker id is composed of joining the first two arguments to the
trace_markcall with a slash, which translates to:(gdb) info static-tracepoint-markers Cnt Enb ID Address What 1 n ust/bar33 0x0000000000400ddc in main at stexample.c:22 Data: "str %s" [etc...]so you may probe the marker above with:
(gdb) strace -m ust/bar33
Static tracepoints accept an extra collect action —
collect. This collects arbitrary user data passed in the probe point
$_sdata
call to the tracing library. In the UST example above, you’ll see
that the third argument totrace_markis a printf-like format
string. The user data is then the result of running that formatting
string against the following arguments. Note thatinfocommand output lists that format string in
static-tracepoint-markers
the ‘Data:’ field.You can inspect this data when analyzing the trace buffer, by printing
the $_sdata variable like any other variable available to
GDB. See Tracepoint Action Lists.The convenience variable
$tpnumrecords the tracepoint number
of the most recently set tracepoint. delete tracepoint [num]-
Permanently delete one or more tracepoints. With no argument, the
default is to delete all tracepoints. Note that the regular
deletecommand can remove tracepoints also.Examples:
(gdb) delete trace 1 2 3 // remove three tracepoints (gdb) delete trace // remove all tracepoints
You can abbreviate this command as
del tr.
13.1.2 Enable and Disable Tracepoints
These commands are deprecated; they are equivalent to plain disable and enable.
disable tracepoint [num]-
Disable tracepoint num, or all tracepoints if no argument
num is given. A disabled tracepoint will have no effect during
a trace experiment, but it is not forgotten. You can re-enable
a disabled tracepoint using theenable tracepointcommand.
If the command is issued during a trace experiment and the debug target
has support for disabling tracepoints during a trace experiment, then the
change will be effective immediately. Otherwise, it will be applied to the
next trace experiment. enable tracepoint [num]-
Enable tracepoint num, or all tracepoints. If this command is
issued during a trace experiment and the debug target supports enabling
tracepoints during a trace experiment, then the enabled tracepoints will
become effective immediately. Otherwise, they will become effective the
next time a trace experiment is run.
13.1.3 Tracepoint Passcounts
passcount [n [num]]-
Set the passcount of a tracepoint. The passcount is a way to
automatically stop a trace experiment. If a tracepoint’s passcount is
n, then the trace experiment will be automatically stopped on
the n’th time that tracepoint is hit. If the tracepoint number
num is not specified, thepasscountcommand sets the
passcount of the most recently defined tracepoint. If no passcount is
given, the trace experiment will run until stopped explicitly by the
user.Examples:
(gdb) passcount 5 2 // Stop on the 5th execution of
// tracepoint 2(gdb) passcount 12 // Stop on the 12th execution of the
// most recently defined tracepoint.(gdb) trace foo (gdb) pass 3 (gdb) trace bar (gdb) pass 2 (gdb) trace baz (gdb) pass 1 // Stop tracing when foo has been
// executed 3 times OR when bar has// been executed 2 times// OR when baz has been executed 1 time.
13.1.4 Tracepoint Conditions
The simplest sort of tracepoint collects data every time your program
reaches a specified place. You can also specify a condition for
a tracepoint. A condition is just a Boolean expression in your
programming language (see Expressions). A
tracepoint with a condition evaluates the expression each time your
program reaches it, and data collection happens only if the condition
is true.
Tracepoint conditions can be specified when a tracepoint is set, by
using ‘if’ in the arguments to the trace command.
See Setting Tracepoints. They can
also be set or changed at any time with the condition command,
just as with breakpoints.
Unlike breakpoint conditions, GDB does not actually evaluate
the conditional expression itself. Instead, GDB encodes the
expression into an agent expression (see Agent Expressions)
suitable for execution on the target, independently of GDB.
Global variables become raw memory locations, locals become stack
accesses, and so forth.
For instance, suppose you have a function that is usually called
frequently, but should not be called after an error has occurred. You
could use the following tracepoint command to collect data about calls
of that function that happen while the error code is propagating
through the program; an unconditional tracepoint could end up
collecting thousands of useless trace frames that you would have to
search through.
(gdb) trace normal_operation if errcode > 0
13.1.5 Trace State Variables
A trace state variable is a special type of variable that is
created and managed by target-side code. The syntax is the same as
that for GDB’s convenience variables (a string prefixed with “$”),
but they are stored on the target. They must be created explicitly,
using a tvariable command. They are always 64-bit signed
integers.
Trace state variables are remembered by GDB, and downloaded
to the target along with tracepoint information when the trace
experiment starts. There are no intrinsic limits on the number of
trace state variables, beyond memory limitations of the target.
Although trace state variables are managed by the target, you can use
them in print commands and expressions as if they were convenience
variables; GDB will get the current value from the target
while the trace experiment is running. Trace state variables share
the same namespace as other “$” variables, which means that you
cannot have trace state variables with names like $23 or
$pc, nor can you have a trace state variable and a convenience
variable with the same name.
tvariable $name [ = expression ]-
The
tvariablecommand creates a new trace state variable named
$name, and optionally gives it an initial value of
expression. The expression is evaluated when this command is
entered; the result will be converted to an integer if possible,
otherwise GDB will report an error. A subsequent
tvariablecommand specifying the same name does not create a
variable, but instead assigns the supplied initial value to the
existing variable of that name, overwriting any previous initial
value. The default initial value is 0. info tvariables-
List all the trace state variables along with their initial values.
Their current values may also be displayed, if the trace experiment is
currently running. delete tvariable [ $name … ]-
Delete the given trace state variables, or all of them if no arguments
are specified.
13.1.6 Tracepoint Action Lists
actions [num]-
This command will prompt for a list of actions to be taken when the
tracepoint is hit. If the tracepoint number num is not
specified, this command sets the actions for the one that was most
recently defined (so that you can define a tracepoint and then say
actionswithout bothering about its number). You specify the
actions themselves on the following lines, one action at a time, and
terminate the actions list with a line containing justend. So
far, the only defined actions arecollect,teval, and
while-stepping.actionsis actually equivalent tocommands(see Breakpoint Command Lists), except that only the defined
actions are allowed; any other GDB command is rejected.To remove all actions from a tracepoint, type ‘actions num’
and follow it immediately with ‘end’.(gdb) collect data // collect some data (gdb) while-stepping 5 // single-step 5 times, collect data (gdb) end // signals the end of actions.
In the following example, the action list begins with
collect
commands indicating the things to be collected when the tracepoint is
hit. Then, in order to single-step and collect additional data
following the tracepoint, awhile-steppingcommand is used,
followed by the list of things to be collected after each step in a
sequence of single steps. Thewhile-steppingcommand is
terminated by its own separateendcommand. Lastly, the action
list is terminated by anendcommand.(gdb) trace foo (gdb) actions Enter actions for tracepoint 1, one per line: > collect bar,baz > collect $regs > while-stepping 12 > collect $pc, arr[i] > end end
collect[/mods] expr1, expr2, …-
Collect values of the given expressions when the tracepoint is hit.
This command accepts a comma-separated list of any valid expressions.
In addition to global, static, or local variables, the following
special arguments are supported:$regs-
Collect all registers.
$args-
Collect all function arguments.
$locals-
Collect all local variables.
$_ret-
Collect the return address. This is helpful if you want to see more
of a backtrace.Note: The return address location can not always be reliably
determined up front, and the wrong address / registers may end up
collected instead. On some architectures the reliability is higher
for tracepoints at function entry, while on others it’s the opposite.
When this happens, backtracing will stop because the return address is
found unavailable (unless another collect rule happened to match it). $_probe_argc-
Collects the number of arguments from the static probe at which the
tracepoint is located.
See Static Probe Points. $_probe_argn-
n is an integer between 0 and 11. Collects the nth argument
from the static probe at which the tracepoint is located.
See Static Probe Points. $_sdata-
Collect static tracepoint marker specific data. Only available for
static tracepoints. See Tracepoint Action
Lists. On the UST static tracepoints library backend, an
instrumentation point resembles aprintffunction call. The
tracing library is able to collect user specified data formatted to a
character string using the format provided by the programmer that
instrumented the program. Other backends have similar mechanisms.
Here’s an example of a UST marker call:const char master_name[] = "$your_name"; trace_mark(channel1, marker1, "hello %s", master_name)
In this case, collecting
$_sdatacollects the string
‘hello $yourname’. When analyzing the trace buffer, you can
inspect ‘$_sdata’ like any other variable available to
GDB.
You can give several consecutive
collectcommands, each one
with a single argument, or onecollectcommand with several
arguments separated by commas; the effect is the same.The optional mods changes the usual handling of the arguments.
srequests that pointers to chars be handled as strings, in
particular collecting the contents of the memory being pointed at, up
to the first zero. The upper bound is by default the value of the
print elementsvariable; ifsis followed by a decimal
number, that is the upper bound instead. So for instance
‘collect/s25 mystr’ collects as many as 25 characters at
‘mystr’.The command
info scope(see info scope) is
particularly useful for figuring out what data to collect. teval expr1, expr2, …-
Evaluate the given expressions when the tracepoint is hit. This
command accepts a comma-separated list of expressions. The results
are discarded, so this is mainly useful for assigning values to trace
state variables (see Trace State Variables) without adding those
values to the trace buffer, as would be the case if thecollect
action were used. while-stepping n-
Perform n single-step instruction traces after the tracepoint,
collecting new data after each step. Thewhile-stepping
command is followed by the list of what to collect while stepping
(followed by its ownendcommand):> while-stepping 12 > collect $regs, myglobal > end >
Note that
$pcis not automatically collected by
while-stepping; you need to explicitly collect that register if
you need it. You may abbreviatewhile-steppingaswsor
stepping. set default-collect expr1, expr2, …-
This variable is a list of expressions to collect at each tracepoint
hit. It is effectively an additionalcollectaction prepended
to every tracepoint action list. The expressions are parsed
individually for each tracepoint, so for instance a variable named
xyzmay be interpreted as a global for one tracepoint, and a
local for another, as appropriate to the tracepoint’s location. show default-collect-
Show the list of expressions that are collected by default at each
tracepoint hit.
13.1.7 Listing Tracepoints
info tracepoints [num…]-
Display information about the tracepoint num. If you don’t
specify a tracepoint number, displays information about all the
tracepoints defined so far. The format is similar to that used for
info breakpoints; in fact,info tracepointsis the same
command, simply restricting itself to tracepoints.A tracepoint’s listing may include additional information specific to
tracing:- its passcount as given by the
passcount ncommand - the state about installed on target of each location
(gdb) info trace Num Type Disp Enb Address What 1 tracepoint keep y 0x0804ab57 in foo() at main.cxx:7 while-stepping 20 collect globfoo, $regs end collect globfoo2 end pass count 1200 2 tracepoint keep y <MULTIPLE> collect $eip 2.1 y 0x0804859c in func4 at change-loc.h:35 installed on target 2.2 y 0xb7ffc480 in func4 at change-loc.h:35 installed on target 2.3 y <PENDING> set_tracepoint 3 tracepoint keep y 0x080485b1 in foo at change-loc.c:29 not installed on target (gdb)This command can be abbreviated
info tp. - its passcount as given by the
13.1.8 Listing Static Tracepoint Markers
info static-tracepoint-markers-
Display information about all static tracepoint markers defined in the
program.For each marker, the following columns are printed:
- Count
-
An incrementing counter, output to help readability. This is not a
stable identifier. - ID
-
The marker ID, as reported by the target.
- Enabled or Disabled
-
Probed markers are tagged with ‘y’. ‘n’ identifies marks
that are not enabled. - Address
-
Where the marker is in your program, as a memory address.
- What
-
Where the marker is in the source for your program, as a file and line
number. If the debug information included in the program does not
allow GDB to locate the source of the marker, this column
will be left blank.
In addition, the following information may be printed for each marker:
- Data
-
User data passed to the tracing library by the marker call. In the
UST backend, this is the format string passed as argument to the
marker call. - Static tracepoints probing the marker
-
The list of static tracepoints attached to the marker.
(gdb) info static-tracepoint-markers Cnt ID Enb Address What 1 ust/bar2 y 0x0000000000400e1a in main at stexample.c:25 Data: number1 %d number2 %d Probed by static tracepoints: #2 2 ust/bar33 n 0x0000000000400c87 in main at stexample.c:24 Data: str %s (gdb)
13.1.9 Starting and Stopping Trace Experiments
tstart-
This command starts the trace experiment, and begins collecting data.
It has the side effect of discarding all the data collected in the
trace buffer during the previous trace experiment. If any arguments
are supplied, they are taken as a note and stored with the trace
experiment’s state. The notes may be arbitrary text, and are
especially useful with disconnected tracing in a multi-user context;
the notes can explain what the trace is doing, supply user contact
information, and so forth. tstop-
This command stops the trace experiment. If any arguments are
supplied, they are recorded with the experiment as a note. This is
useful if you are stopping a trace started by someone else, for
instance if the trace is interfering with the system’s behavior and
needs to be stopped quickly.Note: a trace experiment and data collection may stop
automatically if any tracepoint’s passcount is reached
(see Tracepoint Passcounts), or if the trace buffer becomes full. tstatus-
This command displays the status of the current trace data
collection.
Here is an example of the commands we described so far:
(gdb) trace gdb_c_test (gdb) actions Enter actions for tracepoint #1, one per line. > collect $regs,$locals,$args > while-stepping 11 > collect $regs > end > end (gdb) tstart [time passes …] (gdb) tstop
You can choose to continue running the trace experiment even if
GDB disconnects from the target, voluntarily or
involuntarily. For commands such as detach, the debugger will
ask what you want to do with the trace. But for unexpected
terminations (GDB crash, network outage), it would be
unfortunate to lose hard-won trace data, so the variable
disconnected-tracing lets you decide whether the trace should
continue running without GDB.
set disconnected-tracing onset disconnected-tracing off-
Choose whether a tracing run should continue to run if GDB
has disconnected from the target. Note thatdetachor
quitwill ask you directly what to do about a running trace no
matter what this variable’s setting, so the variable is mainly useful
for handling unexpected situations, such as loss of the network. show disconnected-tracing-
Show the current choice for disconnected tracing.
When you reconnect to the target, the trace experiment may or may not
still be running; it might have filled the trace buffer in the
meantime, or stopped for one of the other reasons. If it is running,
it will continue after reconnection.
Upon reconnection, the target will upload information about the
tracepoints in effect. GDB will then compare that
information to the set of tracepoints currently defined, and attempt
to match them up, allowing for the possibility that the numbers may
have changed due to creation and deletion in the meantime. If one of
the target’s tracepoints does not match any in GDB, the
debugger will create a new tracepoint, so that you have a number with
which to specify that tracepoint. This matching-up process is
necessarily heuristic, and it may result in useless tracepoints being
created; you may simply delete them if they are of no use.
If your target agent supports a circular trace buffer, then you
can run a trace experiment indefinitely without filling the trace
buffer; when space runs out, the agent deletes already-collected trace
frames, oldest first, until there is enough room to continue
collecting. This is especially useful if your tracepoints are being
hit too often, and your trace gets terminated prematurely because the
buffer is full. To ask for a circular trace buffer, simply set
‘circular-trace-buffer’ to on. You can set this at any time,
including during tracing; if the agent can do it, it will change
buffer handling on the fly, otherwise it will not take effect until
the next run.
set circular-trace-buffer onset circular-trace-buffer off-
Choose whether a tracing run should use a linear or circular buffer
for trace data. A linear buffer will not lose any trace data, but may
fill up prematurely, while a circular buffer will discard old trace
data, but it will have always room for the latest tracepoint hits. show circular-trace-buffer-
Show the current choice for the trace buffer. Note that this may not
match the agent’s current buffer handling, nor is it guaranteed to
match the setting that might have been in effect during a past run,
for instance if you are looking at frames from a trace file.
set trace-buffer-size nset trace-buffer-size unlimited-
Request that the target use a trace buffer of n bytes. Not all
targets will honor the request; they may have a compiled-in size for
the trace buffer, or some other limitation. Set to a value of
unlimitedor-1to let the target use whatever size it
likes. This is also the default. show trace-buffer-size-
Show the current requested size for the trace buffer. Note that this
will only match the actual size if the target supports size-setting,
and was able to handle the requested size. For instance, if the
target can only change buffer size between runs, this variable will
not reflect the change until the next run starts. Usetstatus
to get a report of the actual buffer size.
set trace-user textshow trace-userset trace-notes text-
Set the trace run’s notes.
show trace-notes-
Show the trace run’s notes.
set trace-stop-notes text-
Set the trace run’s stop notes. The handling of the note is as for
tstoparguments; the set command is convenient way to fix a
stop note that is mistaken or incomplete. show trace-stop-notes-
Show the trace run’s stop notes.
13.1.10 Tracepoint Restrictions
There are a number of restrictions on the use of tracepoints. As
described above, tracepoint data gathering occurs on the target
without interaction from GDB. Thus the full capabilities of
the debugger are not available during data gathering, and then at data
examination time, you will be limited by only having what was
collected. The following items describe some common problems, but it
is not exhaustive, and you may run into additional difficulties not
mentioned here.
- Tracepoint expressions are intended to gather objects (lvalues). Thus
the full flexibility of GDB’s expression evaluator is not available.
You cannot call functions, cast objects to aggregate types, access
convenience variables or modify values (except by assignment to trace
state variables). Some language features may implicitly call
functions (for instance Objective-C fields with accessors), and therefore
cannot be collected either. - Collection of local variables, either individually or in bulk with
$localsor$args, duringwhile-steppingmay
behave erratically. The stepping action may enter a new scope (for
instance by stepping into a function), or the location of the variable
may change (for instance it is loaded into a register). The
tracepoint data recorded uses the location information for the
variables that is correct for the tracepoint location. When the
tracepoint is created, it is not possible, in general, to determine
where the steps of awhile-steppingsequence will advance the
program—particularly if a conditional branch is stepped. - Collection of an incompletely-initialized or partially-destroyed object
may result in something that GDB cannot display, or displays
in a misleading way. - When GDB displays a pointer to character it automatically
dereferences the pointer to also display characters of the string
being pointed to. However, collecting the pointer during tracing does
not automatically collect the string. You need to explicitly
dereference the pointer and provide size information if you want to
collect not only the pointer, but the memory pointed to. For example,
*ptr@50can be used to collect the 50 element array pointed to
byptr. - It is not possible to collect a complete stack backtrace at a
tracepoint. Instead, you may collect the registers and a few hundred
bytes from the stack pointer with something like*(unsigned char *)$esp@300
(adjust to use the name of the actual stack pointer register on your
target architecture, and the amount of stack you wish to capture).
Then thebacktracecommand will show a partial backtrace when
using a trace frame. The number of stack frames that can be examined
depends on the sizes of the frames in the collected stack. Note that
if you ask for a block so large that it goes past the bottom of the
stack, the target agent may report an error trying to read from an
invalid address. - If you do not collect registers at a tracepoint, GDB can
infer that the value of$pcmust be the same as the address of
the tracepoint and use that when you are looking at a trace frame
for that tracepoint. However, this cannot work if the tracepoint has
multiple locations (for instance if it was set in a function that was
inlined), or if it has awhile-steppingloop. In those cases
GDB will warn you that it can’t infer$pc, and default
it to zero.
13.2 Using the Collected Data
After the tracepoint experiment ends, you use GDB commands
for examining the trace data. The basic idea is that each tracepoint
collects a trace snapshot every time it is hit and another
snapshot every time it single-steps. All these snapshots are
consecutively numbered from zero and go into a buffer, and you can
examine them later. The way you examine them is to focus on a
specific trace snapshot. When the remote stub is focused on a trace
snapshot, it will respond to all GDB requests for memory and
registers by reading from the buffer which belongs to that snapshot,
rather than from real memory or registers of the program being
debugged. This means that all GDB commands
(print, info registers, backtrace, etc.) will
behave as if we were currently debugging the program state as it was
when the tracepoint occurred. Any requests for data that are not in
the buffer will fail.
13.2.1 tfind n
The basic command for selecting a trace snapshot from the buffer is
tfind n, which finds trace snapshot number n,
counting from zero. If no argument n is given, the next
snapshot is selected.
Here are the various forms of using the tfind command.
tfind start-
Find the first snapshot in the buffer. This is a synonym for
tfind 0(since 0 is the number of the first snapshot). tfind none-
Stop debugging trace snapshots, resume live debugging.
tfind end-
Same as ‘tfind none’.
tfind-
No argument means find the next trace snapshot or find the first
one if no trace snapshot is selected. tfind --
Find the previous trace snapshot before the current one. This permits
retracing earlier steps. tfind tracepoint num-
Find the next snapshot associated with tracepoint num. Search
proceeds forward from the last examined trace snapshot. If no
argument num is given, it means find the next snapshot collected
for the same tracepoint as the current snapshot. tfind pc addr-
Find the next snapshot associated with the value addr of the
program counter. Search proceeds forward from the last examined trace
snapshot. If no argument addr is given, it means find the next
snapshot with the same value of PC as the current snapshot. tfind outside addr1, addr2-
Find the next snapshot whose PC is outside the given range of
addresses (exclusive). tfind range addr1, addr2-
Find the next snapshot whose PC is between addr1 and
addr2 (inclusive). tfind line [file:]n-
Find the next snapshot associated with the source line n. If
the optional argument file is given, refer to line n in
that source file. Search proceeds forward from the last examined
trace snapshot. If no argument n is given, it means find the
next line other than the one currently being examined; thus saying
tfind linerepeatedly can appear to have the same effect as
stepping from line to line in a live debugging session.
The default arguments for the tfind commands are specifically
designed to make it easy to scan through the trace buffer. For
instance, tfind with no argument selects the next trace
snapshot, and tfind - with no argument selects the previous
trace snapshot. So, by giving one tfind command, and then
simply hitting RET repeatedly you can examine all the trace
snapshots in order. Or, by saying tfind - and then hitting
RET repeatedly you can examine the snapshots in reverse order.
The tfind line command with no argument selects the snapshot
for the next source line executed. The tfind pc command with
no argument selects the next snapshot with the same program counter
(PC) as the current frame. The tfind tracepoint command with
no argument selects the next trace snapshot collected by the same
tracepoint as the current one.
In addition to letting you scan through the trace buffer manually,
these commands make it easy to construct GDB scripts that
scan through the trace buffer and print out whatever collected data
you are interested in. Thus, if we want to examine the PC, FP, and SP
registers from each trace frame in the buffer, we can say this:
(gdb) tfind start
(gdb) while ($trace_frame != -1)
> printf "Frame %d, PC = %08X, SP = %08X, FP = %08Xn",
$trace_frame, $pc, $sp, $fp
> tfind
> end
Frame 0, PC = 0020DC64, SP = 0030BF3C, FP = 0030BF44
Frame 1, PC = 0020DC6C, SP = 0030BF38, FP = 0030BF44
Frame 2, PC = 0020DC70, SP = 0030BF34, FP = 0030BF44
Frame 3, PC = 0020DC74, SP = 0030BF30, FP = 0030BF44
Frame 4, PC = 0020DC78, SP = 0030BF2C, FP = 0030BF44
Frame 5, PC = 0020DC7C, SP = 0030BF28, FP = 0030BF44
Frame 6, PC = 0020DC80, SP = 0030BF24, FP = 0030BF44
Frame 7, PC = 0020DC84, SP = 0030BF20, FP = 0030BF44
Frame 8, PC = 0020DC88, SP = 0030BF1C, FP = 0030BF44
Frame 9, PC = 0020DC8E, SP = 0030BF18, FP = 0030BF44
Frame 10, PC = 00203F6C, SP = 0030BE3C, FP = 0030BF14
Or, if we want to examine the variable X at each source line in
the buffer:
(gdb) tfind start (gdb) while ($trace_frame != -1) > printf "Frame %d, X == %dn", $trace_frame, X > tfind line > end Frame 0, X = 1 Frame 7, X = 2 Frame 13, X = 255
13.2.2 tdump
This command takes no arguments. It prints all the data collected at
the current trace snapshot.
(gdb) trace 444 (gdb) actions Enter actions for tracepoint #2, one per line: > collect $regs, $locals, $args, gdb_long_test > end (gdb) tstart (gdb) tfind line 444 #0 gdb_test (p1=0x11, p2=0x22, p3=0x33, p4=0x44, p5=0x55, p6=0x66) at gdb_test.c:444 444 printp( "%s: arguments = 0x%X 0x%X 0x%X 0x%X 0x%X 0x%Xn", ) (gdb) tdump Data collected at tracepoint 2, trace frame 1: d0 0xc4aa0085 -995491707 d1 0x18 24 d2 0x80 128 d3 0x33 51 d4 0x71aea3d 119204413 d5 0x22 34 d6 0xe0 224 d7 0x380035 3670069 a0 0x19e24a 1696330 a1 0x3000668 50333288 a2 0x100 256 a3 0x322000 3284992 a4 0x3000698 50333336 a5 0x1ad3cc 1758156 fp 0x30bf3c 0x30bf3c sp 0x30bf34 0x30bf34 ps 0x0 0 pc 0x20b2c8 0x20b2c8 fpcontrol 0x0 0 fpstatus 0x0 0 fpiaddr 0x0 0 p = 0x20e5b4 "gdb-test" p1 = (void *) 0x11 p2 = (void *) 0x22 p3 = (void *) 0x33 p4 = (void *) 0x44 p5 = (void *) 0x55 p6 = (void *) 0x66 gdb_long_test = 17 '21' (gdb)
tdump works by scanning the tracepoint’s current collection
actions and printing the value of each expression listed. So
tdump can fail, if after a run, you change the tracepoint’s
actions to mention variables that were not collected during the run.
Also, for tracepoints with while-stepping loops, tdump
uses the collected value of $pc to distinguish between trace
frames that were collected at the tracepoint hit, and frames that were
collected while stepping. This allows it to correctly choose whether
to display the basic list of collections, or the collections from the
body of the while-stepping loop. However, if $pc was not collected,
then tdump will always attempt to dump using the basic collection
list, and may fail if a while-stepping frame does not include all the
same data that is collected at the tracepoint hit.
13.2.3 save tracepoints filename
This command saves all current tracepoint definitions together with
their actions and passcounts, into a file filename
suitable for use in a later debugging session. To read the saved
tracepoint definitions, use the source command (see Command Files). The save-tracepoints command is a deprecated
alias for save tracepoints
13.3 Convenience Variables for Tracepoints
(int) $trace_frame-
The current trace snapshot (a.k.a. frame) number, or -1 if no
snapshot is selected. (int) $tracepoint-
The tracepoint for the current trace snapshot.
(int) $trace_line-
The line number for the current trace snapshot.
(char []) $trace_file-
The source file for the current trace snapshot.
(char []) $trace_func-
The name of the function containing
$tracepoint.
Note: $trace_file is not suitable for use in printf,
use output instead.
Here’s a simple example of using these convenience variables for
stepping through all the trace snapshots and printing some of their
data. Note that these are not the same as trace state variables,
which are managed by the target.
(gdb) tfind start (gdb) while $trace_frame != -1 > output $trace_file > printf ", line %d (tracepoint #%d)n", $trace_line, $tracepoint > tfind > end
13.4 Using Trace Files
In some situations, the target running a trace experiment may no
longer be available; perhaps it crashed, or the hardware was needed
for a different activity. To handle these cases, you can arrange to
dump the trace data into a file, and later use that file as a source
of trace data, via the target tfile command.
tsave [ -r ] filenametsave [-ctf] dirname-
Save the trace data to filename. By default, this command
assumes that filename refers to the host filesystem, so if
necessary GDB will copy raw trace data up from the target and
then save it. If the target supports it, you can also supply the
optional argument-r(“remote”) to direct the target to save
the data directly into filename in its own filesystem, which may be
more efficient if the trace buffer is very large. (Note, however, that
target tfilecan only read from files accessible to the host.)
By default, this command will save trace frame in tfile format.
You can supply the optional argument-ctfto save data in CTF
format. The Common Trace Format (CTF) is proposed as a trace format
that can be shared by multiple debugging and tracing tools. Please go to
‘http://www.efficios.com/ctf’ to get more information. target tfile filenametarget ctf dirname-
Use the file named filename or directory named dirname as
a source of trace data. Commands that examine data work as they do with
a live target, but it is not possible to run any new trace experiments.
tstatuswill report the state of the trace run at the moment
the data was saved, as well as the current trace frame you are examining.
Both filename and dirname must be on a filesystem accessible to
the host.(gdb) target ctf ctf.ctf (gdb) tfind Found trace frame 0, tracepoint 2 39 ++a; /* set tracepoint 1 here */ (gdb) tdump Data collected at tracepoint 2, trace frame 0: i = 0 a = 0 b = 1 '01' c = {"123", "456", "789", "123", "456", "789"} d = {{{a = 1, b = 2}, {a = 3, b = 4}}, {{a = 5, b = 6}, {a = 7, b = 8}}} (gdb) p b $1 = 1
14 Debugging Programs That Use Overlays
If your program is too large to fit completely in your target system’s
memory, you can sometimes use overlays to work around this
problem. GDB provides some support for debugging programs that
use overlays.
14.1 How Overlays Work
Suppose you have a computer whose instruction address space is only 64
kilobytes long, but which has much more memory which can be accessed by
other means: special instructions, segment registers, or memory
management hardware, for example. Suppose further that you want to
adapt a program which is larger than 64 kilobytes to run on this system.
One solution is to identify modules of your program which are relatively
independent, and need not call each other directly; call these modules
overlays. Separate the overlays from the main program, and place
their machine code in the larger memory. Place your main program in
instruction memory, but leave at least enough space there to hold the
largest overlay as well.
Now, to call a function located in an overlay, you must first copy that
overlay’s machine code from the large memory into the space set aside
for it in the instruction memory, and then jump to its entry point
there.
Data Instruction Larger
Address Space Address Space Address Space
+-----------+ +-----------+ +-----------+
| | | | | |
+-----------+ +-----------+ +-----------+<-- overlay 1
| program | | main | .----| overlay 1 | load address
| variables | | program | | +-----------+
| and heap | | | | | |
+-----------+ | | | +-----------+<-- overlay 2
| | +-----------+ | | | load address
+-----------+ | | | .-| overlay 2 |
| | | | | |
mapped --->+-----------+ | | +-----------+
address | | | | | |
| overlay | <-' | | |
| area | <---' +-----------+<-- overlay 3
| | <---. | | load address
+-----------+ `--| overlay 3 |
| | | |
+-----------+ | |
+-----------+
| |
+-----------+
A code overlay
The diagram (see A code overlay) shows a system with separate data
and instruction address spaces. To map an overlay, the program copies
its code from the larger address space to the instruction address space.
Since the overlays shown here all use the same mapped address, only one
may be mapped at a time. For a system with a single address space for
data and instructions, the diagram would be similar, except that the
program variables and heap would share an address space with the main
program and the overlay area.
An overlay loaded into instruction memory and ready for use is called a
mapped overlay; its mapped address is its address in the
instruction memory. An overlay not present (or only partially present)
in instruction memory is called unmapped; its load address
is its address in the larger memory. The mapped address is also called
the virtual memory address, or VMA; the load address is also
called the load memory address, or LMA.
Unfortunately, overlays are not a completely transparent way to adapt a
program to limited instruction memory. They introduce a new set of
global constraints you must keep in mind as you design your program:
- Before calling or returning to a function in an overlay, your program
must make sure that overlay is actually mapped. Otherwise, the call or
return will transfer control to the right address, but in the wrong
overlay, and your program will probably crash. - If the process of mapping an overlay is expensive on your system, you
will need to choose your overlays carefully to minimize their effect on
your program’s performance. - The executable file you load onto your system must contain each
overlay’s instructions, appearing at the overlay’s load address, not its
mapped address. However, each overlay’s instructions must be relocated
and its symbols defined as if the overlay were at its mapped address.
You can use GNU linker scripts to specify different load and relocation
addresses for pieces of your program; see Overlay Description in Using ld: the GNU linker. - The procedure for loading executable files onto your system must be able
to load their contents into the larger address space as well as the
instruction and data spaces.
The overlay system described above is rather simple, and could be
improved in many ways:
- If your system has suitable bank switch registers or memory management
hardware, you could use those facilities to make an overlay’s load area
contents simply appear at their mapped address in instruction space.
This would probably be faster than copying the overlay to its mapped
area in the usual way. - If your overlays are small enough, you could set aside more than one
overlay area, and have more than one overlay mapped at a time. - You can use overlays to manage data, as well as instructions. In
general, data overlays are even less transparent to your design than
code overlays: whereas code overlays only require care when you call or
return to functions, data overlays require care every time you access
the data. Also, if you change the contents of a data overlay, you
must copy its contents back out to its load address before you can copy a
different data overlay into the same mapped area.
14.2 Overlay Commands
To use GDB’s overlay support, each overlay in your program must
correspond to a separate section of the executable file. The section’s
virtual memory address and load memory address must be the overlay’s
mapped and load addresses. Identifying overlays with sections allows
GDB to determine the appropriate address of a function or
variable, depending on whether the overlay is mapped or not.
GDB’s overlay commands all start with the word overlay;
you can abbreviate this as ov or ovly. The commands are:
overlay off-
Disable GDB’s overlay support. When overlay support is
disabled, GDB assumes that all functions and variables are
always present at their mapped addresses. By default, GDB’s
overlay support is disabled. overlay manual-
Enable manual overlay debugging. In this mode, GDB
relies on you to tell it which overlays are mapped, and which are not,
using theoverlay map-overlayandoverlay unmap-overlay
commands described below. overlay map-overlay overlayoverlay map overlay-
Tell GDB that overlay is now mapped; overlay must
be the name of the object file section containing the overlay. When an
overlay is mapped, GDB assumes it can find the overlay’s
functions and variables at their mapped addresses. GDB assumes
that any other overlays whose mapped ranges overlap that of
overlay are now unmapped. overlay unmap-overlay overlayoverlay unmap overlay-
Tell GDB that overlay is no longer mapped; overlay
must be the name of the object file section containing the overlay.
When an overlay is unmapped, GDB assumes it can find the
overlay’s functions and variables at their load addresses. overlay auto-
Enable automatic overlay debugging. In this mode, GDB
consults a data structure the overlay manager maintains in the inferior
to see which overlays are mapped. For details, see Automatic Overlay Debugging. overlay load-targetoverlay load-
Re-read the overlay table from the inferior. Normally, GDB
re-reads the table GDB automatically each time the inferior
stops, so this command should only be necessary if you have changed the
overlay mapping yourself using GDB. This command is only
useful when using automatic overlay debugging. overlay list-overlaysoverlay list-
Display a list of the overlays currently mapped, along with their mapped
addresses, load addresses, and sizes.
Normally, when GDB prints a code address, it includes the name
of the function the address falls in:
(gdb) print main
$3 = {int ()} 0x11a0 <main>
When overlay debugging is enabled, GDB recognizes code in
unmapped overlays, and prints the names of unmapped functions with
asterisks around them. For example, if foo is a function in an
unmapped overlay, GDB prints it this way:
(gdb) overlay list
No sections are mapped.
(gdb) print foo
$5 = {int (int)} 0x100000 <*foo*>
When foo’s overlay is mapped, GDB prints the function’s
name normally:
(gdb) overlay list
Section .ov.foo.text, loaded at 0x100000 - 0x100034,
mapped at 0x1016 - 0x104a
(gdb) print foo
$6 = {int (int)} 0x1016 <foo>
When overlay debugging is enabled, GDB can find the correct
address for functions and variables in an overlay, whether or not the
overlay is mapped. This allows most GDB commands, like
break and disassemble, to work normally, even on unmapped
code. However, GDB’s breakpoint support has some limitations:
-
You can set breakpoints in functions in unmapped overlays, as long as
GDB can write to the overlay at its load address. - GDB can not set hardware or simulator-based breakpoints in
unmapped overlays. However, if you set a breakpoint at the end of your
overlay manager (and tell GDB which overlays are now mapped, if
you are using manual overlay management), GDB will re-set its
breakpoints properly.
14.3 Automatic Overlay Debugging
GDB can automatically track which overlays are mapped and which
are not, given some simple co-operation from the overlay manager in the
inferior. If you enable automatic overlay debugging with the
overlay auto command (see Overlay Commands), GDB
looks in the inferior’s memory for certain variables describing the
current state of the overlays.
Here are the variables your overlay manager must define to support
GDB’s automatic overlay debugging:
_ovly_table:-
This variable must be an array of the following structures:
struct { /* The overlay's mapped address. */ unsigned long vma; /* The size of the overlay, in bytes. */ unsigned long size; /* The overlay's load address. */ unsigned long lma; /* Non-zero if the overlay is currently mapped; zero otherwise. */ unsigned long mapped; } _novlys:-
This variable must be a four-byte signed integer, holding the total
number of elements in_ovly_table.
To decide whether a particular overlay is mapped or not, GDB
looks for an entry in _ovly_table whose vma and
lma members equal the VMA and LMA of the overlay’s section in the
executable file. When GDB finds a matching entry, it consults
the entry’s mapped member to determine whether the overlay is
currently mapped.
In addition, your overlay manager may define a function called
_ovly_debug_event. If this function is defined, GDB
will silently set a breakpoint there. If the overlay manager then
calls this function whenever it has changed the overlay table, this
will enable GDB to accurately keep track of which overlays
are in program memory, and update any breakpoints that may be set
in overlays. This will allow breakpoints to work even if the
overlays are kept in ROM or other non-writable memory while they
are not being executed.
14.4 Overlay Sample Program
When linking a program which uses overlays, you must place the overlays
at their load addresses, while relocating them to run at their mapped
addresses. To do this, you must write a linker script (see Overlay
Description in Using ld: the GNU linker). Unfortunately,
since linker scripts are specific to a particular host system, target
architecture, and target memory layout, this manual cannot provide
portable sample code demonstrating GDB’s overlay support.
However, the GDB source distribution does contain an overlaid
program, with linker scripts for a few systems, as part of its test
suite. The program consists of the following files from
gdb/testsuite/gdb.base:
- overlays.c
-
The main program file.
- ovlymgr.c
-
A simple overlay manager, used by overlays.c.
- foo.c
- bar.c
- baz.c
- grbx.c
-
Overlay modules, loaded and used by overlays.c.
- d10v.ld
- m32r.ld
-
Linker scripts for linking the test program on the
d10v-elf
andm32r-elftargets.
You can build the test program using the d10v-elf GCC
cross-compiler like this:
$ d10v-elf-gcc -g -c overlays.c
$ d10v-elf-gcc -g -c ovlymgr.c
$ d10v-elf-gcc -g -c foo.c
$ d10v-elf-gcc -g -c bar.c
$ d10v-elf-gcc -g -c baz.c
$ d10v-elf-gcc -g -c grbx.c
$ d10v-elf-gcc -g overlays.o ovlymgr.o foo.o bar.o
baz.o grbx.o -Wl,-Td10v.ld -o overlays
The build process is identical for any other architecture, except that
you must substitute the appropriate compiler and linker script for the
target system for d10v-elf-gcc and d10v.ld.
15 Using GDB with Different Languages
Although programming languages generally have common aspects, they are
rarely expressed in the same manner. For instance, in ANSI C,
dereferencing a pointer p is accomplished by *p, but in
Modula-2, it is accomplished by p^. Values can also be
represented (and displayed) differently. Hex numbers in C appear as
‘0x1ae’, while in Modula-2 they appear as ‘1AEH’.
Language-specific information is built into GDB for some languages,
allowing you to express operations like the above in your program’s
native language, and allowing GDB to output values in a manner
consistent with the syntax of your program’s native language. The
language you use to build expressions is called the working
language.
15.1 Switching Between Source Languages
There are two ways to control the working language—either have GDB
set it automatically, or select it manually yourself. You can use the
set language command for either purpose. On startup, GDB
defaults to setting the language automatically. The working language is
used to determine how expressions you type are interpreted, how values
are printed, etc.
In addition to the working language, every source file that
GDB knows about has its own working language. For some object
file formats, the compiler might indicate which language a particular
source file is in. However, most of the time GDB infers the
language from the name of the file. The language of a source file
controls whether C++ names are demangled—this way backtrace can
show each frame appropriately for its own language. There is no way to
set the language of a source file from within GDB, but you can
set the language associated with a filename extension. See Displaying the Language.
This is most commonly a problem when you use a program, such
as cfront or f2c, that generates C but is written in
another language. In that case, make the
program use #line directives in its C output; that way
GDB will know the correct language of the source code of the original
program, and will display that source code, not the generated C code.
15.1.1 List of Filename Extensions and Languages
If a source file name ends in one of the following extensions, then
GDB infers that its language is the one indicated.
- .ada
- .ads
- .adb
- .a
-
Ada source file.
- .c
-
C source file
- .C
- .cc
- .cp
- .cpp
- .cxx
- .c++
-
C++ source file
- .d
-
D source file
- .m
-
Objective-C source file
- .f
- .F
-
Fortran source file
- .mod
-
Modula-2 source file
- .s
- .S
-
Assembler source file. This actually behaves almost like C, but
GDB does not skip over function prologues when stepping.
In addition, you may set the language associated with a filename
extension. See Displaying the Language.
15.1.2 Setting the Working Language
If you allow GDB to set the language automatically,
expressions are interpreted the same way in your debugging session and
your program.
If you wish, you may set the language manually. To do this, issue the
command ‘set language lang’, where lang is the name of
a language, such as
c or modula-2.
For a list of the supported languages, type ‘set language’.
Setting the language manually prevents GDB from updating the working
language automatically. This can lead to confusion if you try
to debug a program when the working language is not the same as the
source language, when an expression is acceptable to both
languages—but means different things. For instance, if the current
source file were written in C, and GDB was parsing Modula-2, a
command such as:
might not have the effect you intended. In C, this means to add
b and c and place the result in a. The result
printed would be the value of a. In Modula-2, this means to compare
a to the result of b+c, yielding a BOOLEAN value.
15.1.3 Having GDB Infer the Source Language
To have GDB set the working language automatically, use
‘set language local’ or ‘set language auto’. GDB
then infers the working language. That is, when your program stops in a
frame (usually by encountering a breakpoint), GDB sets the
working language to the language recorded for the function in that
frame. If the language for a frame is unknown (that is, if the function
or block corresponding to the frame was defined in a source file that
does not have a recognized extension), the current working language is
not changed, and GDB issues a warning.
This may not seem necessary for most programs, which are written
entirely in one source language. However, program modules and libraries
written in one source language can be used by a main program written in
a different source language. Using ‘set language auto’ in this
case frees you from having to set the working language manually.
15.2 Displaying the Language
The following commands help you find out which language is the
working language, and also what language source files were written in.
show language-
Display the current working language. This is the
language you can use with commands such asprintto
build and compute expressions that may involve variables in your program. info frame-
Display the source language for this frame. This language becomes the
working language if you use an identifier from this frame.
See Information about a Frame, to identify the other
information listed here. info source-
Display the source language of this source file.
See Examining the Symbol Table, to identify the other
information listed here.
In unusual circumstances, you may have source files with extensions
not in the standard list. You can then set the extension associated
with a language explicitly:
set extension-language ext language-
Tell GDB that source files with extension ext are to be
assumed as written in the source language language. info extensions-
List all the filename extensions and the associated languages.
15.3 Type and Range Checking
Some languages are designed to guard you against making seemingly common
errors through a series of compile- and run-time checks. These include
checking the type of arguments to functions and operators and making
sure mathematical overflows are caught at run time. Checks such as
these help to ensure a program’s correctness once it has been compiled
by eliminating type mismatches and providing active checks for range
errors when your program is running.
By default GDB checks for these errors according to the
rules of the current source language. Although GDB does not check
the statements in your program, it can check expressions entered directly
into GDB for evaluation via the print command, for example.
15.3.1 An Overview of Type Checking
Some languages, such as C and C++, are strongly typed, meaning that the
arguments to operators and functions have to be of the correct type,
otherwise an error occurs. These checks prevent type mismatch
errors from ever causing any run-time problems. For example,
int klass::my_method(char *b) { return b ? 1 : 2; }
(gdb) print obj.my_method (0)
$1 = 2
but
(gdb) print obj.my_method (0x1234) Cannot resolve method klass::my_method to any overloaded instance
The second example fails because in C++ the integer constant
‘0x1234’ is not type-compatible with the pointer parameter type.
For the expressions you use in GDB commands, you can tell
GDB to not enforce strict type checking or
to treat any mismatches as errors and abandon the expression;
When type checking is disabled, GDB successfully evaluates
expressions like the second example above.
Even if type checking is off, there may be other reasons
related to type that prevent GDB from evaluating an expression.
For instance, GDB does not know how to add an int and
a struct foo. These particular type errors have nothing to do
with the language in use and usually arise from expressions which make
little sense to evaluate anyway.
GDB provides some additional commands for controlling type checking:
set check type onset check type off-
Set strict type checking on or off. If any type mismatches occur in
evaluating an expression while type checking is on, GDB prints a
message and aborts evaluation of the expression. show check type-
Show the current setting of type checking and whether GDB
is enforcing strict type checking rules.
15.3.2 An Overview of Range Checking
In some languages (such as Modula-2), it is an error to exceed the
bounds of a type; this is enforced with run-time checks. Such range
checking is meant to ensure program correctness by making sure
computations do not overflow, or indices on an array element access do
not exceed the bounds of the array.
For expressions you use in GDB commands, you can tell
GDB to treat range errors in one of three ways: ignore them,
always treat them as errors and abandon the expression, or issue
warnings but evaluate the expression anyway.
A range error can result from numerical overflow, from exceeding an
array index bound, or when you type a constant that is not a member
of any type. Some languages, however, do not treat overflows as an
error. In many implementations of C, mathematical overflow causes the
result to “wrap around” to lower values—for example, if m is
the largest integer value, and s is the smallest, then
This, too, is specific to individual languages, and in some cases
specific to individual compilers or machines. See Supported Languages, for further details on specific languages.
GDB provides some additional commands for controlling the range checker:
set check range auto-
Set range checking on or off based on the current working language.
See Supported Languages, for the default settings for
each language. set check range onset check range off-
Set range checking on or off, overriding the default setting for the
current working language. A warning is issued if the setting does not
match the language default. If a range error occurs and range checking is on,
then a message is printed and evaluation of the expression is aborted. set check range warn-
Output messages when the GDB range checker detects a range error,
but attempt to evaluate the expression anyway. Evaluating the
expression may still be impossible for other reasons, such as accessing
memory that the process does not own (a typical example from many Unix
systems). show check range-
Show the current setting of the range checker, and whether or not it is
being set automatically by GDB.
15.4 Supported Languages
GDB supports C, C++, D, Go, Objective-C, Fortran,
OpenCL C, Pascal, Rust, assembly, Modula-2, and Ada.
Some GDB features may be used in expressions regardless of the
language you use: the GDB @ and :: operators,
and the ‘{type}addr’ construct (see Expressions) can be used with the constructs of any supported
language.
The following sections detail to what degree each source language is
supported by GDB. These sections are not meant to be language
tutorials or references, but serve only as a reference guide to what the
GDB expression parser accepts, and what input and output
formats should look like for different languages. There are many good
books written on each of these languages; please look to these for a
language reference or tutorial.
15.4.1 C and C++
Since C and C++ are so closely related, many features of GDB apply
to both languages. Whenever this is the case, we discuss those languages
together.
The C++ debugging facilities are jointly implemented by the C++
compiler and GDB. Therefore, to debug your C++ code
effectively, you must compile your C++ programs with a supported
C++ compiler, such as GNU g++, or the HP ANSI C++
compiler (aCC).
15.4.1.1 C and C++ Operators
Operators must be defined on values of specific types. For instance,
+ is defined on numbers, but not on structures. Operators are
often defined on groups of types.
For the purposes of C and C++, the following definitions hold:
- Integral types include
intwith any of its storage-class
specifiers;char;enum; and, for C++,bool. - Floating-point types include
float,double, and
long double(if supported by the target platform). - Pointer types include all types defined as
(type *). - Scalar types include all of the above.
The following operators are supported. They are listed here
in order of increasing precedence:
,-
The comma or sequencing operator. Expressions in a comma-separated list
are evaluated from left to right, with the result of the entire
expression being the last expression evaluated. =-
Assignment. The value of an assignment expression is the value
assigned. Defined on scalar types. op=-
Used in an expression of the form
a op= b,
and translated toa = a op b.
op=and=have the same precedence. The operator
op is any one of the operators|,^,&,
<<,>>,+,-,*,/,%. ?:-
The ternary operator.
a ? b : ccan be thought
of as: if a then b else c. The argument a
should be of an integral type. ||-
Logical OR. Defined on integral types.
&&-
Logical AND. Defined on integral types.
|-
Bitwise OR. Defined on integral types.
^-
Bitwise exclusive-OR. Defined on integral types.
&-
Bitwise AND. Defined on integral types.
==, !=-
Equality and inequality. Defined on scalar types. The value of these
expressions is 0 for false and non-zero for true. <, >, <=, >=-
Less than, greater than, less than or equal, greater than or equal.
Defined on scalar types. The value of these expressions is 0 for false
and non-zero for true. <<, >>-
left shift, and right shift. Defined on integral types.
@-
The GDB “artificial array” operator (see Expressions).
+, --
Addition and subtraction. Defined on integral types, floating-point types and
pointer types. *, /, %-
Multiplication, division, and modulus. Multiplication and division are
defined on integral and floating-point types. Modulus is defined on
integral types. ++, ---
Increment and decrement. When appearing before a variable, the
operation is performed before the variable is used in an expression;
when appearing after it, the variable’s value is used before the
operation takes place. *-
Pointer dereferencing. Defined on pointer types. Same precedence as
++. &-
Address operator. Defined on variables. Same precedence as
++.For debugging C++, GDB implements a use of ‘&’ beyond what is
allowed in the C++ language itself: you can use ‘&(&ref)’
to examine the address
where a C++ reference variable (declared with ‘&ref’) is
stored. --
Negative. Defined on integral and floating-point types. Same
precedence as++. !-
Logical negation. Defined on integral types. Same precedence as
++. ~-
Bitwise complement operator. Defined on integral types. Same precedence as
++. ., ->-
Structure member, and pointer-to-structure member. For convenience,
GDB regards the two as equivalent, choosing whether to dereference a
pointer based on the stored type information.
Defined onstructanduniondata. .*, ->*-
Dereferences of pointers to members.
[]-
Array indexing.
a[i]is defined as
*(a+i). Same precedence as->. ()-
Function parameter list. Same precedence as
->. ::-
C++ scope resolution operator. Defined on
struct,union,
andclasstypes. ::-
Doubled colons also represent the GDB scope operator
(see Expressions). Same precedence as::,
above.
If an operator is redefined in the user code, GDB usually
attempts to invoke the redefined version instead of using the operator’s
predefined meaning.
15.4.1.2 C and C++ Constants
GDB allows you to express the constants of C and C++ in the
following ways:
- Integer constants are a sequence of digits. Octal constants are
specified by a leading ‘0’ (i.e. zero), and hexadecimal constants
by a leading ‘0x’ or ‘0X’. Constants may also end with a letter
‘l’, specifying that the constant should be treated as a
longvalue. - Floating point constants are a sequence of digits, followed by a decimal
point, followed by a sequence of digits, and optionally followed by an
exponent. An exponent is of the form:
‘e[[+]|—]nnn’, where nnn is another
sequence of digits. The ‘+’ is optional for positive exponents.
A floating-point constant may also end with a letter ‘f’ or
‘F’, specifying that the constant should be treated as being of
thefloat(as opposed to the defaultdouble) type; or with
a letter ‘l’ or ‘L’, which specifies along double
constant. - Enumerated constants consist of enumerated identifiers, or their
integral equivalents. - Character constants are a single character surrounded by single quotes
('), or a number—the ordinal value of the corresponding character
(usually its ASCII value). Within quotes, the single character may
be represented by a letter or by escape sequences, which are of
the form ‘nnn’, where nnn is the octal representation
of the character’s ordinal value; or of the form ‘x’, where
‘x’ is a predefined special character—for example,
‘n’ for newline.Wide character constants can be written by prefixing a character
constant with ‘L’, as in C. For example, ‘L’x’’ is the wide
form of ‘x’. The target wide character set is used when
computing the value of this constant (see Character Sets). - String constants are a sequence of character constants surrounded by
double quotes ("). Any valid character constant (as described
above) may appear. Double quotes within the string must be preceded by
a backslash, so for instance ‘«a»b’c»’ is a string of five
characters.Wide string constants can be written by prefixing a string constant
with ‘L’, as in C. The target wide character set is used when
computing the value of this constant (see Character Sets). - Pointer constants are an integral value. You can also write pointers
to constants using the C operator ‘&’. - Array constants are comma-separated lists surrounded by braces ‘{’
and ‘}’; for example, ‘{1,2,3}’ is a three-element array of
integers, ‘{{1,2}, {3,4}, {5,6}}’ is a three-by-two array,
and ‘{&»hi», &»there», &»fred»}’ is a three-element array of pointers.
15.4.1.3 C++ Expressions
GDB expression handling can interpret most C++ expressions.
Warning: GDB can only debug C++ code if you use
the proper compiler and the proper debug format. Currently,
GDB works best when debugging C++ code that is compiled
with the most recent version of GCC possible. The DWARF
debugging format is preferred; GCC defaults to this on most
popular platforms. Other compilers and/or debug formats are likely to
work badly or not at all when using GDB to debug C++
code. See Compilation.
-
Member function calls are allowed; you can use expressions like
count = aml->GetOriginal(x, y)
-
While a member function is active (in the selected stack frame), your
expressions have the same namespace available as the member function;
that is, GDB allows implicit references to the class instance
pointerthisfollowing the same rules as C++.using
declarations in the current scope are also respected by GDB. -
You can call overloaded functions; GDB resolves the function
call to the right definition, with some restrictions. GDB does not
perform overload resolution involving user-defined type conversions,
calls to constructors, or instantiations of templates that do not exist
in the program. It also cannot handle ellipsis argument lists or
default arguments.It does perform integral conversions and promotions, floating-point
promotions, arithmetic conversions, pointer conversions, conversions of
class objects to base classes, and standard conversions such as those of
functions or arrays to pointers; it requires an exact match on the
number of function arguments.Overload resolution is always performed, unless you have specified
set overload-resolution off. See GDB Features for C++.You must specify
set overload-resolution offin order to use an
explicit function signature to call an overloaded function, as inp 'foo(char,int)'('x', 13)The GDB command-completion facility can simplify this;
see Command Completion. -
GDB understands variables declared as C++ lvalue or rvalue
references; you can use them in expressions just as you do in C++
source—they are automatically dereferenced.In the parameter list shown when GDB displays a frame, the values of
reference variables are not displayed (unlike other variables); this
avoids clutter, since references are often used for large structures.
The address of a reference variable is always shown, unless
you have specified ‘set print address off’. - GDB supports the C++ name resolution operator
::—your
expressions can use it just as expressions in your program do. Since
one scope may be defined in another, you can use::repeatedly if
necessary, for example in an expression like
‘scope1::scope2::name’. GDB also allows
resolving name scope by reference to source files, in both C and C++
debugging (see Program Variables). - GDB performs argument-dependent lookup, following the C++
specification.
15.4.1.4 C and C++ Defaults
If you allow GDB to set range checking automatically, it
defaults to off whenever the working language changes to
C or C++. This happens regardless of whether you or GDB
selects the working language.
If you allow GDB to set the language automatically, it
recognizes source files whose names end with .c, .C, or
.cc, etc, and when GDB enters code compiled from one of
these files, it sets the working language to C or C++.
See Having GDB Infer the Source Language,
for further details.
15.4.1.5 C and C++ Type and Range Checks
By default, when GDB parses C or C++ expressions, strict type
checking is used. However, if you turn type checking off, GDB
will allow certain non-standard conversions, such as promoting integer
constants to pointers.
Range checking, if turned on, is done on mathematical operations. Array
indices are not checked, since they are often used to index a pointer
that is not itself an array.
15.4.1.6 GDB and C
The set print union and show print union commands apply to
the union type. When set to ‘on’, any union that is
inside a struct or class is also printed. Otherwise, it
appears as ‘{…}’.
The @ operator aids in the debugging of dynamic arrays, formed
with pointers and a memory allocation function. See Expressions.
15.4.1.7 GDB Features for C++
Some GDB commands are particularly useful with C++, and some are
designed specifically for use with C++. Here is a summary:
breakpoint menus-
When you want a breakpoint in a function whose name is overloaded,
GDB has the capability to display a menu of possible breakpoint
locations to help you specify which function definition you want.
See Ambiguous Expressions. rbreak regex-
Setting breakpoints using regular expressions is helpful for setting
breakpoints on overloaded functions that are not members of any special
classes.
See Setting Breakpoints. catch throwcatch rethrowcatch catch-
Debug C++ exception handling using these commands. See Setting Catchpoints.
ptype typename-
Print inheritance relationships as well as other information for type
typename.
See Examining the Symbol Table. info vtbl expression.-
The
info vtblcommand can be used to display the virtual
method tables of the object computed by expression. This shows
one entry per virtual table; there may be multiple virtual tables when
multiple inheritance is in use. demangle name-
Demangle name.
See Symbols, for a more complete description of thedemanglecommand. set print demangleshow print demangleset print asm-demangleshow print asm-demangle-
Control whether C++ symbols display in their source form, both when
displaying code as C++ source and when displaying disassemblies.
See Print Settings. set print objectshow print object-
Choose whether to print derived (actual) or declared types of objects.
See Print Settings. set print vtblshow print vtbl-
Control the format for printing virtual function tables.
See Print Settings.
(Thevtblcommands do not work on programs compiled with the HP
ANSI C++ compiler (aCC).) set overload-resolution on-
Enable overload resolution for C++ expression evaluation. The default
is on. For overloaded functions, GDB evaluates the arguments
and searches for a function whose signature matches the argument types,
using the standard C++ conversion rules (see C++ Expressions, for details).
If it cannot find a match, it emits a message. set overload-resolution off-
Disable overload resolution for C++ expression evaluation. For
overloaded functions that are not class member functions, GDB
chooses the first function of the specified name that it finds in the
symbol table, whether or not its arguments are of the correct type. For
overloaded functions that are class member functions, GDB
searches for a function whose signature exactly matches the
argument types. show overload-resolution-
Show the current setting of overload resolution.
Overloaded symbol names-
You can specify a particular definition of an overloaded symbol, using
the same notation that is used to declare such symbols in C++: type
symbol(types)rather than just symbol. You can
also use the GDB command-line word completion facilities to list the
available choices, or to finish the type list for you.
See Command Completion, for details on how to do this. Breakpoints in template functions-
Similar to how overloaded symbols are handled, GDB will ignore
template parameter lists when it encounters a symbol which includes a
C++ template. This permits setting breakpoints on families of template functions
or functions whose parameters include template types.The -qualified flag may be used to override this behavior, causing
GDB to search for a specific function or type.The GDB command-line word completion facility also understands
template parameters and may be used to list available choices or finish
template parameter lists for you. See Command Completion, for
details on how to do this. Breakpoints in functions with ABI tags-
The GNU C++ compiler introduced the notion of ABI “tags”, which
correspond to changes in the ABI of a type, function, or variable that
would not otherwise be reflected in a mangled name. See
https://developers.redhat.com/blog/2015/02/05/gcc5-and-the-c11-abi/
for more detail.The ABI tags are visible in C++ demangled names. For example, a
function that returns a std::string:std::string function(int);
when compiled for the C++11 ABI is marked with the
cxx11ABI
tag, and GDB displays the symbol like this:You can set a breakpoint on such functions simply as if they had no
tag. For example:(gdb) b function(int) Breakpoint 2 at 0x40060d: file main.cc, line 10. (gdb) info breakpoints Num Type Disp Enb Address What 1 breakpoint keep y 0x0040060d in function[abi:cxx11](int) at main.cc:10On the rare occasion you need to disambiguate between different ABI
tags, you can do so by simply including the ABI tag in the function
name, like:(gdb) b ambiguous[abi:other_tag](int)
15.4.1.8 Decimal Floating Point format
GDB can examine, set and perform computations with numbers in
decimal floating point format, which in the C language correspond to the
_Decimal32, _Decimal64 and _Decimal128 types as
specified by the extension to support decimal floating-point arithmetic.
There are two encodings in use, depending on the architecture: BID (Binary
Integer Decimal) for x86 and x86-64, and DPD (Densely Packed Decimal) for
PowerPC and S/390. GDB will use the appropriate encoding for the
configured target.
Because of a limitation in libdecnumber, the library used by GDB
to manipulate decimal floating point numbers, it is not possible to convert
(using a cast, for example) integers wider than 32-bit to decimal float.
In addition, in order to imitate GDB’s behaviour with binary floating
point computations, error checking in decimal float operations ignores
underflow, overflow and divide by zero exceptions.
In the PowerPC architecture, GDB provides a set of pseudo-registers
to inspect _Decimal128 values stored in floating point registers.
See PowerPC for more details.
15.4.2 D
GDB can be used to debug programs written in D and compiled with
GDC, LDC or DMD compilers. Currently GDB supports only one D
specific feature — dynamic arrays.
15.4.3 Go
GDB can be used to debug programs written in Go and compiled with
gccgo or 6g compilers.
Here is a summary of the Go-specific features and restrictions:
The current Go package-
The name of the current package does not need to be specified when
specifying global variables and functions.For example, given the program:
package main var myglob = "Shall we?" func main () { // ... }When stopped inside
maineither of these work:(gdb) p myglob (gdb) p main.myglob
Builtin Go types-
The
stringtype is recognized by GDB and is printed
as a string. Builtin Go functions-
The GDB expression parser recognizes the
unsafe.Sizeof
function and handles it internally. Restrictions on Go expressions-
All Go operators are supported except
&^.
The Go_“blank identifier” is not supported.
Automatic dereferencing of pointers is not supported.
15.4.4 Objective-C
This section provides information about some commands and command
options that are useful for debugging Objective-C code. See also
info classes, and info selectors, for a
few more commands specific to Objective-C support.
15.4.4.1 Method Names in Commands
The following commands have been extended to accept Objective-C method
names as line specifications:
-
clear -
break -
info line -
jump -
list
A fully qualified Objective-C method name is specified as
where the minus sign is used to indicate an instance method and a
plus sign (not shown) is used to indicate a class method. The class
name Class and method name methodName are enclosed in
brackets, similar to the way messages are specified in Objective-C
source code. For example, to set a breakpoint at the create
instance method of class Fruit in the program currently being
debugged, enter:
To list ten program lines around the initialize class method,
enter:
list +[NSText initialize]
In the current version of GDB, the plus or minus sign is
required. In future versions of GDB, the plus or minus
sign will be optional, but you can use it to narrow the search. It
is also possible to specify just a method name:
You must specify the complete method name, including any colons. If
your program’s source files contain more than one create method,
you’ll be presented with a numbered list of classes that implement that
method. Indicate your choice by number, or type ‘0’ to exit if
none apply.
As another example, to clear a breakpoint established at the
makeKeyAndOrderFront: method of the NSWindow class, enter:
clear -[NSWindow makeKeyAndOrderFront:]
15.4.4.2 The Print Command With Objective-C
The print command has also been extended to accept methods. For example:
will tell GDB to send the hash message to object
and print the result. Also, an additional command has been added,
print-object or po for short, which is meant to print
the description of an object. However, this command may only work
with certain Objective-C libraries that have a particular hook
function, _NSPrintForDebugger, defined.
15.4.5 OpenCL C
This section provides information about GDBs OpenCL C support.
15.4.5.1 OpenCL C Datatypes
GDB supports the builtin scalar and vector datatypes specified
by OpenCL 1.1. In addition the half- and double-precision floating point
data types of the cl_khr_fp16 and cl_khr_fp64 OpenCL
extensions are also known to GDB.
15.4.5.2 OpenCL C Expressions
GDB supports accesses to vector components including the access as
lvalue where possible. Since OpenCL C is based on C99 most C expressions
supported by GDB can be used as well.
15.4.5.3 OpenCL C Operators
GDB supports the operators specified by OpenCL 1.1 for scalar and
vector data types.
15.4.6 Fortran
GDB can be used to debug programs written in Fortran. Note, that not
all Fortran language features are available yet.
Some Fortran compilers (GNU Fortran 77 and Fortran 95 compilers
among them) append an underscore to the names of variables and
functions. When you debug programs compiled by those compilers, you
will need to refer to variables and functions with a trailing
underscore.
Fortran symbols are usually case-insensitive, so GDB by
default uses case-insensitive matching for Fortran symbols. You can
change that with the ‘set case-insensitive’ command, see
Symbols, for the details.
15.4.6.1 Fortran Types
In Fortran the primitive data-types have an associated KIND type
parameter, written as ‘type*kindparam’,
‘type*kindparam’, or in the GDB-only dialect
‘type_kindparam’. A concrete example would be
‘Real*4’, ‘Real(kind=4)’, and ‘Real_4’.
The kind of a type can be retrieved by using the intrinsic function
KIND, see Fortran Intrinsics.
Generally, the actual implementation of the KIND type parameter is
compiler specific. In GDB the kind parameter is implemented in
accordance with its use in the GNU gfortran compiler. Here, the
kind parameter for a given type specifies its size in memory — a
Fortran Integer*4 or Integer(kind=4) would be an integer type
occupying 4 bytes of memory. An exception to this rule is the Complex
type for which the kind of the type does not specify its entire size, but
the size of each of the two Real’s it is composed of. A
Complex*4 would thus consist of two Real*4s and occupy 8 bytes
of memory.
For every type there is also a default kind associated with it, e.g. Integer in GDB will internally be an Integer*4 (see the
table below for default types). The default types are the same as in GNU
compilers but note, that the GNU default types can actually be changed by
compiler flags such as -fdefault-integer-8 and
-fdefault-real-8.
Not every kind parameter is valid for every type and in GDB the
following type kinds are available.
Integer-
Integer*1,Integer*2,Integer*4,Integer*8, and
Integer=Integer*4. Logical-
Logical*1,Logical*2,Logical*4,Logical*8, and
Logical=Logical*4. Real-
Real*4,Real*8,Real*16, andReal=Real*4. Complex-
Complex*4,Complex*8,Complex*16, andComplex=
Complex*4.
15.4.6.2 Fortran Operators and Expressions
Operators must be defined on values of specific types. For instance,
+ is defined on numbers, but not on characters or other non-
arithmetic types. Operators are often defined on groups of types.
**-
The exponentiation operator. It raises the first operand to the power
of the second one. :-
The range operator. Normally used in the form of array(low:high) to
represent a section of array. %-
The access component operator. Normally used to access elements in derived
types. Also suitable for unions. As unions aren’t part of regular Fortran,
this can only happen when accessing a register that uses a gdbarch-defined
union type. ::-
The scope operator. Normally used to access variables in modules or
to set breakpoints on subroutines nested in modules or in other
subroutines (internal subroutines).
15.4.6.3 Fortran Intrinsics
Fortran provides a large set of intrinsic procedures. GDB implements
an incomplete subset of those procedures and their overloads. Some of these
procedures take an optional KIND parameter, see Fortran Types.
ABS(a)-
Computes the absolute value of its argument a. Currently not supported
forComplexarguments. ALLOCATE(array)-
Returns whether array is allocated or not.
ASSOCIATED(pointer [, target])-
Returns the association status of the pointer pointer or, if target
is present, whether pointer is associated with the target target. CEILING(a [, kind])-
Computes the least integer greater than or equal to a. The optional
parameter kind specifies the kind of the return type
Integer(kind). CMPLX(x [, y [, kind]])-
Returns a complex number where x is converted to the real component. If
y is present it is converted to the imaginary component. If y is
not present then the imaginary component is set to0.0except if x
itself is ofComplextype. The optional parameter kind specifies
the kind of the return typeComplex(kind). FLOOR(a [, kind])-
Computes the greatest integer less than or equal to a. The optional
parameter kind specifies the kind of the return type
Integer(kind). KIND(a)-
Returns the kind value of the argument a, see Fortran Types.
LBOUND(array [, dim [, kind]])-
Returns the lower bounds of an array, or a single lower bound along the
dim dimension if present. The optional parameter kind specifies
the kind of the return typeInteger(kind). LOC(x)-
Returns the address of x as an
Integer. MOD(a, p)-
Computes the remainder of the division of a by p.
MODULO(a, p)-
Computes the a modulo p.
RANK(a)-
Returns the rank of a scalar or array (scalars have rank
0). SHAPE(a)-
Returns the shape of a scalar or array (scalars have shape ‘()’).
SIZE(array[, dim [, kind]])-
Returns the extent of array along a specified dimension dim, or the
total number of elements in array if dim is absent. The optional
parameter kind specifies the kind of the return type
Integer(kind). UBOUND(array [, dim [, kind]])-
Returns the upper bounds of an array, or a single upper bound along the
dim dimension if present. The optional parameter kind specifies
the kind of the return typeInteger(kind).
15.4.6.4 Special Fortran Commands
GDB has some commands to support Fortran-specific features,
such as displaying common blocks.
info common [common-name]-
This command prints the values contained in the Fortran
COMMON
block whose name is common-name. With no argument, the names of
allCOMMONblocks visible at the current program location are
printed. set fortran repack-array-slices [on|off]show fortran repack-array-slices-
When taking a slice from an array, a Fortran compiler can choose to
either produce an array descriptor that describes the slice in place,
or it may repack the slice, copying the elements of the slice into a
new region of memory.When this setting is on, then GDB will also repack array
slices in some situations. When this setting is off, then
GDB will create array descriptors for slices that reference
the original data in place.GDB will never repack an array slice if the data for the
slice is contiguous within the original array.GDB will always repack string slices if the data for the
slice is non-contiguous within the original string as GDB
does not support printing non-contiguous strings.The default for this setting is
off.
15.4.7 Pascal
Debugging Pascal programs which use sets, subranges, file variables, or
nested functions does not currently work. GDB does not support
entering expressions, printing values, or similar features using Pascal
syntax.
The Pascal-specific command set print pascal_static-members
controls whether static members of Pascal objects are displayed.
See pascal_static-members.
15.4.8 Rust
GDB supports the Rust
Programming Language. Type- and value-printing, and expression
parsing, are reasonably complete. However, there are a few
peculiarities and holes to be aware of.
- Linespecs (see Location Specifications) are never relative to the
current crate. Instead, they act as if there were a global namespace
of crates, somewhat similar to the wayextern cratebehaves.That is, if GDB is stopped at a breakpoint in a function in
crate ‘A’, module ‘B’, thenbreak B::fwill attempt
to set a breakpoint in a function named ‘f’ in a crate named
‘B’.As a consequence of this approach, linespecs also cannot refer to
items using ‘self::’ or ‘super::’. - Because GDB implements Rust name-lookup semantics in
expressions, it will sometimes prepend the current crate to a name.
For example, if GDB is stopped at a breakpoint in the crate
‘K’, thenprint ::x::ywill try to find the symbol
‘K::x::y’.However, since it is useful to be able to refer to other crates when
debugging, GDB provides theexternextension to
circumvent this. To use the extension, just putexternbefore
a path expression to refer to the otherwise unavailable “global”
scope.In the above example, if you wanted to refer to the symbol ‘y’ in
the crate ‘x’, you would useprint extern x::y. - The Rust expression evaluator does not support “statement-like”
expressions such asiformatch, or lambda expressions. - Tuple expressions are not implemented.
- The Rust expression evaluator does not currently implement the
Droptrait. Objects that may be created by the evaluator will
never be destroyed. - GDB does not implement type inference for generics. In order
to call generic functions or otherwise refer to generic items, you
will have to specify the type parameters manually. - GDB currently uses the C++ demangler for Rust. In most
cases this does not cause any problems. However, in an expression
context, completing a generic function name will give syntactically
invalid results. This happens because Rust requires the ‘::’
operator between the function name and its generic arguments. For
example, GDB might provide a completion like
crate::f<u32>, where the parser would require
crate::f::<u32>. - As of this writing, the Rust compiler (version 1.8) has a few holes in
the debugging information it generates. These holes prevent certain
features from being implemented by GDB:- Method calls cannot be made via traits.
- Operator overloading is not implemented.
- When debugging in a monomorphized function, you cannot use the generic
type names. - The type
Selfis not available. -
usestatements are not available, so some names may not be
available in the crate.
15.4.9 Modula-2
The extensions made to GDB to support Modula-2 only support
output from the GNU Modula-2 compiler (which is currently being
developed). Other Modula-2 compilers are not currently supported, and
attempting to debug executables produced by them is most likely
to give an error as GDB reads in the executable’s symbol
table.
15.4.9.1 Operators
Operators must be defined on values of specific types. For instance,
+ is defined on numbers, but not on structures. Operators are
often defined on groups of types. For the purposes of Modula-2, the
following definitions hold:
- Integral types consist of
INTEGER,CARDINAL, and
their subranges. - Character types consist of
CHARand its subranges. - Floating-point types consist of
REAL. - Pointer types consist of anything declared as
POINTER TO.
type - Scalar types consist of all of the above.
- Set types consist of
SETandBITSETtypes. - Boolean types consist of
BOOLEAN.
The following operators are supported, and appear in order of
increasing precedence:
,-
Function argument or array index separator.
:=-
Assignment. The value of var
:=value is
value. <, >-
Less than, greater than on integral, floating-point, or enumerated
types. <=, >=-
Less than or equal to, greater than or equal to
on integral, floating-point and enumerated types, or set inclusion on
set types. Same precedence as<. =, <>, #-
Equality and two ways of expressing inequality, valid on scalar types.
Same precedence as<. In GDB scripts, only<>is
available for inequality, since#conflicts with the script
comment character. IN-
Set membership. Defined on set types and the types of their members.
Same precedence as<. OR-
Boolean disjunction. Defined on boolean types.
AND, &-
Boolean conjunction. Defined on boolean types.
@-
The GDB “artificial array” operator (see Expressions).
+, --
Addition and subtraction on integral and floating-point types, or union
and difference on set types. *-
Multiplication on integral and floating-point types, or set intersection
on set types. /-
Division on floating-point types, or symmetric set difference on set
types. Same precedence as*. DIV, MOD-
Integer division and remainder. Defined on integral types. Same
precedence as*. --
Negative. Defined on
INTEGERandREALdata. ^-
Pointer dereferencing. Defined on pointer types.
NOT-
Boolean negation. Defined on boolean types. Same precedence as
^. .-
RECORDfield selector. Defined onRECORDdata. Same
precedence as^. []-
Array indexing. Defined on
ARRAYdata. Same precedence as^. ()-
Procedure argument list. Defined on
PROCEDUREobjects. Same precedence
as^. ::, .-
GDB and Modula-2 scope operators.
Warning: Set expressions and their operations are not yet supported, so GDB
treats the use of the operatorIN, or the use of operators
+,-,*,/,=, ,<>,#,
<=, and>=on sets as an error.
15.4.9.2 Built-in Functions and Procedures
Modula-2 also makes available several built-in procedures and functions.
In describing these, the following metavariables are used:
- a
-
represents an
ARRAYvariable. - c
-
represents a
CHARconstant or variable. - i
-
represents a variable or constant of integral type.
- m
-
represents an identifier that belongs to a set. Generally used in the
same function with the metavariable s. The type of s should
beSET OF mtype(where mtype is the type of m). - n
-
represents a variable or constant of integral or floating-point type.
- r
-
represents a variable or constant of floating-point type.
- t
-
represents a type.
- v
-
represents a variable.
- x
-
represents a variable or constant of one of many types. See the
explanation of the function for details.
All Modula-2 built-in procedures also return a result, described below.
ABS(n)-
Returns the absolute value of n.
CAP(c)-
If c is a lower case letter, it returns its upper case
equivalent, otherwise it returns its argument. CHR(i)-
Returns the character whose ordinal value is i.
DEC(v)-
Decrements the value in the variable v by one. Returns the new value.
DEC(v,i)-
Decrements the value in the variable v by i. Returns the
new value. EXCL(m,s)-
Removes the element m from the set s. Returns the new
set. FLOAT(i)-
Returns the floating point equivalent of the integer i.
HIGH(a)-
Returns the index of the last member of a.
INC(v)-
Increments the value in the variable v by one. Returns the new value.
INC(v,i)-
Increments the value in the variable v by i. Returns the
new value. INCL(m,s)-
Adds the element m to the set s if it is not already
there. Returns the new set. MAX(t)-
Returns the maximum value of the type t.
MIN(t)-
Returns the minimum value of the type t.
ODD(i)-
Returns boolean TRUE if i is an odd number.
ORD(x)-
Returns the ordinal value of its argument. For example, the ordinal
value of a character is its ASCII value (on machines supporting
the ASCII character set). The argument x must be of an
ordered type, which include integral, character and enumerated types. SIZE(x)-
Returns the size of its argument. The argument x can be a
variable or a type. TRUNC(r)-
Returns the integral part of r.
TSIZE(x)-
Returns the size of its argument. The argument x can be a
variable or a type. VAL(t,i)-
Returns the member of the type t whose ordinal value is i.
Warning: Sets and their operations are not yet supported, so
GDB treats the use of proceduresINCLandEXCLas
an error.
15.4.9.3 Constants
GDB allows you to express the constants of Modula-2 in the following
ways:
- Integer constants are simply a sequence of digits. When used in an
expression, a constant is interpreted to be type-compatible with the
rest of the expression. Hexadecimal integers are specified by a
trailing ‘H’, and octal integers by a trailing ‘B’. - Floating point constants appear as a sequence of digits, followed by a
decimal point and another sequence of digits. An optional exponent can
then be specified, in the form ‘E[+|—]nnn’, where
‘[+|—]nnn’ is the desired exponent. All of the
digits of the floating point constant must be valid decimal (base 10)
digits. - Character constants consist of a single character enclosed by a pair of
like quotes, either single (') or double ("). They may
also be expressed by their ordinal value (their ASCII value, usually)
followed by a ‘C’. - String constants consist of a sequence of characters enclosed by a
pair of like quotes, either single (') or double (").
Escape sequences in the style of C are also allowed. See C and C++ Constants, for a brief explanation of escape
sequences. - Enumerated constants consist of an enumerated identifier.
- Boolean constants consist of the identifiers
TRUEand
FALSE. - Pointer constants consist of integral values only.
- Set constants are not yet supported.
15.4.9.4 Modula-2 Types
Currently GDB can print the following data types in Modula-2
syntax: array types, record types, set types, pointer types, procedure
types, enumerated types, subrange types and base types. You can also
print the contents of variables declared using these type.
This section gives a number of simple source code examples together with
sample GDB sessions.
The first example contains the following section of code:
VAR s: SET OF CHAR ; r: [20..40] ;
and you can request GDB to interrogate the type and value of
r and s.
(gdb) print s
{'A'..'C', 'Z'}
(gdb) ptype s
SET OF CHAR
(gdb) print r
21
(gdb) ptype r
[20..40]
Likewise if your source code declares s as:
then you may query the type of s by:
(gdb) ptype s type = SET ['A'..'Z']
Note that at present you cannot interactively manipulate set
expressions using the debugger.
The following example shows how you might declare an array in Modula-2
and how you can interact with GDB to print its type and contents:
VAR s: ARRAY [-10..10] OF CHAR ;
(gdb) ptype s ARRAY [-10..10] OF CHAR
Note that the array handling is not yet complete and although the type
is printed correctly, expression handling still assumes that all
arrays have a lower bound of zero and not -10 as in the example
above.
Here are some more type related Modula-2 examples:
TYPE colour = (blue, red, yellow, green) ; t = [blue..yellow] ; VAR s: t ; BEGIN s := blue ;
The GDB interaction shows how you can query the data type
and value of a variable.
(gdb) print s $1 = blue (gdb) ptype t type = [blue..yellow]
In this example a Modula-2 array is declared and its contents
displayed. Observe that the contents are written in the same way as
their C counterparts.
VAR s: ARRAY [1..5] OF CARDINAL ; BEGIN s[1] := 1 ;
(gdb) print s
$1 = {1, 0, 0, 0, 0}
(gdb) ptype s
type = ARRAY [1..5] OF CARDINAL
The Modula-2 language interface to GDB also understands
pointer types as shown in this example:
VAR s: POINTER TO ARRAY [1..5] OF CARDINAL ; BEGIN NEW(s) ; s^[1] := 1 ;
and you can request that GDB describes the type of s.
(gdb) ptype s type = POINTER TO ARRAY [1..5] OF CARDINAL
GDB handles compound types as we can see in this example.
Here we combine array types, record types, pointer types and subrange
types:
TYPE
foo = RECORD
f1: CARDINAL ;
f2: CHAR ;
f3: myarray ;
END ;
myarray = ARRAY myrange OF CARDINAL ;
myrange = [-2..2] ;
VAR
s: POINTER TO ARRAY myrange OF foo ;
and you can ask GDB to describe the type of s as shown
below.
(gdb) ptype s
type = POINTER TO ARRAY [-2..2] OF foo = RECORD
f1 : CARDINAL;
f2 : CHAR;
f3 : ARRAY [-2..2] OF CARDINAL;
END
15.4.9.5 Modula-2 Defaults
If type and range checking are set automatically by GDB, they
both default to on whenever the working language changes to
Modula-2. This happens regardless of whether you or GDB
selected the working language.
If you allow GDB to set the language automatically, then entering
code compiled from a file whose name ends with .mod sets the
working language to Modula-2. See Having GDB
Infer the Source Language, for further details.
15.4.9.6 Deviations from Standard Modula-2
A few changes have been made to make Modula-2 programs easier to debug.
This is done primarily via loosening its type strictness:
- Unlike in standard Modula-2, pointer constants can be formed by
integers. This allows you to modify pointer variables during
debugging. (In standard Modula-2, the actual address contained in a
pointer variable is hidden from you; it can only be modified
through direct assignment to another pointer variable or expression that
returned a pointer.) - C escape sequences can be used in strings and characters to represent
non-printable characters. GDB prints out strings with these
escape sequences embedded. Single non-printable characters are
printed using the ‘CHR(nnn)’ format. - The assignment operator (
:=) returns the value of its right-hand
argument. - All built-in procedures both modify and return their argument.
15.4.9.7 Modula-2 Type and Range Checks
Warning: in this release, GDB does not yet perform type or
range checking.
GDB considers two Modula-2 variables type equivalent if:
- They are of types that have been declared equivalent via a
TYPEstatement
t1 = t2 - They have been declared on the same line. (Note: This is true of the
GNU Modula-2 compiler, but it may not be true of other compilers.)
As long as type checking is enabled, any attempt to combine variables
whose types are not equivalent is an error.
Range checking is done on all mathematical operations, assignment, array
index bounds, and all built-in functions and procedures.
15.4.9.8 The Scope Operators :: and .
There are a few subtle differences between the Modula-2 scope operator
(.) and the GDB scope operator (::). The two have
similar syntax:
where scope is the name of a module or a procedure,
module the name of a module, and id is any declared
identifier within your program, except another module.
Using the :: operator makes GDB search the scope
specified by scope for the identifier id. If it is not
found in the specified scope, then GDB searches all scopes
enclosing the one specified by scope.
Using the . operator makes GDB search the current scope for
the identifier specified by id that was imported from the
definition module specified by module. With this operator, it is
an error if the identifier id was not imported from definition
module module, or if id is not an identifier in
module.
15.4.9.9 GDB and Modula-2
Some GDB commands have little use when debugging Modula-2 programs.
Five subcommands of set print and show print apply
specifically to C and C++: ‘vtbl’, ‘demangle’,
‘asm-demangle’, ‘object’, and ‘union’. The first four
apply to C++, and the last to the C union type, which has no direct
analogue in Modula-2.
The @ operator (see Expressions), while available
with any language, is not useful with Modula-2. Its
intent is to aid the debugging of dynamic arrays, which cannot be
created in Modula-2 as they can in C or C++. However, because an
address can be specified by an integral constant, the construct
‘{type}adrexp’ is still useful.
In GDB scripts, the Modula-2 inequality operator # is
interpreted as the beginning of a comment. Use <> instead.
15.4.10 Ada
The extensions made to GDB for Ada only support
output from the GNU Ada (GNAT) compiler.
Other Ada compilers are not currently supported, and
attempting to debug executables produced by them is most likely
to be difficult.
15.4.10.1 Introduction
The Ada mode of GDB supports a fairly large subset of Ada expression
syntax, with some extensions.
The philosophy behind the design of this subset is
- That GDB should provide basic literals and access to operations for
arithmetic, dereferencing, field selection, indexing, and subprogram calls,
leaving more sophisticated computations to subprograms written into the
program (which therefore may be called from GDB). - That type safety and strict adherence to Ada language restrictions
are not particularly important to the GDB user. - That brevity is important to the GDB user.
Thus, for brevity, the debugger acts as if all names declared in
user-written packages are directly visible, even if they are not visible
according to Ada rules, thus making it unnecessary to fully qualify most
names with their packages, regardless of context. Where this causes
ambiguity, GDB asks the user’s intent.
The debugger will start in Ada mode if it detects an Ada main program.
As for other languages, it will enter Ada mode when stopped in a program that
was translated from an Ada source file.
While in Ada mode, you may use ‘—’ for comments. This is useful
mostly for documenting command files. The standard GDB comment
(‘#’) still works at the beginning of a line in Ada mode, but not in the
middle (to allow based literals).
15.4.10.2 Omissions from Ada
Here are the notable omissions from the subset:
- Only a subset of the attributes are supported:
- — ‘First, ‘Last, and ‘Length
on array objects (not on types and subtypes). - — ‘Min and ‘Max.
- — ‘Pos and ‘Val.
- — ‘Tag.
- — ‘Range on array objects (not subtypes), but only as the right
operand of the membership (in) operator. - — ‘Access, ‘Unchecked_Access, and
‘Unrestricted_Access (a GNAT extension). - — ‘Address.
- — ‘First, ‘Last, and ‘Length
- The names in
Characters.Latin_1are not available. - Equality tests (‘=’ and ‘/=’) on arrays test for bitwise
equality of representations. They will generally work correctly
for strings and arrays whose elements have integer or enumeration types.
They may not work correctly for arrays whose element
types have user-defined equality, for arrays of real values
(in particular, IEEE-conformant floating point, because of negative
zeroes and NaNs), and for arrays whose elements contain unused bits with
indeterminate values. - The other component-by-component array operations (
and,or,
xor,not, and relational tests other than equality)
are not implemented. -
There is limited support for array and record aggregates. They are
permitted only on the right sides of assignments, as in these examples:(gdb) set An_Array := (1, 2, 3, 4, 5, 6) (gdb) set An_Array := (1, others => 0) (gdb) set An_Array := (0|4 => 1, 1..3 => 2, 5 => 6) (gdb) set A_2D_Array := ((1, 2, 3), (4, 5, 6), (7, 8, 9)) (gdb) set A_Record := (1, "Peter", True); (gdb) set A_Record := (Name => "Peter", Id => 1, Alive => True)
Changing a
discriminant’s value by assigning an aggregate has an
undefined effect if that discriminant is used within the record.
However, you can first modify discriminants by directly assigning to
them (which normally would not be allowed in Ada), and then performing an
aggregate assignment. For example, given a variableA_Rec
declared to have a type such as:type Rec (Len : Small_Integer := 0) is record Id : Integer; Vals : IntArray (1 .. Len); end record;you can assign a value with a different size of
Valswith two
assignments:(gdb) set A_Rec.Len := 4 (gdb) set A_Rec := (Id => 42, Vals => (1, 2, 3, 4))
As this example also illustrates, GDB is very loose about the usual
rules concerning aggregates. You may leave out some of the
components of an array or record aggregate (such as theLen
component in the assignment toA_Recabove); they will retain their
original values upon assignment. You may freely use dynamic values as
indices in component associations. You may even use overlapping or
redundant component associations, although which component values are
assigned in such cases is not defined. - Calls to dispatching subprograms are not implemented.
- The overloading algorithm is much more limited (i.e., less selective)
than that of real Ada. It makes only limited use of the context in
which a subexpression appears to resolve its meaning, and it is much
looser in its rules for allowing type matches. As a result, some
function calls will be ambiguous, and the user will be asked to choose
the proper resolution. - The
newoperator is not implemented. - Entry calls are not implemented.
- Aside from printing, arithmetic operations on the native VAX floating-point
formats are not supported. - It is not possible to slice a packed array.
- The names
TrueandFalse, when not part of a qualified name,
are interpreted as if implicitly prefixed byStandard, regardless of
context.
Should your program
redefine these names in a package or procedure (at best a dubious practice),
you will have to use fully qualified names to access their new definitions. - Based real literals are not implemented.
15.4.10.3 Additions to Ada
As it does for other languages, GDB makes certain generic
extensions to Ada (see Expressions):
- If the expression E is a variable residing in memory (typically
a local variable or array element) and N is a positive integer,
thenE@Ndisplays the values of E and the
N-1 adjacent variables following it in memory as an array. In
Ada, this operator is generally not necessary, since its prime use is
in displaying parts of an array, and slicing will usually do this in
Ada. However, there are occasional uses when debugging programs in
which certain debugging information has been optimized away. -
B::varmeans “the variable named var that
appears in function or file B.” When B is a file name,
you must typically surround it in single quotes. - The expression
{type} addrmeans “the variable of type
type that appears at address addr.” - A name starting with ‘$’ is a convenience variable
(see Convenience Vars) or a machine register (see Registers).
In addition, GDB provides a few other shortcuts and outright
additions specific to Ada:
- The assignment statement is allowed as an expression, returning
its right-hand operand as its value. Thus, you may enter(gdb) set x := y + 3 (gdb) print A(tmp := y + 1)
- The semicolon is allowed as an “operator,” returning as its value
the value of its right-hand operand.
This allows, for example,
complex conditional breaks:(gdb) break f (gdb) condition 1 (report(i); k += 1; A(k) > 100)
- An extension to based literals can be used to specify the exact byte
contents of a floating-point literal. After the base, you can use
from zero to two ‘l’ characters, followed by an ‘f’. The
number of ‘l’ characters controls the width of the resulting real
constant: zero meansFloatis used, one means
Long_Float, and two meansLong_Long_Float.(gdb) print 16f#41b80000# $1 = 23.0
- Rather than use catenation and symbolic character names to introduce special
characters into strings, one may instead use a special bracket notation,
which is also used to print strings. A sequence of characters of the form
‘[«XX«]’ within a string or character literal denotes the
(single) character whose numeric encoding is XX in hexadecimal. The
sequence of characters ‘[«»»]’ also denotes a single quotation mark
in strings. For example,"One line.["0a"]Next line.["0a"]"
contains an ASCII newline character (
Ada.Characters.Latin_1.LF)
after each period. - The subtype used as a prefix for the attributes ‘Pos, ‘Min, and
‘Max is optional (and is ignored in any case). For example, it is valid
to write - When printing arrays, GDB uses positional notation when the
array has a lower bound of 1, and uses a modified named notation otherwise.
For example, a one-dimensional array of three integers with a lower bound
of 3 might print asThat is, in contrast to valid Ada, only the first component has a
=>
clause. - You may abbreviate attributes in expressions with any unique,
multi-character subsequence of
their names (an exact match gets preference).
For example, you may use a’len, a’gth, or a’lh
in place of a’length. -
Since Ada is case-insensitive, the debugger normally maps identifiers you type
to lower case. The GNAT compiler uses upper-case characters for
some of its internal identifiers, which are normally of no interest to users.
For the rare occasions when you actually have to look at them,
enclose them in angle brackets to avoid the lower-case mapping.
For example,(gdb) print <JMPBUF_SAVE>[0]
- Printing an object of class-wide type or dereferencing an
access-to-class-wide value will display all the components of the object’s
specific type (as indicated by its run-time tag). Likewise, component
selection on such a value will operate on the specific type of the
object.
15.4.10.4 Overloading support for Ada
The debugger supports limited overloading. Given a subprogram call in which
the function symbol has multiple definitions, it will use the number of
actual parameters and some information about their types to attempt to narrow
the set of definitions. It also makes very limited use of context, preferring
procedures to functions in the context of the call command, and
functions to procedures elsewhere.
If, after narrowing, the set of matching definitions still contains more than
one definition, GDB will display a menu to query which one it should
use, for instance:
(gdb) print f(1) Multiple matches for f [0] cancel [1] foo.f (integer) return boolean at foo.adb:23 [2] foo.f (foo.new_integer) return boolean at foo.adb:28 >
In this case, just select one menu entry either to cancel expression evaluation
(type 0 and press RET) or to continue evaluation with a specific
instance (type the corresponding number and press RET).
Here are a couple of commands to customize GDB’s behavior in this
case:
set ada print-signatures-
Control whether parameter types and return types are displayed in overloads
selection menus. It isonby default.
See Overloading support for Ada. show ada print-signatures-
Show the current setting for displaying parameter types and return types in
overloads selection menu.
See Overloading support for Ada.
15.4.10.5 Stopping at the Very Beginning
It is sometimes necessary to debug the program during elaboration, and
before reaching the main procedure.
As defined in the Ada Reference
Manual, the elaboration code is invoked from a procedure called
adainit. To run your program up to the beginning of
elaboration, simply use the following two commands:
tbreak adainit and run.
15.4.10.6 Ada Exceptions
A command is provided to list all Ada exceptions:
info exceptionsinfo exceptions regexp-
The
info exceptionscommand allows you to list all Ada exceptions
defined within the program being debugged, as well as their addresses.
With a regular expression, regexp, as argument, only those exceptions
whose names match regexp are listed.
Below is a small example, showing how the command can be used, first
without argument, and next with a regular expression passed as an
argument.
(gdb) info exceptions All defined Ada exceptions: constraint_error: 0x613da0 program_error: 0x613d20 storage_error: 0x613ce0 tasking_error: 0x613ca0 const.aint_global_e: 0x613b00 (gdb) info exceptions const.aint All Ada exceptions matching regular expression "const.aint": constraint_error: 0x613da0 const.aint_global_e: 0x613b00
It is also possible to ask GDB to stop your program’s execution
when an exception is raised. For more details, see Set Catchpoints.
15.4.10.7 Extensions for Ada Tasks
Support for Ada tasks is analogous to that for threads (see Threads).
GDB provides the following task-related commands:
info tasks-
This command shows a list of current Ada tasks, as in the following example:
(gdb) info tasks ID TID P-ID Pri State Name 1 8088000 0 15 Child Activation Wait main_task 2 80a4000 1 15 Accept Statement b 3 809a800 1 15 Child Activation Wait a * 4 80ae800 3 15 Runnable c
In this listing, the asterisk before the last task indicates it to be the
task currently being inspected.- ID
-
Represents GDB’s internal task number.
- TID
-
The Ada task ID.
- P-ID
-
The parent’s task ID (GDB’s internal task number).
- Pri
-
The base priority of the task.
- State
-
Current state of the task.
Unactivated-
The task has been created but has not been activated. It cannot be
executing. Runnable-
The task is not blocked for any reason known to Ada. (It may be waiting
for a mutex, though.) It is conceptually «executing» in normal mode. Terminated-
The task is terminated, in the sense of ARM 9.3 (5). Any dependents
that were waiting on terminate alternatives have been awakened and have
terminated themselves. Child Activation Wait-
The task is waiting for created tasks to complete activation.
Accept or Select Term-
The task is waiting on an accept or selective wait statement.
Waiting on entry call-
The task is waiting on an entry call.
Async Select Wait-
The task is waiting to start the abortable part of an asynchronous
select statement. Delay Sleep-
The task is waiting on a select statement with only a delay
alternative open. Child Termination Wait-
The task is sleeping having completed a master within itself, and is
waiting for the tasks dependent on that master to become terminated or
waiting on a terminate Phase. Wait Child in Term Alt-
The task is sleeping waiting for tasks on terminate alternatives to
finish terminating. Asynchronous Hold-
The task has been held by
Ada.Asynchronous_Task_Control.Hold_Task. Activating-
The task has been created and is being made runnable.
Selective Wait-
The task is waiting in a selective wait statement.
Accepting RV with taskno-
The task is accepting a rendez-vous with the task taskno.
Waiting on RV with taskno-
The task is waiting for a rendez-vous with the task taskno.
- Name
-
Name of the task in the program.
info task taskno-
This command shows detailed informations on the specified task, as in
the following example:(gdb) info tasks ID TID P-ID Pri State Name 1 8077880 0 15 Child Activation Wait main_task * 2 807c468 1 15 Runnable task_1 (gdb) info task 2 Ada Task: 0x807c468 Name: "task_1" Thread: 0 LWP: 0x1fac Parent: 1 ("main_task") Base Priority: 15 State: Runnable task-
This command prints the ID and name of the current task.
(gdb) info tasks ID TID P-ID Pri State Name 1 8077870 0 15 Child Activation Wait main_task * 2 807c458 1 15 Runnable some_task (gdb) task [Current task is 2 "some_task"]
task taskno-
This command is like the
thread thread-id
command (see Threads). It switches the context of debugging
from the current task to the given task.(gdb) info tasks ID TID P-ID Pri State Name 1 8077870 0 15 Child Activation Wait main_task * 2 807c458 1 15 Runnable some_task (gdb) task 1 [Switching to task 1 "main_task"] #0 0x8067726 in pthread_cond_wait () (gdb) bt #0 0x8067726 in pthread_cond_wait () #1 0x8056714 in system.os_interface.pthread_cond_wait () #2 0x805cb63 in system.task_primitives.operations.sleep () #3 0x806153e in system.tasking.stages.activate_tasks () #4 0x804aacc in un () at un.adb:5
task apply [task-id-list | all] [flag]… command-
The
task applycommand is the Ada tasking analogue of
thread apply(see Threads). It allows you to apply the
named command to one or more tasks. Specify the tasks that you
want affected using a list of task IDs, or specifyallto apply
to all tasks.The flag arguments control what output to produce and how to
handle errors raised when applying command to a task.
flag must start with a-directly followed by one letter
inqcs. If several flags are provided, they must be given
individually, such as-c -q.By default, GDB displays some task information before the
output produced by command, and an error raised during the
execution of a command will aborttask apply. The
following flags can be used to fine-tune this behavior:-c-
The flag
-c, which stands for ‘continue’, causes any
errors in command to be displayed, and the execution of
task applythen continues. -s-
The flag
-s, which stands for ‘silent’, causes any errors
or empty output produced by a command to be silently ignored.
That is, the execution continues, but the task information and errors
are not printed. -q-
The flag
-q(‘quiet’) disables printing the task
information.
Flags
-cand-scannot be used together. break locspec task tasknobreak locspec task taskno if …-
These commands are like the
break … thread …
command (see Thread Stops). See Location Specifications, for
the various forms of locspec.Use the qualifier ‘task taskno’ with a breakpoint command
to specify that you only want GDB to stop the program when a
particular Ada task reaches this breakpoint. The taskno is one of the
numeric task identifiers assigned by GDB, shown in the first
column of the ‘info tasks’ display.If you do not specify ‘task taskno’ when you set a
breakpoint, the breakpoint applies to all tasks of your
program.You can use the
taskqualifier on conditional breakpoints as
well; in this case, place ‘task taskno’ before the
breakpoint condition (before theif).For example,
(gdb) info tasks ID TID P-ID Pri State Name 1 140022020 0 15 Child Activation Wait main_task 2 140045060 1 15 Accept/Select Wait t2 3 140044840 1 15 Runnable t1 * 4 140056040 1 15 Runnable t3 (gdb) b 15 task 2 Breakpoint 5 at 0x120044cb0: file test_task_debug.adb, line 15. (gdb) cont Continuing. task # 1 running task # 2 running Breakpoint 5, test_task_debug () at test_task_debug.adb:15 15 flush; (gdb) info tasks ID TID P-ID Pri State Name 1 140022020 0 15 Child Activation Wait main_task * 2 140045060 1 15 Runnable t2 3 140044840 1 15 Runnable t1 4 140056040 1 15 Delay Sleep t3
15.4.10.8 Tasking Support when Debugging Core Files
When inspecting a core file, as opposed to debugging a live program,
tasking support may be limited or even unavailable, depending on
the platform being used.
For instance, on x86-linux, the list of tasks is available, but task
switching is not supported.
On certain platforms, the debugger needs to perform some
memory writes in order to provide Ada tasking support. When inspecting
a core file, this means that the core file must be opened with read-write
privileges, using the command ‘«set write on»’ (see Patching).
Under these circumstances, you should make a backup copy of the core
file before inspecting it with GDB.
15.4.10.9 Tasking Support when using the Ravenscar Profile
The Ravenscar Profile is a subset of the Ada tasking features,
specifically designed for systems with safety-critical real-time
requirements.
set ravenscar task-switching on-
Allows task switching when debugging a program that uses the Ravenscar
Profile. This is the default. set ravenscar task-switching off-
Turn off task switching when debugging a program that uses the Ravenscar
Profile. This is mostly intended to disable the code that adds support
for the Ravenscar Profile, in case a bug in either GDB or in
the Ravenscar runtime is preventing GDB from working properly.
To be effective, this command should be run before the program is started. show ravenscar task-switching-
Show whether it is possible to switch from task to task in a program
using the Ravenscar Profile.
When Ravenscar task-switching is enabled, Ravenscar tasks are
announced by GDB as if they were threads:
(gdb) continue [New Ravenscar Thread 0x2b8f0]
Both Ravenscar tasks and the underlying CPU threads will show up in
the output of info threads:
(gdb) info threads Id Target Id Frame 1 Thread 1 (CPU#0 [running]) simple () at simple.adb:10 2 Thread 2 (CPU#1 [running]) 0x0000000000003d34 in __gnat_initialize_cpu_devices () 3 Thread 3 (CPU#2 [running]) 0x0000000000003d28 in __gnat_initialize_cpu_devices () 4 Thread 4 (CPU#3 [halted ]) 0x000000000000c6ec in system.task_primitives.operations.idle () * 5 Ravenscar Thread 0x2b8f0 simple () at simple.adb:10 6 Ravenscar Thread 0x2f150 0x000000000000c6ec in system.task_primitives.operations.idle ()
One known limitation of the Ravenscar support in GDB is that
it isn’t currently possible to single-step through the runtime
initialization sequence. If you need to debug this code, you should
use set ravenscar task-switching off.
15.4.10.10 Ada Source Character Set
The GNAT compiler supports a number of character sets for source
files. See (gnat_ugn)Character Set Control. GDB includes support for this as well.
set ada source-charset charset-
Set the source character set for Ada. The character set must be
supported by GNAT. Because this setting affects the decoding of
symbols coming from the debug information in your program, the setting
should be set as early as possible. The default isISO-8859-1,
because that is also GNAT’s default. show ada source-charset-
Show the current source character set for Ada.
15.4.10.11 Known Peculiarities of Ada Mode
Besides the omissions listed previously (see Omissions from Ada),
we know of several problems with and limitations of Ada mode in
GDB,
some of which will be fixed with planned future releases of the debugger
and the GNU Ada compiler.
- Static constants that the compiler chooses not to materialize as objects in
storage are invisible to the debugger. - Named parameter associations in function argument lists are ignored (the
argument lists are treated as positional). - Many useful library packages are currently invisible to the debugger.
- Fixed-point arithmetic, conversions, input, and output is carried out using
floating-point arithmetic, and may give results that only approximate those on
the host machine. - The GNAT compiler never generates the prefix
Standardfor any of
the standard symbols defined by the Ada language. GDB knows about
this: it will strip the prefix from names when you use it, and will never
look for a name you have so qualified among local symbols, nor match against
symbols in other packages or subprograms. If you have
defined entities anywhere in your program other than parameters and
local variables whose simple names match names inStandard,
GNAT’s lack of qualification here can cause confusion. When this happens,
you can usually resolve the confusion
by qualifying the problematic names with package
Standardexplicitly.
Older versions of the compiler sometimes generate erroneous debugging
information, resulting in the debugger incorrectly printing the value
of affected entities. In some cases, the debugger is able to work
around an issue automatically. In other cases, the debugger is able
to work around the issue, but the work-around has to be specifically
enabled.
set ada trust-PAD-over-XVS on-
Configure GDB to strictly follow the GNAT encoding when computing the
value of Ada entities, particularly whenPADandPAD___XVS
types are involved (seeada/exp_dbug.adsin the GCC sources for
a complete description of the encoding used by the GNAT compiler).
This is the default. set ada trust-PAD-over-XVS off-
This is related to the encoding using by the GNAT compiler. If GDB
sometimes prints the wrong value for certain entities, changingadato
trust-PAD-over-XVSoffactivates a work-around which may fix
the issue. It is always safe to setada trust-PAD-over-XVSto
off, but this incurs a slight performance penalty, so it is
recommended to leave this setting toonunless necessary.
Internally, the debugger also relies on the compiler following a number
of conventions known as the ‘GNAT Encoding’, all documented in
gcc/ada/exp_dbug.ads in the GCC sources. This encoding describes
how the debugging information should be generated for certain types.
In particular, this convention makes use of descriptive types,
which are artificial types generated purely to help the debugger.
These encodings were defined at a time when the debugging information
format used was not powerful enough to describe some of the more complex
types available in Ada. Since DWARF allows us to express nearly all
Ada features, the long-term goal is to slowly replace these descriptive
types by their pure DWARF equivalent. To facilitate that transition,
a new maintenance option is available to force the debugger to ignore
those descriptive types. It allows the user to quickly evaluate how
well GDB works without them.
maintenance ada set ignore-descriptive-types [on|off]-
Control whether the debugger should ignore descriptive types.
The default is not to ignore descriptives types (off). maintenance ada show ignore-descriptive-types-
Show if descriptive types are ignored by GDB.
15.5 Unsupported Languages
In addition to the other fully-supported programming languages,
GDB also provides a pseudo-language, called minimal.
It does not represent a real programming language, but provides a set
of capabilities close to what the C or assembly languages provide.
This should allow most simple operations to be performed while debugging
an application that uses a language currently not supported by GDB.
If the language is set to auto, GDB will automatically
select this language if the current frame corresponds to an unsupported
language.
16 Examining the Symbol Table
The commands described in this chapter allow you to inquire about the
symbols (names of variables, functions and types) defined in your
program. This information is inherent in the text of your program and
does not change as your program executes. GDB finds it in your
program’s symbol table, in the file indicated when you started GDB
(see Choosing Files), or by one of the
file-management commands (see Commands to Specify Files).
Occasionally, you may need to refer to symbols that contain unusual
characters, which GDB ordinarily treats as word delimiters. The
most frequent case is in referring to static variables in other
source files (see Program Variables). File names
are recorded in object files as debugging symbols, but GDB would
ordinarily parse a typical file name, like foo.c, as the three words
‘foo’ ‘.’ ‘c’. To allow GDB to recognize
‘foo.c’ as a single symbol, enclose it in single quotes; for example,
looks up the value of x in the scope of the file foo.c.
set case-sensitive onset case-sensitive offset case-sensitive auto-
Normally, when GDB looks up symbols, it matches their names
with case sensitivity determined by the current source language.
Occasionally, you may wish to control that. The commandsetlets you do that by specifying
case-sensitiveonfor
case-sensitive matches orofffor case-insensitive ones. If
you specifyauto, case sensitivity is reset to the default
suitable for the source language. The default is case-sensitive
matches for all languages except for Fortran, for which the default is
case-insensitive matches. show case-sensitive-
This command shows the current setting of case sensitivity for symbols
lookups. set print type methodsset print type methods onset print type methods off-
Normally, when GDB prints a class, it displays any methods
declared in that class. You can control this behavior either by
passing the appropriate flag toptype, or usingset. Specifying
print type methodsonwill cause GDB to
display the methods; this is the default. Specifyingoffwill
cause GDB to omit the methods. show print type methods-
This command shows the current setting of method display when printing
classes. set print type nested-type-limit limitset print type nested-type-limit unlimited-
Set the limit of displayed nested types that the type printer will
show. A limit ofunlimitedor-1will show all
nested definitions. By default, the type printer will not show any nested
types defined in classes. show print type nested-type-limit-
This command shows the current display limit of nested types when
printing classes. set print type typedefsset print type typedefs onset print type typedefs off-
Normally, when GDB prints a class, it displays any typedefs
defined in that class. You can control this behavior either by
passing the appropriate flag toptype, or usingset. Specifying
print type typedefsonwill cause GDB to
display the typedef definitions; this is the default. Specifying
offwill cause GDB to omit the typedef definitions.
Note that this controls whether the typedef definition itself is
printed, not whether typedef names are substituted when printing other
types. show print type typedefs-
This command shows the current setting of typedef display when
printing classes. set print type hexset print type hex onset print type hex off-
When GDB prints sizes and offsets of struct members, it can use
either the decimal or hexadecimal notation. You can select one or the
other either by passing the appropriate flag toptype, or by using
theset print type hexcommand. show print type hex-
This command shows whether the sizes and offsets of struct members are
printed in decimal or hexadecimal notation. info address symbol-
Describe where the data for symbol is stored. For a register
variable, this says which register it is kept in. For a non-register
local variable, this prints the stack-frame offset at which the variable
is always stored.Note the contrast with ‘print &symbol’, which does not work
at all for a register variable, and for a stack local variable prints
the exact address of the current instantiation of the variable. info symbol addr-
Print the name of a symbol which is stored at the address addr.
If no symbol is stored exactly at addr, GDB prints the
nearest symbol and an offset from it:(gdb) info symbol 0x54320 _initialize_vx + 396 in section .text
This is the opposite of the
info addresscommand. You can use
it to find out the name of a variable or a function given its address.For dynamically linked executables, the name of executable or shared
library containing the symbol is also printed:(gdb) info symbol 0x400225 _start + 5 in section .text of /tmp/a.out (gdb) info symbol 0x2aaaac2811cf __read_nocancel + 6 in section .text of /usr/lib64/libc.so.6
demangle [-l language] [--] name-
Demangle name.
If language is provided it is the name of the language to demangle
name in. Otherwise name is demangled in the current language.The ‘—’ option specifies the end of options,
and is useful when name begins with a dash.The parameter
demangle-stylespecifies how to interpret the kind
of mangling used. See Print Settings. whatis[/flags] [arg]-
Print the data type of arg, which can be either an expression
or a name of a data type. With no argument, print the data type of
$, the last value in the value history.If arg is an expression (see Expressions), it
is not actually evaluated, and any side-effecting operations (such as
assignments or function calls) inside it do not take place.If arg is a variable or an expression,
whatisprints its
literal type as it is used in the source code. If the type was
defined using atypedef,whatiswill not print
the data type underlying thetypedef. If the type of the
variable or the expression is a compound data type, such as
structorclass,whatisnever prints their
fields or methods. It just prints thestruct/class
name (a.k.a. its tag). If you want to see the members of
such a compound data type, useptype.If arg is a type name that was defined using
typedef,
whatisunrolls only one level of thattypedef.
Unrolling means thatwhatiswill show the underlying type used
in thetypedefdeclaration of arg. However, if that
underlying type is also atypedef,whatiswill not
unroll it.For C code, the type names may also have the form ‘class
class-name’, ‘struct struct-tag’, ‘union
union-tag’ or ‘enum enum-tag’.flags can be used to modify how the type is displayed.
Available flags are:r-
Display in “raw” form. Normally, GDB substitutes template
parameters and typedefs defined in a class when printing the class’
members. The/rflag disables this. m-
Do not print methods defined in the class.
M-
Print methods defined in the class. This is the default, but the flag
exists in case you change the default withset print type methods. t-
Do not print typedefs defined in the class. Note that this controls
whether the typedef definition itself is printed, not whether typedef
names are substituted when printing other types. T-
Print typedefs defined in the class. This is the default, but the flag
exists in case you change the default withset print type typedefs. o-
Print the offsets and sizes of fields in a struct, similar to what the
paholetool does. This option implies the/tmflags. x-
Use hexadecimal notation when printing offsets and sizes of fields in a
struct. d-
Use decimal notation when printing offsets and sizes of fields in a
struct.For example, given the following declarations:
struct tuv { int a1; char *a2; int a3; }; struct xyz { int f1; char f2; void *f3; struct tuv f4; }; union qwe { struct tuv fff1; struct xyz fff2; }; struct tyu { int a1 : 1; int a2 : 3; int a3 : 23; char a4 : 2; int64_t a5; int a6 : 5; int64_t a7 : 3; };Issuing a ptype /o struct tuv command would print:
(gdb) ptype /o struct tuv /* offset | size */ type = struct tuv { /* 0 | 4 */ int a1; /* XXX 4-byte hole */ /* 8 | 8 */ char *a2; /* 16 | 4 */ int a3; /* total size (bytes): 24 */ }Notice the format of the first column of comments. There, you can
find two parts separated by the ‘|’ character: the offset,
which indicates where the field is located inside the struct, in
bytes, and the size of the field. Another interesting line is
the marker of a hole in the struct, indicating that it may be
possible to pack the struct and make it use less space by reorganizing
its fields.It is also possible to print offsets inside an union:
(gdb) ptype /o union qwe /* offset | size */ type = union qwe { /* 24 */ struct tuv { /* 0 | 4 */ int a1; /* XXX 4-byte hole */ /* 8 | 8 */ char *a2; /* 16 | 4 */ int a3; /* total size (bytes): 24 */ } fff1; /* 40 */ struct xyz { /* 0 | 4 */ int f1; /* 4 | 1 */ char f2; /* XXX 3-byte hole */ /* 8 | 8 */ void *f3; /* 16 | 24 */ struct tuv { /* 16 | 4 */ int a1; /* XXX 4-byte hole */ /* 24 | 8 */ char *a2; /* 32 | 4 */ int a3; /* total size (bytes): 24 */ } f4; /* total size (bytes): 40 */ } fff2; /* total size (bytes): 40 */ }In this case, since
struct tuvandstruct xyzoccupy the
same space (because we are dealing with an union), the offset is not
printed for them. However, you can still examine the offset of each
of these structures’ fields.Another useful scenario is printing the offsets of a struct containing
bitfields:(gdb) ptype /o struct tyu /* offset | size */ type = struct tyu { /* 0:31 | 4 */ int a1 : 1; /* 0:28 | 4 */ int a2 : 3; /* 0: 5 | 4 */ int a3 : 23; /* 3: 3 | 1 */ signed char a4 : 2; /* XXX 3-bit hole */ /* XXX 4-byte hole */ /* 8 | 8 */ int64_t a5; /* 16: 0 | 4 */ int a6 : 5; /* 16: 5 | 8 */ int64_t a7 : 3; /* XXX 7-byte padding */ /* total size (bytes): 24 */ }Note how the offset information is now extended to also include the
first bit of the bitfield.
ptype[/flags] [arg]-
ptypeaccepts the same arguments aswhatis, but prints a
detailed description of the type, instead of just the name of the type.
See Expressions.Contrary to
whatis,ptypealways unrolls any
typedefs in its argument declaration, whether the argument is
a variable, expression, or a data type. This means thatptype
of a variable or an expression will not print literally its type as
present in the source code—usewhatisfor that.typedefs at
the pointer or reference targets are also unrolled. Onlytypedefs of
fields, methods and innerclass typedefs ofstructs,
classes andunions are not unrolled even withptype.For example, for this variable declaration:
typedef double real_t; struct complex { real_t real; double imag; }; typedef struct complex complex_t; complex_t var; real_t *real_pointer_var;the two commands give this output:
(gdb) whatis var type = complex_t (gdb) ptype var type = struct complex { real_t real; double imag; } (gdb) whatis complex_t type = struct complex (gdb) whatis struct complex type = struct complex (gdb) ptype struct complex type = struct complex { real_t real; double imag; } (gdb) whatis real_pointer_var type = real_t * (gdb) ptype real_pointer_var type = double *As with
whatis, usingptypewithout an argument refers to
the type of$, the last value in the value history.Sometimes, programs use opaque data types or incomplete specifications
of complex data structure. If the debug information included in the
program does not allow GDB to display a full declaration of
the data type, it will say ‘<incomplete type>’. For example,
given these declarations:struct foo; struct foo *fooptr;but no definition for
struct fooitself, GDB will say:(gdb) ptype foo $1 = <incomplete type>
“Incomplete type” is C terminology for data types that are not
completely specified.Othertimes, information about a variable’s type is completely absent
from the debug information included in the program. This most often
happens when the program or library where the variable is defined
includes no debug information at all. GDB knows the variable
exists from inspecting the linker/loader symbol table (e.g., the ELF
dynamic symbol table), but such symbols do not contain type
information. Inspecting the type of a (global) variable for which
GDB has no type information shows:(gdb) ptype var type = <data variable, no debug info>
See no debug info variables, for how to print the values
of such variables. info types [-q] [regexp]-
Print a brief description of all types whose names match the regular
expression regexp (or all types in your program, if you supply
no argument). Each complete typename is matched as though it were a
complete line; thus, ‘i type value’ gives information on all
types in your program whose names include the stringvalue, but
‘i type ^value$’ gives information only on types whose complete
name isvalue.In programs using different languages, GDB chooses the syntax
to print the type description according to the
‘set language’ value: using ‘set language auto’
(see Set Language Automatically) means to use the
language of the type, other values mean to use
the manually specified language (see Set Language Manually).This command differs from
ptypein two ways: first, like
whatis, it does not print a detailed description; second, it
lists all source files and line numbers where a type is defined.The output from ‘into types’ is proceeded with a header line
describing what types are being listed. The optional flag ‘-q’,
which stands for ‘quiet’, disables printing this header
information. info type-printers-
Versions of GDB that ship with Python scripting enabled may
have “type printers” available. When usingptypeor
whatis, these printers are consulted when the name of a type
is needed. See Type Printing API, for more information on writing
type printers.info type-printersdisplays all the available type printers. enable type-printer name…disable type-printer name…-
These commands can be used to enable or disable type printers.
info scope locspec-
List all the variables local to the lexical scope of the code location
that results from resolving locspec. See Location Specifications, for details about supported forms of locspec.
For example:(gdb) info scope command_line_handler Scope for command_line_handler: Symbol rl is an argument at stack/frame offset 8, length 4. Symbol linebuffer is in static storage at address 0x150a18, length 4. Symbol linelength is in static storage at address 0x150a1c, length 4. Symbol p is a local variable in register $esi, length 4. Symbol p1 is a local variable in register $ebx, length 4. Symbol nline is a local variable in register $edx, length 4. Symbol repeat is a local variable at frame offset -8, length 4.
This command is especially useful for determining what data to collect
during a trace experiment, see collect. info source-
Show information about the current source file—that is, the source file for
the function containing the current point of execution:- the name of the source file, and the directory containing it,
- the directory it was compiled in,
- its length, in lines,
- which programming language it is written in,
- if the debug information provides it, the program that compiled the file
(which may include, e.g., the compiler version and command line arguments), - whether the executable includes debugging information for that file, and
if so, what format the information is in (e.g., STABS, Dwarf 2, etc.), and - whether the debugging information includes information about
preprocessor macros.
info sources [-dirname | -basename] [--] [regexp]-
With no options ‘info sources’ prints the names of all source
files in your program for which there is debugging information. The
source files are presented based on a list of object files
(executables and libraries) currently loaded into GDB. For
each object file all of the associated source files are listed.Each source file will only be printed once for each object file, but a
single source file can be repeated in the output if it is part of
multiple object files.If the optional regexp is provided, then only source files that
match the regular expression will be printed. The matching is
case-sensitive, except on operating systems that have case-insensitive
filesystem (e.g., MS-Windows). ‘—’ can be used before
regexp to prevent GDB interpreting regexp as a
command option (e.g. if regexp starts with ‘—’).By default, the regexp is used to match anywhere in the
filename. If-dirname, only files having a dirname matching
regexp are shown. If-basename, only files having a
basename matching regexp are shown.It is possible that an object file may be printed in the list with no
associated source files. This can happen when either no source files
match regexp, or, the object file was compiled without debug
information and so GDB is unable to find any source file
names. info functions [-q] [-n]-
Print the names and data types of all defined functions.
Similarly to ‘info types’, this command groups its output by source
files and annotates each function definition with its source line
number.In programs using different languages, GDB chooses the syntax
to print the function name and type according to the
‘set language’ value: using ‘set language auto’
(see Set Language Automatically) means to use the
language of the function, other values mean to use
the manually specified language (see Set Language Manually).The ‘-n’ flag excludes non-debugging symbols from the
results. A non-debugging symbol is a symbol that comes from the
executable’s symbol table, not from the debug information (for
example, DWARF) associated with the executable.The optional flag ‘-q’, which stands for ‘quiet’, disables
printing header information and messages explaining why no functions
have been printed. info functions [-q] [-n] [-t type_regexp] [regexp]-
Like ‘info functions’, but only print the names and data types
of the functions selected with the provided regexp(s).If regexp is provided, print only the functions whose names
match the regular expression regexp.
Thus, ‘info fun step’ finds all functions whose
names includestep; ‘info fun ^step’ finds those whose names
start withstep. If a function name contains characters that
conflict with the regular expression language (e.g.
‘operator*()’), they may be quoted with a backslash.If type_regexp is provided, print only the functions whose
types, as printed by thewhatiscommand, match
the regular expression type_regexp.
If type_regexp contains space(s), it should be enclosed in
quote characters. If needed, use backslash to escape the meaning
of special characters or quotes.
Thus, ‘info fun -t ‘^int (‘’ finds the functions that return
an integer; ‘info fun -t ‘(.*int.*’’ finds the functions that
have an argument type containing int; ‘info fun -t ‘^int (‘ ^step’
finds the functions whose names start withstepand that return
int.If both regexp and type_regexp are provided, a function
is printed only if its name matches regexp and its type matches
type_regexp. info variables [-q] [-n]-
Print the names and data types of all variables that are defined
outside of functions (i.e. excluding local variables).
The printed variables are grouped by source files and annotated with
their respective source line numbers.In programs using different languages, GDB chooses the syntax
to print the variable name and type according to the
‘set language’ value: using ‘set language auto’
(see Set Language Automatically) means to use the
language of the variable, other values mean to use
the manually specified language (see Set Language Manually).The ‘-n’ flag excludes non-debugging symbols from the results.
The optional flag ‘-q’, which stands for ‘quiet’, disables
printing header information and messages explaining why no variables
have been printed. info variables [-q] [-n] [-t type_regexp] [regexp]-
Like info variables, but only print the variables selected
with the provided regexp(s).If regexp is provided, print only the variables whose names
match the regular expression regexp.If type_regexp is provided, print only the variables whose
types, as printed by thewhatiscommand, match
the regular expression type_regexp.
If type_regexp contains space(s), it should be enclosed in
quote characters. If needed, use backslash to escape the meaning
of special characters or quotes.If both regexp and type_regexp are provided, an argument
is printed only if its name matches regexp and its type matches
type_regexp. info modules [-q] [regexp]-
List all Fortran modules in the program, or all modules matching the
optional regular expression regexp.The optional flag ‘-q’, which stands for ‘quiet’, disables
printing header information and messages explaining why no modules
have been printed. info module functions [-q] [-m module-regexp] [-t type-regexp] [regexp]info module variables [-q] [-m module-regexp] [-t type-regexp] [regexp]-
List all functions or variables within all Fortran modules. The set
of functions or variables listed can be limited by providing some or
all of the optional regular expressions. If module-regexp is
provided, then only Fortran modules matching module-regexp will
be searched. Only functions or variables whose type matches the
optional regular expression type-regexp will be listed. And
only functions or variables whose name matches the optional regular
expression regexp will be listed.The optional flag ‘-q’, which stands for ‘quiet’, disables
printing header information and messages explaining why no functions
or variables have been printed. info classesinfo classes regexp-
Display all Objective-C classes in your program, or
(with the regexp argument) all those matching a particular regular
expression. info selectorsinfo selectors regexp-
Display all Objective-C selectors in your program, or
(with the regexp argument) all those matching a particular regular
expression. set opaque-type-resolution on-
Tell GDB to resolve opaque types. An opaque type is a type
declared as a pointer to astruct,class, or
union—for example,struct MyType *—that is used in one
source file although the full declaration ofstruct MyTypeis in
another source file. The default is on.A change in the setting of this subcommand will not take effect until
the next time symbols for a file are loaded. set opaque-type-resolution off-
Tell GDB not to resolve opaque types. In this case, the type
is printed as follows: show opaque-type-resolution-
Show whether opaque types are resolved or not.
set print symbol-loadingset print symbol-loading fullset print symbol-loading briefset print symbol-loading off-
The
set print symbol-loadingcommand allows you to control the
printing of messages when GDB loads symbol information.
By default a message is printed for the executable and one for each
shared library, and normally this is what you want. However, when
debugging apps with large numbers of shared libraries these messages
can be annoying.
When set tobriefa message is printed for each executable,
and when GDB loads a collection of shared libraries at once
it will only print one message regardless of the number of shared
libraries. When set tooffno messages are printed. show print symbol-loading-
Show whether messages will be printed when a GDB command
entered from the keyboard causes symbol information to be loaded. maint print symbols [-pc address] [filename]maint print symbols [-objfile objfile] [-source source] [--] [filename]maint print psymbols [-objfile objfile] [-pc address] [--] [filename]maint print psymbols [-objfile objfile] [-source source] [--] [filename]maint print msymbols [-objfile objfile] [--] [filename]-
Write a dump of debugging symbol data into the file filename or
the terminal if filename is unspecified.
If-objfile objfileis specified, only dump symbols for
that objfile.
If-pc addressis specified, only dump symbols for the file
with code at that address. Note that address may be a symbol like
main.
If-source sourceis specified, only dump symbols for that
source file.These commands are used to debug the GDB symbol-reading code.
These commands do not modify internal GDB state, therefore
‘maint print symbols’ will only print symbols for already expanded symbol
tables.
You can use the commandinfo sourcesto find out which files these are.
If you use ‘maint print psymbols’ instead, the dump shows information
about symbols that GDB only knows partially—that is, symbols
defined in files that GDB has skimmed, but not yet read completely.
Finally, ‘maint print msymbols’ just dumps “minimal symbols”, e.g.,
“ELF symbols”.See Commands to Specify Files, for a discussion of how
GDB reads symbols (in the description ofsymbol-file). maint info symtabs [ regexp ]maint info psymtabs [ regexp ]-
List the
struct symtaborstruct partial_symtab
structures whose names match regexp. If regexp is not
given, list them all. The output includes expressions which you can
copy into a GDB debugging this one to examine a particular
structure in more detail. For example:(gdb) maint info psymtabs dwarf2read { objfile /home/gnu/build/gdb/gdb ((struct objfile *) 0x82e69d0) { psymtab /home/gnu/src/gdb/dwarf2read.c ((struct partial_symtab *) 0x8474b10) readin no fullname (null) text addresses 0x814d3c8 -- 0x8158074 globals (* (struct partial_symbol **) 0x8507a08 @ 9) statics (* (struct partial_symbol **) 0x40e95b78 @ 2882) dependencies (none) } } (gdb) maint info symtabs (gdb)We see that there is one partial symbol table whose filename contains
the string ‘dwarf2read’, belonging to the ‘gdb’ executable;
and we see that GDB has not read in any symtabs yet at all.
If we set a breakpoint on a function, that will cause GDB to
read the symtab for the compilation unit containing that function:(gdb) break dwarf2_psymtab_to_symtab Breakpoint 1 at 0x814e5da: file /home/gnu/src/gdb/dwarf2read.c, line 1574. (gdb) maint info symtabs { objfile /home/gnu/build/gdb/gdb ((struct objfile *) 0x82e69d0) { symtab /home/gnu/src/gdb/dwarf2read.c ((struct symtab *) 0x86c1f38) dirname (null) fullname (null) blockvector ((struct blockvector *) 0x86c1bd0) (primary) linetable ((struct linetable *) 0x8370fa0) debugformat DWARF 2 } } (gdb) maint info line-table [ regexp ]-
List the
struct linetablefrom allstruct symtab
instances whose name matches regexp. If regexp is not
given, list thestruct linetablefrom allstruct symtab.
For example:(gdb) maint info line-table objfile: /home/gnu/build/a.out ((struct objfile *) 0x6120000e0d40) compunit_symtab: simple.cpp ((struct compunit_symtab *) 0x6210000ff450) symtab: /home/gnu/src/simple.cpp ((struct symtab *) 0x6210000ff4d0) linetable: ((struct linetable *) 0x62100012b760): INDEX LINE ADDRESS IS-STMT PROLOGUE-END 0 3 0x0000000000401110 Y 1 4 0x0000000000401114 Y Y 2 9 0x0000000000401120 Y 3 10 0x0000000000401124 Y Y 4 10 0x0000000000401129 5 15 0x0000000000401130 Y 6 16 0x0000000000401134 Y Y 7 16 0x0000000000401139 8 21 0x0000000000401140 Y 9 22 0x000000000040114f Y Y 10 22 0x0000000000401154 11 END 0x000000000040115a Y
The ‘IS-STMT’ column indicates if the address is a recommended breakpoint
location to represent a line or a statement. The ‘PROLOGUE-END’ column
indicates that a given address is an adequate place to set a breakpoint at the
first instruction following a function prologue. maint set symbol-cache-size size-
Set the size of the symbol cache to size.
The default size is intended to be good enough for debugging
most applications. This option exists to allow for experimenting
with different sizes. maint show symbol-cache-size-
Show the size of the symbol cache.
maint print symbol-cache-
Print the contents of the symbol cache.
This is useful when debugging symbol cache issues. maint print symbol-cache-statistics-
Print symbol cache usage statistics.
This helps determine how well the cache is being utilized. maint flush symbol-cachemaint flush-symbol-cache-
Flush the contents of the symbol cache, all entries are removed. This
command is useful when debugging the symbol cache. It is also useful
when collecting performance data. The commandmaintis deprecated in favor of
flush-symbol-cachemaint flush..
symbol-cache maint set ignore-prologue-end-flag [on|off]-
Enable or disable the use of the ‘PROLOGUE-END’ flag from the line-table.
When ‘off’ (the default), GDB uses the ‘PROLOGUE-END’ flag
to place breakpoints past the end of a function prologue. When ‘on’,
GDB ignores the flag and relies on prologue analyzers to skip function
prologues. maint show ignore-prologue-end-flag-
Show whether GDB will ignore the ‘PROLOGUE-END’ flag.
17 Altering Execution
Once you think you have found an error in your program, you might want to
find out for certain whether correcting the apparent error would lead to
correct results in the rest of the run. You can find the answer by
experiment, using the GDB features for altering execution of the
program.
For example, you can store new values into variables or memory
locations, give your program a signal, restart it at a different
address, or even return prematurely from a function.
17.1 Assignment to Variables
To alter the value of a variable, evaluate an assignment expression.
See Expressions. For example,
stores the value 4 into the variable x, and then prints the
value of the assignment expression (which is 4).
See Using GDB with Different Languages, for more
information on operators in supported languages.
If you are not interested in seeing the value of the assignment, use the
set command instead of the print command. set is
really the same as print except that the expression’s value is
not printed and is not put in the value history (see Value History). The expression is evaluated only for its effects.
If the beginning of the argument string of the set command
appears identical to a set subcommand, use the set command instead of just
variableset. This command is identical
to set except for its lack of subcommands. For example, if your
program has a variable width, you get an error if you try to set
a new value with just ‘set width=13’, because GDB has the
command set width:
(gdb) whatis width type = double (gdb) p width $4 = 13 (gdb) set width=47 Invalid syntax in expression.
The invalid expression, of course, is ‘=47’. In
order to actually set the program’s variable width, use
Because the set command has many subcommands that can conflict
with the names of program variables, it is a good idea to use the
set variable command instead of just set. For example, if
your program has a variable g, you run into problems if you try
to set a new value with just ‘set g=4’, because GDB has
the command set gnutarget, abbreviated set g:
(gdb) whatis g
type = double
(gdb) p g
$1 = 1
(gdb) set g=4
(gdb) p g
$2 = 1
(gdb) r
The program being debugged has been started already.
Start it from the beginning? (y or n) y
Starting program: /home/smith/cc_progs/a.out
"/home/smith/cc_progs/a.out": can't open to read symbols:
Invalid bfd target.
(gdb) show g
The current BFD target is "=4".
The program variable g did not change, and you silently set the
gnutarget to an invalid value. In order to set the variable
g, use
GDB allows more implicit conversions in assignments than C; you can
freely store an integer value into a pointer variable or vice versa,
and you can convert any structure to any other structure that is the
same length or shorter.
To store values into arbitrary places in memory, use the ‘{…}’
construct to generate a value of specified type at a specified address
(see Expressions). For example, {int}0x83040 refers
to memory location 0x83040 as an integer (which implies a certain size
and representation in memory), and
stores the value 4 into that memory location.
17.2 Continuing at a Different Address
Ordinarily, when you continue your program, you do so at the place where
it stopped, with the continue command. You can instead continue at
an address of your own choosing, with the following commands:
jump locspecj locspec-
Resume execution at the address of the code location that results from
resolving locspec.
See Location Specifications, for a description of the different
forms of locspec. If locspec resolves to more than one
address, the command aborts before jumping.
Execution stops again immediately if there is a breakpoint there. It
is common practice to use thetbreakcommand in conjunction
withjump. See Setting Breakpoints.The
jumpcommand does not change the current stack frame, or
the stack pointer, or the contents of any memory location or any
register other than the program counter. If locspec resolves to
an address in a different function from the one currently executing, the
results may be bizarre if the two functions expect different patterns
of arguments or of local variables. For this reason, thejump
command requests confirmation if the jump address is not in the
function currently executing. However, even bizarre results are
predictable if you are well acquainted with the machine-language code
of your program.
On many systems, you can get much the same effect as the jump
command by storing a new value into the register $pc. The
difference is that this does not start your program running; it only
changes the address of where it will run when you continue. For
example,
makes the next continue command or stepping command execute at
address 0x485, rather than at the address where your program stopped.
See Continuing and Stepping.
The most common occasion to use the jump command is to back
up—perhaps with more breakpoints set—over a portion of a program
that has already executed, in order to examine its execution in more
detail.
17.3 Giving your Program a Signal
signal signal-
Resume execution where your program is stopped, but immediately give it the
signal signal. The signal can be the name or the number of a
signal. For example, on many systemssignal 2andsignalare both ways of sending an interrupt signal.
SIGINTAlternatively, if signal is zero, continue execution without
giving a signal. This is useful when your program stopped on account of
a signal and would ordinarily see the signal when resumed with the
continuecommand; ‘signal 0’ causes it to resume without a
signal.Note: When resuming a multi-threaded program, signal is
delivered to the currently selected thread, not the thread that last
reported a stop. This includes the situation where a thread was
stopped due to a signal. So if you want to continue execution
suppressing the signal that stopped a thread, you should select that
same thread before issuing the ‘signal 0’ command. If you issue
the ‘signal 0’ command with another thread as the selected one,
GDB detects that and asks for confirmation.Invoking the
signalcommand is not the same as invoking the
killutility from the shell. Sending a signal withkill
causes GDB to decide what to do with the signal depending on
the signal handling tables (see Signals). Thesignalcommand
passes the signal directly to your program.signaldoes not repeat when you press RET a second time
after executing the command. queue-signal signal-
Queue signal to be delivered immediately to the current thread
when execution of the thread resumes. The signal can be the name or
the number of a signal. For example, on many systemssignal 2and
signal SIGINTare both ways of sending an interrupt signal.
The handling of the signal must be set to pass the signal to the program,
otherwise GDB will report an error.
You can control the handling of signals from GDB with the
handlecommand (see Signals).Alternatively, if signal is zero, any currently queued signal
for the current thread is discarded and when execution resumes no signal
will be delivered. This is useful when your program stopped on account
of a signal and would ordinarily see the signal when resumed with the
continuecommand.This command differs from the
signalcommand in that the signal
is just queued, execution is not resumed. Andqueue-signalcannot
be used to pass a signal whose handling state has been set tonopass
(see Signals).
See stepping into signal handlers, for information on how stepping
commands behave when the thread has a signal queued.
17.4 Returning from a Function
returnreturn expression-
You can cancel execution of a function call with the
return
command. If you give an
expression argument, its value is used as the function’s return
value.
When you use return, GDB discards the selected stack frame
(and all frames within it). You can think of this as making the
discarded frame return prematurely. If you wish to specify a value to
be returned, give that value as the argument to return.
This pops the selected stack frame (see Selecting a
Frame), and any other frames inside of it, leaving its caller as the
innermost remaining frame. That frame becomes selected. The
specified value is stored in the registers used for returning values
of functions.
The return command does not resume execution; it leaves the
program stopped in the state that would exist if the function had just
returned. In contrast, the finish command (see Continuing and Stepping) resumes execution until the
selected stack frame returns naturally.
GDB needs to know how the expression argument should be set for
the inferior. The concrete registers assignment depends on the OS ABI and the
type being returned by the selected stack frame. For example it is common for
OS ABI to return floating point values in FPU registers while integer values in
CPU registers. Still some ABIs return even floating point values in CPU
registers. Larger integer widths (such as long long int) also have
specific placement rules. GDB already knows the OS ABI from its
current target so it needs to find out also the type being returned to make the
assignment into the right register(s).
Normally, the selected stack frame has debug info. GDB will always
use the debug info instead of the implicit type of expression when the
debug info is available. For example, if you type return -1, and the
function in the current stack frame is declared to return a long long, GDB transparently converts the implicit
intint value of -1
into a long long int:
Breakpoint 1, func () at gdb.base/return-nodebug.c:29
29 return 31;
(gdb) return -1
Make func return now? (y or n) y
#0 0x004004f6 in main () at gdb.base/return-nodebug.c:43
43 printf ("result=%lldn", func ());
(gdb)
However, if the selected stack frame does not have a debug info, e.g., if the
function was compiled without debug info, GDB has to find out the type
to return from user. Specifying a different type by mistake may set the value
in different inferior registers than the caller code expects. For example,
typing return -1 with its implicit type int would set only a part
of a long long int result for a debug info less function (on 32-bit
architectures). Therefore the user is required to specify the return type by
an appropriate cast explicitly:
Breakpoint 2, 0x0040050b in func () (gdb) return -1 Return value type not available for selected stack frame. Please use an explicit cast of the value to return. (gdb) return (long long int) -1 Make selected stack frame return now? (y or n) y #0 0x00400526 in main () (gdb)
17.5 Calling Program Functions
print expr-
Evaluate the expression expr and display the resulting value.
The expression may include calls to functions in the program being
debugged. call expr-
Evaluate the expression expr without displaying
void
returned values.You can use this variant of the
printcommand if you want to
execute a function from your program that does not return anything
(a.k.a. a void function), but without cluttering the output
withvoidreturned values that GDB will otherwise
print. If the result is not void, it is printed and saved in the
value history.
It is possible for the function you call via the print or
call command to generate a signal (e.g., if there’s a bug in
the function, or if you passed it incorrect arguments). What happens
in that case is controlled by the set unwindonsignal command.
Similarly, with a C++ program it is possible for the function you
call via the print or call command to generate an
exception that is not handled due to the constraints of the dummy
frame. In this case, any exception that is raised in the frame, but has
an out-of-frame exception handler will not be found. GDB builds a
dummy-frame for the inferior function call, and the unwinder cannot
seek for exception handlers outside of this dummy-frame. What happens
in that case is controlled by the
set unwind-on-terminating-exception command.
set unwindonsignal-
Set unwinding of the stack if a signal is received while in a function
that GDB called in the program being debugged. If set to on,
GDB unwinds the stack it created for the call and restores
the context to what it was before the call. If set to off (the
default), GDB stops in the frame where the signal was
received. show unwindonsignal-
Show the current setting of stack unwinding in the functions called by
GDB. set unwind-on-terminating-exception-
Set unwinding of the stack if a C++ exception is raised, but left
unhandled while in a function that GDB called in the program being
debugged. If set to on (the default), GDB unwinds the stack
it created for the call and restores the context to what it was before
the call. If set to off, GDB the exception is delivered to
the default C++ exception handler and the inferior terminated. show unwind-on-terminating-exception-
Show the current setting of stack unwinding in the functions called by
GDB. set may-call-functions-
Set permission to call functions in the program.
This controls whether GDB will attempt to call functions in
the program, such as with expressions in theprintcommand. It
defaults toon.To call a function in the program, GDB has to temporarily
modify the state of the inferior. This has potentially undesired side
effects. Also, having GDB call nested functions is likely to
be erroneous and may even crash the program being debugged. You can
avoid such hazards by forbidding GDB from calling functions
in the program being debugged. If calling functions in the program
is forbidden, GDB will throw an error when a command (such as printing
an expression) starts a function call in the program. show may-call-functions-
Show permission to call functions in the program.
17.5.1 Calling functions with no debug info
Sometimes, a function you wish to call is missing debug information.
In such case, GDB does not know the type of the function,
including the types of the function’s parameters. To avoid calling
the inferior function incorrectly, which could result in the called
function functioning erroneously and even crash, GDB refuses
to call the function unless you tell it the type of the function.
For prototyped (i.e. ANSI/ISO style) functions, there are two ways
to do that. The simplest is to cast the call to the function’s
declared return type. For example:
(gdb) p getenv ("PATH")
'getenv' has unknown return type; cast the call to its declared return type
(gdb) p (char *) getenv ("PATH")
$1 = 0x7fffffffe7ba "/usr/local/bin:/"...
Casting the return type of a no-debug function is equivalent to
casting the function to a pointer to a prototyped function that has a
prototype that matches the types of the passed-in arguments, and
calling that. I.e., the call above is equivalent to:
(gdb) p ((char * (*) (const char *)) getenv) ("PATH")
and given this prototyped C or C++ function with float parameters:
float multiply (float v1, float v2) { return v1 * v2; }
these calls are equivalent:
(gdb) p (float) multiply (2.0f, 3.0f) (gdb) p ((float (*) (float, float)) multiply) (2.0f, 3.0f)
If the function you wish to call is declared as unprototyped (i.e.
old K&R style), you must use the cast-to-function-pointer syntax, so
that GDB knows that it needs to apply default argument
promotions (promote float arguments to double). See float
promotion. For example, given this unprototyped C function with
float parameters, and no debug info:
float
multiply_noproto (v1, v2)
float v1, v2;
{
return v1 * v2;
}
you call it like this:
(gdb) p ((float (*) ()) multiply_noproto) (2.0f, 3.0f)
17.6 Patching Programs
By default, GDB opens the file containing your program’s
executable code (or the corefile) read-only. This prevents accidental
alterations to machine code; but it also prevents you from intentionally
patching your program’s binary.
If you’d like to be able to patch the binary, you can specify that
explicitly with the set write command. For example, you might
want to turn on internal debugging flags, or even to make emergency
repairs.
set write onset write off-
If you specify ‘set write on’, GDB opens executable and
core files for both reading and writing; if you specify set write
off (the default), GDB opens them read-only.If you have already loaded a file, you must load it again (using the
exec-fileorcore-filecommand) after changingset, for your new setting to take effect.
write show write-
Display whether executable files and core files are opened for writing
as well as reading.
17.7 Compiling and injecting code in GDB
GDB supports on-demand compilation and code injection into
programs running under GDB. GCC 5.0 or higher built with
libcc1.so must be installed for this functionality to be enabled.
This functionality is implemented with the following commands.
compile code source-codecompile code -raw -- source-code-
Compile source-code with the compiler language found as the current
language in GDB (see Languages). If compilation and
injection is not supported with the current language specified in
GDB, or the compiler does not support this feature, an error
message will be printed. If source-code compiles and links
successfully, GDB will load the object-code emitted,
and execute it within the context of the currently selected inferior.
It is important to note that the compiled code is executed immediately.
After execution, the compiled code is removed from GDB and any
new types or variables you have defined will be deleted.The command allows you to specify source-code in two ways.
The simplest method is to provide a single line of code to the command.
E.g.:compile code printf ("hello worldn");If you specify options on the command line as well as source code, they
may conflict. The ‘—’ delimiter can be used to separate options
from actual source code. E.g.:compile code -r -- printf ("hello worldn");Alternatively you can enter source code as multiple lines of text. To
enter this mode, invoke the ‘compile code’ command without any text
following the command. This will start the multiple-line editor and
allow you to type as many lines of source code as required. When you
have completed typing, enter ‘end’ on its own line to exit the
editor.compile code >printf ("hellon"); >printf ("worldn"); >endSpecifying ‘-raw’, prohibits GDB from wrapping the
provided source-code in a callable scope. In this case, you must
specify the entry point of the code by defining a function named
_gdb_expr_. The ‘-raw’ code cannot access variables of the
inferior. Using ‘-raw’ option may be needed for example when
source-code requires ‘#include’ lines which may conflict with
inferior symbols otherwise. compile file filenamecompile file -raw filename-
Like
compile code, but take the source code from filename.compile file /home/user/example.c
compile print [[options] --] exprcompile print [[options] --] /f expr-
Compile and execute expr with the compiler language found as the
current language in GDB (see Languages). By default the
value of expr is printed in a format appropriate to its data type;
you can choose a different format by specifying ‘/f’, where
f is a letter specifying the format; see Output
Formats. Thecompile printcommand accepts the same options
as theprintcommand; see print options. compile print [[options] --]compile print [[options] --] /f-
Alternatively you can enter the expression (source code producing it) as
multiple lines of text. To enter this mode, invoke the ‘compile print’
command without any text following the command. This will start the
multiple-line editor.
The process of compiling and injecting the code can be inspected using:
set debug compile-
Turns on or off display of GDB process of compiling and
injecting the code. The default is off. show debug compile-
Displays the current state of displaying GDB process of
compiling and injecting the code. set debug compile-cplus-types-
Turns on or off the display of C++ type conversion debugging information.
The default is off. show debug compile-cplus-types-
Displays the current state of displaying debugging information for
C++ type conversion.
17.7.1 Compilation options for the compile command
GDB needs to specify the right compilation options for the code
to be injected, in part to make its ABI compatible with the inferior
and in part to make the injected code compatible with GDB’s
injecting process.
The options used, in increasing precedence:
- target architecture and OS options (
gdbarch) -
These options depend on target processor type and target operating
system, usually they specify at least 32-bit (-m32) or 64-bit
(-m64) compilation option. - compilation options recorded in the target
-
GCC (since version 4.7) stores the options used for compilation
intoDW_AT_producerpart of DWARF debugging information according
to the GCC option-grecord-gcc-switches. One has to
explicitly specify-gduring inferior compilation otherwise
GCC produces no DWARF. This feature is only relevant for
platforms where-gproduces DWARF by default, otherwise one may
try to enforce DWARF by using-gdwarf-4. - compilation options set by
set compile-args
You can override compilation options using the following command:
set compile-args-
Set compilation options used for compiling and injecting code with the
compilecommands. These options override any conflicting ones
from the target architecture and/or options stored during inferior
compilation. show compile-args-
Displays the current state of compilation options override.
This does not show all the options actually used during compilation,
use set debug compile for that.
17.7.2 Caveats when using the compile command
There are a few caveats to keep in mind when using the compile
command. As the caveats are different per language, the table below
highlights specific issues on a per language basis.
- C code examples and caveats
-
When the language in GDB is set to ‘C’, the compiler will
attempt to compile the source code with a ‘C’ compiler. The source
code provided to thecompilecommand will have much the same
access to variables and types as it normally would if it were part of
the program currently being debugged in GDB.Below is a sample program that forms the basis of the examples that
follow. This program has been compiled and loaded into GDB,
much like any other normal debugging session.void function1 (void) { int i = 42; printf ("function 1n"); } void function2 (void) { int j = 12; function1 (); } int main(void) { int k = 6; int *p; function2 (); return 0; }For the purposes of the examples in this section, the program above has
been compiled, loaded into GDB, stopped at the function
main, and GDB is awaiting input from the user.To access variables and types for any program in GDB, the
program must be compiled and packaged with debug information. The
compilecommand is not an exception to this rule. Without debug
information, you can still use thecompilecommand, but you will
be very limited in what variables and types you can access.So with that in mind, the example above has been compiled with debug
information enabled. Thecompilecommand will have access to
all variables and types (except those that may have been optimized
out). Currently, as GDB has stopped the program in the
mainfunction, thecompilecommand would have access to
the variablek. You could invoke thecompilecommand
and type some source code to set the value ofk. You can also
read it, or do anything with that variable you would normally do in
C. Be aware that changes to inferior variables in the
compilecommand are persistent. In the following example:the variable
kis now 3. It will retain that value until
something else in the example program changes it, or another
compilecommand changes it.Normal scope and access rules apply to source code compiled and
injected by thecompilecommand. In the example, the variables
jandkare not accessible yet, because the program is
currently stopped in themainfunction, where these variables
are not in scope. Therefore, the following commandwill result in a compilation error message.
Once the program is continued, execution will bring these variables in
scope, and they will become accessible; then the code you specify via
thecompilecommand will be able to access them.You can create variables and types with the
compilecommand as
part of your source code. Variables and types that are created as part
of thecompilecommand are not visible to the rest of the program for
the duration of its run. This example is valid:compile code int ff = 5; printf ("ff is %dn", ff);However, if you were to type the following into GDB after that
command has completed:compile code printf ("ff is %dn'', ff);a compiler error would be raised as the variable
ffno longer
exists. Object code generated and injected by thecompile
command is removed when its execution ends. Caution is advised
when assigning to program variables values of variables created by the
code submitted to thecompilecommand. This example is valid:compile code int ff = 5; k = ff;
The value of the variable
ffis assigned tok. The variable
kdoes not require the existence offfto maintain the value
it has been assigned. However, pointers require particular care in
assignment. If the source code compiled with thecompilecommand
changed the address of a pointer in the example program, perhaps to a
variable created in thecompilecommand, that pointer would point
to an invalid location when the command exits. The following example
would likely cause issues with your debugged program:compile code int ff = 5; p = &ff;
In this example,
pwould point toffwhen the
compilecommand is executing the source code provided to it.
However, as variables in the (example) program persist with their
assigned values, the variablepwould point to an invalid
location when the command exists. A general rule should be followed
in that you should either assignNULLto any assigned pointers,
or restore a valid location to the pointer before the command exits.Similar caution must be exercised with any structs, unions, and typedefs
defined incompilecommand. Types defined in thecompile
command will no longer be available in the nextcompilecommand.
Therefore, if you cast a variable to a type defined in the
compilecommand, care must be taken to ensure that any future
need to resolve the type can be achieved.(gdb) compile code static struct a { int a; } v = { 42 }; argv = &v; (gdb) compile code printf ("%dn", ((struct a *) argv)->a); gdb command line:1:36: error: dereferencing pointer to incomplete type âstruct aâ Compilation failed. (gdb) compile code struct a { int a; }; printf ("%dn", ((struct a *) argv)->a); 42Variables that have been optimized away by the compiler are not
accessible to the code submitted to thecompilecommand.
Access to those variables will generate a compiler error which GDB
will print to the console.
17.7.3 Compiler search for the compile command
GDB needs to find GCC for the inferior being debugged
which may not be obvious for remote targets of different architecture
than where GDB is running. Environment variable PATH on
GDB host is searched for GCC binary matching the
target architecture and operating system. This search can be overriden
by set compile-gcc GDB command below. PATH is
taken from shell that executed GDB, it is not the value set by
GDB command set environment). See Environment.
Specifically PATH is searched for binaries matching regular expression
arch(-[^-]*)?-os-gcc according to the inferior target being
debugged. arch is processor name — multiarch is supported, so for
example both i386 and x86_64 targets look for pattern
(x86_64|i.86) and both s390 and s390x targets look
for pattern s390x?. os is currently supported only for
pattern linux(-gnu)?.
On Posix hosts the compiler driver GDB needs to find also
shared library libcc1.so from the compiler. It is searched in
default shared library search path (overridable with usual environment
variable LD_LIBRARY_PATH), unrelated to PATH or set settings. Contrary to it libcc1plugin.so is found
compile-gcc
according to the installation of the found compiler — as possibly
specified by the set compile-gcc command.
set compile-gcc-
Set compilation command used for compiling and injecting code with the
compilecommands. If this option is not set (it is set to
an empty string), the search described above will occur — that is the
default. show compile-gcc-
Displays the current compile command GCC driver filename.
If set, it is the main commandgcc, found usually for example
under name x86_64-linux-gnu-gcc.
18 GDB Files
GDB needs to know the file name of the program to be debugged,
both in order to read its symbol table and in order to start your
program. To debug a core dump of a previous run, you must also tell
GDB the name of the core dump file.
18.1 Commands to Specify Files
You may want to specify executable and core dump file names. The usual
way to do this is at start-up time, using the arguments to
GDB’s start-up commands (see Getting In and
Out of GDB).
Occasionally it is necessary to change to a different file during a
GDB session. Or you may run GDB and forget to
specify a file you want to use. Or you are debugging a remote target
via gdbserver (see Using the gdbserver
Program). In these situations the GDB commands to specify
new files are useful.
file filename-
Use filename as the program to be debugged. It is read for its
symbols and for the contents of pure memory. It is also the program
executed when you use theruncommand. If you do not specify a
directory and the file is not found in the GDB working directory,
GDB uses the environment variablePATHas a list of
directories to search, just as the shell does when looking for a program
to run. You can change the value of this variable, for both GDB
and your program, using thepathcommand.You can load unlinked object .o files into GDB using
thefilecommand. You will not be able to “run” an object
file, but you can disassemble functions and inspect variables. Also,
if the underlying BFD functionality supports it, you could use
gdb -write to patch object files using this technique. Note
that GDB can neither interpret nor modify relocations in this
case, so branches and some initialized variables will appear to go to
the wrong place. But this feature is still handy from time to time. file-
filewith no argument makes GDB discard any information it
has on both executable file and the symbol table. exec-file [ filename ]-
Specify that the program to be run (but not the symbol table) is found
in filename. GDB searches the environment variablePATH
if necessary to locate your program. Omitting filename means to
discard information on the executable file. symbol-file [ filename [ -o offset ]]-
Read symbol table information from file filename.
PATHis
searched when necessary. Use thefilecommand to get both symbol
table and program to run from the same file.If an optional offset is specified, it is added to the start
address of each section in the symbol file. This is useful if the
program is relocated at runtime, such as the Linux kernel with kASLR
enabled.symbol-filewith no argument clears out GDB information on your
program’s symbol table.The
symbol-filecommand causes GDB to forget the contents of
some breakpoints and auto-display expressions. This is because they may
contain pointers to the internal data recording symbols and data types,
which are part of the old symbol table data being discarded inside
GDB.symbol-filedoes not repeat if you press RET again after
executing it once.When GDB is configured for a particular environment, it
understands debugging information in whatever format is the standard
generated for that environment; you may use either a GNU compiler, or
other compilers that adhere to the local conventions.
Best results are usually obtained from GNU compilers; for example,
usingGCCyou can generate debugging information for
optimized code.For most kinds of object files, with the exception of old SVR3 systems
using COFF, thesymbol-filecommand does not normally read the
symbol table in full right away. Instead, it scans the symbol table
quickly to find which source files and which symbols are present. The
details are read later, one source file at a time, as they are needed.The purpose of this two-stage reading strategy is to make GDB
start up faster. For the most part, it is invisible except for
occasional pauses while the symbol table details for a particular source
file are being read. (Theset verbosecommand can turn these
pauses into messages if desired. See Optional
Warnings and Messages.)We have not implemented the two-stage strategy for COFF yet. When the
symbol table is stored in COFF format,symbol-filereads the
symbol table data in full right away. Note that “stabs-in-COFF”
still does the two-stage strategy, since the debug info is actually
in stabs format. symbol-file [ -readnow ] filenamefile [ -readnow ] filename-
You can override the GDB two-stage strategy for reading symbol
tables by using the ‘-readnow’ option with any of the commands that
load symbol table information, if you want to be sure GDB has the
entire symbol table available. symbol-file [ -readnever ] filenamefile [ -readnever ] filename-
You can instruct GDB to never read the symbolic information
contained in filename by using the ‘-readnever’ option.
See —readnever. core-file [filename]core-
Specify the whereabouts of a core dump file to be used as the “contents
of memory”. Traditionally, core files contain only some parts of the
address space of the process that generated them; GDB can access the
executable file itself for other parts.core-filewith no argument specifies that no core file is
to be used.Note that the core file is ignored when your program is actually running
under GDB. So, if you have been running your program and you
wish to debug a core file instead, you must kill the subprocess in which
the program is running. To do this, use thekillcommand
(see Killing the Child Process). add-symbol-file filename [ -readnow | -readnever ] [ -o offset ] [ textaddress ] [ -s section address … ]-
The
add-symbol-filecommand reads additional symbol table
information from the file filename. You would use this command
when filename has been dynamically loaded (by some other means)
into the program that is running. The textaddress parameter gives
the memory address at which the file’s text section has been loaded.
You can additionally specify the base address of other sections using
an arbitrary number of ‘-s section address’ pairs.
If a section is omitted, GDB will use its default addresses
as found in filename. Any address or textaddress
can be given as an expression.If an optional offset is specified, it is added to the start
address of each section, except those for which the address was
specified explicitly.The symbol table of the file filename is added to the symbol table
originally read with thesymbol-filecommand. You can use the
add-symbol-filecommand any number of times; the new symbol data
thus read is kept in addition to the old.Changes can be reverted using the command
remove-symbol-file.Although filename is typically a shared library file, an
executable file, or some other object file which has been fully
relocated for loading into a process, you can also load symbolic
information from relocatable .o files, as long as:- the file’s symbolic information refers only to linker symbols defined in
that file, not to symbols defined by other object files, - every section the file’s symbolic information refers to has actually
been loaded into the inferior, as it appears in the file, and - you can determine the address at which every section was loaded, and
provide these to theadd-symbol-filecommand.
Some embedded operating systems, like Sun Chorus and VxWorks, can load
relocatable files into an already running program; such systems
typically make the requirements above easy to meet. However, it’s
important to recognize that many native systems use complex link
procedures (.linkoncesection factoring and C++ constructor table
assembly, for example) that make the requirements difficult to meet. In
general, one cannot assume that usingadd-symbol-fileto read a
relocatable object file’s symbolic information will have the same effect
as linking the relocatable object file into the program in the normal
way.add-symbol-filedoes not repeat if you press RET after using it. - the file’s symbolic information refers only to linker symbols defined in
remove-symbol-file filenameremove-symbol-file -a address-
Remove a symbol file added via the
add-symbol-filecommand. The
file to remove can be identified by its filename or by an address
that lies within the boundaries of this symbol file in memory. Example:(gdb) add-symbol-file /home/user/gdb/mylib.so 0x7ffff7ff9480 add symbol table from file "/home/user/gdb/mylib.so" at .text_addr = 0x7ffff7ff9480 (y or n) y Reading symbols from /home/user/gdb/mylib.so... (gdb) remove-symbol-file -a 0x7ffff7ff9480 Remove symbol table from file "/home/user/gdb/mylib.so"? (y or n) y (gdb)remove-symbol-filedoes not repeat if you press RET after using it. add-symbol-file-from-memory address-
Load symbols from the given address in a dynamically loaded
object file whose image is mapped directly into the inferior’s memory.
For example, the Linux kernel maps asyscall DSOinto each
process’s address space; this DSO provides kernel-specific code for
some system calls. The argument can be any expression whose
evaluation yields the address of the file’s shared object file header.
For this command to work, you must have usedsymbol-fileor
exec-filecommands in advance. section section addr-
The
sectioncommand changes the base address of the named
section of the exec file to addr. This can be used if the
exec file does not contain section addresses, (such as in the
a.outformat), or when the addresses specified in the file
itself are wrong. Each section must be changed separately. The
info filescommand, described below, lists all the sections and
their addresses. info filesinfo target-
info filesandinfo targetare synonymous; both print the
current target (see Specifying a Debugging Target),
including the names of the executable and core dump files currently in
use by GDB, and the files from which symbols were loaded. The
commandhelp targetlists all possible targets rather than
current ones. maint info sections [-all-objects] [filter-list]-
Another command that can give you extra information about program sections
ismaint info sections. In addition to the section information
displayed byinfo files, this command displays the flags and file
offset of each section in the executable and core dump files.When ‘-all-objects’ is passed then sections from all loaded object
files, including shared libraries, are printed.The optional filter-list is a space separated list of filter
keywords. Sections that match any one of the filter criteria will be
printed. There are two types of filter:section-name-
Display information about any section named section-name.
section-flag-
Display information for any section with section-flag. The
section flags that GDB currently knows about are:ALLOC-
Section will have space allocated in the process when loaded.
Set for all sections except those containing debug information. LOAD-
Section will be loaded from the file into the child process memory.
Set for pre-initialized code and data, clear for.bsssections. RELOC-
Section needs to be relocated before loading.
READONLY-
Section cannot be modified by the child process.
CODE-
Section contains executable code only.
DATA-
Section contains data only (no executable code).
ROM-
Section will reside in ROM.
CONSTRUCTOR-
Section contains data for constructor/destructor lists.
HAS_CONTENTS-
Section is not empty.
NEVER_LOAD-
An instruction to the linker to not output the section.
COFF_SHARED_LIBRARY-
A notification to the linker that the section contains
COFF shared library information. IS_COMMON-
Section contains common symbols.
maint info target-sections-
This command prints GDB’s internal section table. For each
target GDB maintains a table containing the allocatable
sections from all currently mapped objects, along with information
about where the section is mapped. set trust-readonly-sections on-
Tell GDB that readonly sections in your object file
really are read-only (i.e. that their contents will not change).
In that case, GDB can fetch values from these sections
out of the object file, rather than from the target program.
For some targets (notably embedded ones), this can be a significant
enhancement to debugging performance.The default is off.
set trust-readonly-sections off-
Tell GDB not to trust readonly sections. This means that
the contents of the section might change while the program is running,
and must therefore be fetched from the target when needed. show trust-readonly-sections-
Show the current setting of trusting readonly sections.
All file-specifying commands allow both absolute and relative file names
as arguments. GDB always converts the file name to an absolute file
name and remembers it that way.
GDB supports GNU/Linux, MS-Windows, SunOS,
Darwin/Mach-O, SVr4, IBM RS/6000 AIX, QNX Neutrino, FDPIC (FR-V), and
DSBT (TIC6X) shared libraries.
On MS-Windows GDB must be linked with the Expat library to support
shared libraries. See Expat.
GDB automatically loads symbol definitions from shared libraries
when you use the run command, or when you examine a core file.
(Before you issue the run command, GDB does not understand
references to a function in a shared library, however—unless you are
debugging a core file).
There are times, however, when you may wish to not automatically load
symbol definitions from shared libraries, such as when they are
particularly large or there are many of them.
To control the automatic loading of shared library symbols, use the
commands:
set auto-solib-add mode-
If mode is
on, symbols from all shared object libraries
will be loaded automatically when the inferior begins execution, you
attach to an independently started inferior, or when the dynamic linker
informs GDB that a new library has been loaded. If mode
isoff, symbols must be loaded manually, using the
sharedlibrarycommand. The default value ison.If your program uses lots of shared libraries with debug info that
takes large amounts of memory, you can decrease the GDB
memory footprint by preventing it from automatically loading the
symbols from shared libraries. To that end, type set
auto-solib-add off before running the inferior, then load each
library whose debug symbols you do need with sharedlibrary
regexp, where regexp is a regular expression that matches
the libraries whose symbols you want to be loaded. show auto-solib-add-
Display the current autoloading mode.
To explicitly load shared library symbols, use the sharedlibrary
command:
info share regexinfo sharedlibrary regex-
Print the names of the shared libraries which are currently loaded
that match regex. If regex is omitted then print
all shared libraries that are loaded. info dll regex-
This is an alias of
info sharedlibrary. sharedlibrary regexshare regex-
Load shared object library symbols for files matching a
Unix regular expression.
As with files loaded automatically, it only loads shared libraries
required by your program for a core file or after typingrun. If
regex is omitted all shared libraries required by your program are
loaded. nosharedlibrary-
Unload all shared object library symbols. This discards all symbols
that have been loaded from all shared libraries. Symbols from shared
libraries that were loaded by explicit user requests are not
discarded.
Sometimes you may wish that GDB stops and gives you control
when any of shared library events happen. The best way to do this is
to use catch load and catch unload (see Set Catchpoints).
GDB also supports the set stop-on-solib-events
command for this. This command exists for historical reasons. It is
less useful than setting a catchpoint, because it does not allow for
conditions or commands as a catchpoint does.
set stop-on-solib-events-
This command controls whether GDB should give you control
when the dynamic linker notifies it about some shared library event.
The most common event of interest is loading or unloading of a new
shared library. show stop-on-solib-events-
Show whether GDB stops and gives you control when shared
library events happen.
Shared libraries are also supported in many cross or remote debugging
configurations. GDB needs to have access to the target’s libraries;
this can be accomplished either by providing copies of the libraries
on the host system, or by asking GDB to automatically retrieve the
libraries from the target. If copies of the target libraries are
provided, they need to be the same as the target libraries, although the
copies on the target can be stripped as long as the copies on the host are
not.
For remote debugging, you need to tell GDB where the target
libraries are, so that it can load the correct copies—otherwise, it
may try to load the host’s libraries. GDB has two variables
to specify the search directories for target libraries.
set sysroot path-
Use path as the system root for the program being debugged. Any
absolute shared library paths will be prefixed with path; many
runtime loaders store the absolute paths to the shared library in the
target program’s memory. When starting processes remotely, and when
attaching to already-running processes (local or remote), their
executable filenames will be prefixed with path if reported to
GDB as absolute by the operating system. If you use
set sysrootto find executables and shared libraries, they need
to be laid out in the same way that they are on the target, with
e.g. a /bin, /lib and /usr/lib hierarchy under
path.If path starts with the sequence target: and the target
system is remote then GDB will retrieve the target binaries
from the remote system. This is only supported when using a remote
target that supports theremote getcommand (see Sending files to a remote system). The part of path
following the initial target: (if present) is used as system
root prefix on the remote file system. If path starts with the
sequence remote: this is converted to the sequence
target: byset sysroot15. If you want
to specify a local system root using a directory that happens to be
named target: or remote:, you need to use some
equivalent variant of the name like ./target:.For targets with an MS-DOS based filesystem, such as MS-Windows,
GDB tries prefixing a few variants of the target
absolute file name with path. But first, on Unix hosts,
GDB converts all backslash directory separators into forward
slashes, because the backslash is not a directory separator on Unix:c:foobar.dll ⇒ c:/foo/bar.dll
Then, GDB attempts prefixing the target file name with
path, and looks for the resulting file name in the host file
system:c:/foo/bar.dll ⇒ /path/to/sysroot/c:/foo/bar.dll
If that does not find the binary, GDB tries removing
the ‘:’ character from the drive spec, both for convenience, and,
for the case of the host file system not supporting file names with
colons:c:/foo/bar.dll ⇒ /path/to/sysroot/c/foo/bar.dll
This makes it possible to have a system root that mirrors a target
with more than one drive. E.g., you may want to setup your local
copies of the target system shared libraries like so (note ‘c’ vs
‘z’):/path/to/sysroot/c/sys/bin/foo.dll /path/to/sysroot/c/sys/bin/bar.dll /path/to/sysroot/z/sys/bin/bar.dll
and point the system root at /path/to/sysroot, so that
GDB can find the correct copies of both
c:sysbinfoo.dll, and z:sysbinbar.dll.If that still does not find the binary, GDB tries
removing the whole drive spec from the target file name:c:/foo/bar.dll ⇒ /path/to/sysroot/foo/bar.dll
This last lookup makes it possible to not care about the drive name,
if you don’t want or need to.The
set solib-absolute-prefixcommand is an alias forset.
sysrootYou can set the default system root by using the configure-time
‘—with-sysroot’ option. If the system root is inside
GDB’s configured binary prefix (set with ‘—prefix’ or
‘—exec-prefix’), then the default system root will be updated
automatically if the installed GDB is moved to a new
location. show sysroot-
Display the current executable and shared library prefix.
set solib-search-path path-
If this variable is set, path is a colon-separated list of
directories to search for shared libraries. ‘solib-search-path’
is used after ‘sysroot’ fails to locate the library, or if the
path to the library is relative instead of absolute. If you want to
use ‘solib-search-path’ instead of ‘sysroot’, be sure to set
‘sysroot’ to a nonexistent directory to prevent GDB from
finding your host’s libraries. ‘sysroot’ is preferred; setting
it to a nonexistent directory may interfere with automatic loading
of shared library symbols. show solib-search-path-
Display the current shared library search path.
set target-file-system-kind kind-
Set assumed file system kind for target reported file names.
Shared library file names as reported by the target system may not
make sense as is on the system GDB is running on. For
example, when remote debugging a target that has MS-DOS based file
system semantics, from a Unix host, the target may be reporting to
GDB a list of loaded shared libraries with file names such as
c:Windowskernel32.dll. On Unix hosts, there’s no concept of
drive letters, so the ‘c:’ prefix is not normally understood as
indicating an absolute file name, and neither is the backslash
normally considered a directory separator character. In that case,
the native file system would interpret this whole absolute file name
as a relative file name with no directory components. This would make
it impossible to point GDB at a copy of the remote target’s
shared libraries on the host usingset sysroot, and impractical
withset solib-search-path. Setting
target-file-system-kindtodos-basedtells GDB
to interpret such file names similarly to how the target would, and to
map them to file names valid on GDB’s native file system
semantics. The value of kind can be"auto", in addition
to one of the supported file system kinds. In that case, GDB
tries to determine the appropriate file system variant based on the
current target’s operating system (see Configuring the
Current ABI). The supported file system settings are:unix-
Instruct GDB to assume the target file system is of Unix
kind. Only file names starting the forward slash (‘/’) character
are considered absolute, and the directory separator character is also
the forward slash. dos-based-
Instruct GDB to assume the target file system is DOS based.
File names starting with either a forward slash, or a drive letter
followed by a colon (e.g., ‘c:’), are considered absolute, and
both the slash (‘/’) and the backslash (‘\’) characters are
considered directory separators. auto-
Instruct GDB to use the file system kind associated with the
target operating system (see Configuring the Current ABI).
This is the default.
When processing file names provided by the user, GDB
frequently needs to compare them to the file names recorded in the
program’s debug info. Normally, GDB compares just the
base names of the files as strings, which is reasonably fast
even for very large programs. (The base name of a file is the last
portion of its name, after stripping all the leading directories.)
This shortcut in comparison is based upon the assumption that files
cannot have more than one base name. This is usually true, but
references to files that use symlinks or similar filesystem
facilities violate that assumption. If your program records files
using such facilities, or if you provide file names to GDB
using symlinks etc., you can set basenames-may-differ to
true to instruct GDB to completely canonicalize each
pair of file names it needs to compare. This will make file-name
comparisons accurate, but at a price of a significant slowdown.
set basenames-may-differ-
Set whether a source file may have multiple base names.
show basenames-may-differ-
Show whether a source file may have multiple base names.
18.2 File Caching
To speed up file loading, and reduce memory usage, GDB will
reuse the bfd objects used to track open files. See BFD in The Binary File Descriptor Library. The following commands
allow visibility and control of the caching behavior.
maint info bfds-
This prints information about each
bfdobject that is known to
GDB. maint set bfd-sharingmaint show bfd-sharing-
Control whether
bfdobjects can be shared. When sharing is
enabled GDB reuses already openbfdobjects rather
than reopening the same file. Turning sharing off does not cause
already sharedbfdobjects to be unshared, but all future files
that are opened will create a newbfdobject. Similarly,
re-enabling sharing does not cause multiple existingbfd
objects to be collapsed into a single sharedbfdobject. set debug bfd-cache level-
Turns on debugging of the bfd cache, setting the level to level.
show debug bfd-cache-
Show the current debugging level of the bfd cache.
18.3 Debugging Information in Separate Files
GDB allows you to put a program’s debugging information in a
file separate from the executable itself, in a way that allows
GDB to find and load the debugging information automatically.
Since debugging information can be very large—sometimes larger
than the executable code itself—some systems distribute debugging
information for their executables in separate files, which users can
install only when they need to debug a problem.
GDB supports two ways of specifying the separate debug info
file:
- The executable contains a debug link that specifies the name of
the separate debug info file. The separate debug file’s name is
usually executable.debug, where executable is the
name of the corresponding executable file without leading directories
(e.g., ls.debug for /usr/bin/ls). In addition, the
debug link specifies a 32-bit Cyclic Redundancy Check (CRC)
checksum for the debug file, which GDB uses to validate that
the executable and the debug file came from the same build. - The executable contains a build ID, a unique bit string that is
also present in the corresponding debug info file. (This is supported
only on some operating systems, when using the ELF or PE file formats
for binary files and the GNU Binutils.) For more details about
this feature, see the description of the —build-id
command-line option in Command Line Options in The GNU Linker. The debug info file’s name is not specified
explicitly by the build ID, but can be computed from the build ID, see
below.
Depending on the way the debug info file is specified, GDB
uses two different methods of looking for the debug file:
- For the “debug link” method, GDB looks up the named file in
the directory of the executable file, then in a subdirectory of that
directory named .debug, and finally under each one of the
global debug directories, in a subdirectory whose name is identical to
the leading directories of the executable’s absolute file name. (On
MS-Windows/MS-DOS, the drive letter of the executable’s leading
directories is converted to a one-letter subdirectory, i.e.
d:/usr/bin/ is converted to /d/usr/bin/, because Windows
filesystems disallow colons in file names.) - For the “build ID” method, GDB looks in the
.build-id subdirectory of each one of the global debug directories for
a file named nn/nnnnnnnn.debug, where nn are the
first 2 hex characters of the build ID bit string, and nnnnnnnn
are the rest of the bit string. (Real build ID strings are 32 or more
hex characters, not 10.) GDB can automatically query
debuginfodservers using build IDs in order to download separate debug
files that cannot be found locally. For more information see Debuginfod.
So, for example, suppose you ask GDB to debug
/usr/bin/ls, which has a debug link that specifies the
file ls.debug, and a build ID whose value in hex is
abcdef1234. If the list of the global debug directories includes
/usr/lib/debug, then GDB will look for the following
debug information files, in the indicated order:
- — /usr/lib/debug/.build-id/ab/cdef1234.debug
- — /usr/bin/ls.debug
- — /usr/bin/.debug/ls.debug
- — /usr/lib/debug/usr/bin/ls.debug.
If the debug file still has not been found and debuginfod
(see Debuginfod) is enabled, GDB will attempt to download the
file from debuginfod servers.
Global debugging info directories default to what is set by GDB
configure option —with-separate-debug-dir. During GDB run
you can also set the global debugging info directories, and view the list
GDB is currently using.
set debug-file-directory directories-
Set the directories which GDB searches for separate debugging
information files to directory. Multiple path components can be set
concatenating them by a path separator. show debug-file-directory-
Show the directories GDB searches for separate debugging
information files.
A debug link is a special section of the executable file named
.gnu_debuglink. The section must contain:
- A filename, with any leading directory components removed, followed by
a zero byte, - zero to three bytes of padding, as needed to reach the next four-byte
boundary within the section, and - a four-byte CRC checksum, stored in the same endianness used for the
executable file itself. The checksum is computed on the debugging
information file’s full contents by the function given below, passing
zero as the crc argument.
Any executable file format can carry a debug link, as long as it can
contain a section named .gnu_debuglink with the contents
described above.
The build ID is a special section in the executable file (and in other
ELF binary files that GDB may consider). This section is
often named .note.gnu.build-id, but that name is not mandatory.
It contains unique identification for the built files—the ID remains
the same across multiple builds of the same build tree. The default
algorithm SHA1 produces 160 bits (40 hexadecimal characters) of the
content for the build ID string. The same section with an identical
value is present in the original built binary with symbols, in its
stripped variant, and in the separate debugging information file.
The debugging information file itself should be an ordinary
executable, containing a full set of linker symbols, sections, and
debugging information. The sections of the debugging information file
should have the same names, addresses, and sizes as the original file,
but they need not contain any data—much like a .bss section
in an ordinary executable.
The GNU binary utilities (Binutils) package includes the
‘objcopy’ utility that can produce
the separated executable / debugging information file pairs using the
following commands:
objcopy --only-keep-debug foo foo.debug strip -g foo
These commands remove the debugging
information from the executable file foo and place it in the file
foo.debug. You can use the first, second or both methods to link the
two files:
- The debug link method needs the following additional command to also leave
behind a debug link in foo:objcopy --add-gnu-debuglink=foo.debug foo
Ulrich Drepper’s elfutils package, starting with version 0.53, contains
a version of thestripcommand such that the command strip foo -f
foo.debug has the same functionality as the twoobjcopycommands and
theln -scommand above, together. - Build ID gets embedded into the main executable using
ld --build-idor
the GCC counterpartgcc -Wl,--build-id. Build ID support plus
compatibility fixes for debug files separation are present in GNU binary
utilities (Binutils) package since version 2.18.
The CRC used in .gnu_debuglink is the CRC-32 defined in
IEEE 802.3 using the polynomial:
x32 + x26 + x23 + x22 + x16 + x12 + x11 + x10 + x8 + x7 + x5 + x4 + x2 + x + 1
The function is computed byte at a time, taking the least
significant bit of each byte first. The initial pattern
0xffffffff is used, to ensure leading zeros affect the CRC and
the final result is inverted to ensure trailing zeros also affect the
CRC.
Note: This is the same CRC polynomial as used in handling the
Remote Serial Protocol qCRC packet (see qCRC packet).
However in the case of the Remote Serial Protocol, the CRC is computed
most significant bit first, and the result is not inverted, so
trailing zeros have no effect on the CRC value.
To complete the description, we show below the code of the function
which produces the CRC used in .gnu_debuglink. Inverting the
initially supplied crc argument means that an initial call to
this function passing in zero will start computing the CRC using
0xffffffff.
unsigned long
gnu_debuglink_crc32 (unsigned long crc,
unsigned char *buf, size_t len)
{
static const unsigned long crc32_table[256] =
{
0x00000000, 0x77073096, 0xee0e612c, 0x990951ba, 0x076dc419,
0x706af48f, 0xe963a535, 0x9e6495a3, 0x0edb8832, 0x79dcb8a4,
0xe0d5e91e, 0x97d2d988, 0x09b64c2b, 0x7eb17cbd, 0xe7b82d07,
0x90bf1d91, 0x1db71064, 0x6ab020f2, 0xf3b97148, 0x84be41de,
0x1adad47d, 0x6ddde4eb, 0xf4d4b551, 0x83d385c7, 0x136c9856,
0x646ba8c0, 0xfd62f97a, 0x8a65c9ec, 0x14015c4f, 0x63066cd9,
0xfa0f3d63, 0x8d080df5, 0x3b6e20c8, 0x4c69105e, 0xd56041e4,
0xa2677172, 0x3c03e4d1, 0x4b04d447, 0xd20d85fd, 0xa50ab56b,
0x35b5a8fa, 0x42b2986c, 0xdbbbc9d6, 0xacbcf940, 0x32d86ce3,
0x45df5c75, 0xdcd60dcf, 0xabd13d59, 0x26d930ac, 0x51de003a,
0xc8d75180, 0xbfd06116, 0x21b4f4b5, 0x56b3c423, 0xcfba9599,
0xb8bda50f, 0x2802b89e, 0x5f058808, 0xc60cd9b2, 0xb10be924,
0x2f6f7c87, 0x58684c11, 0xc1611dab, 0xb6662d3d, 0x76dc4190,
0x01db7106, 0x98d220bc, 0xefd5102a, 0x71b18589, 0x06b6b51f,
0x9fbfe4a5, 0xe8b8d433, 0x7807c9a2, 0x0f00f934, 0x9609a88e,
0xe10e9818, 0x7f6a0dbb, 0x086d3d2d, 0x91646c97, 0xe6635c01,
0x6b6b51f4, 0x1c6c6162, 0x856530d8, 0xf262004e, 0x6c0695ed,
0x1b01a57b, 0x8208f4c1, 0xf50fc457, 0x65b0d9c6, 0x12b7e950,
0x8bbeb8ea, 0xfcb9887c, 0x62dd1ddf, 0x15da2d49, 0x8cd37cf3,
0xfbd44c65, 0x4db26158, 0x3ab551ce, 0xa3bc0074, 0xd4bb30e2,
0x4adfa541, 0x3dd895d7, 0xa4d1c46d, 0xd3d6f4fb, 0x4369e96a,
0x346ed9fc, 0xad678846, 0xda60b8d0, 0x44042d73, 0x33031de5,
0xaa0a4c5f, 0xdd0d7cc9, 0x5005713c, 0x270241aa, 0xbe0b1010,
0xc90c2086, 0x5768b525, 0x206f85b3, 0xb966d409, 0xce61e49f,
0x5edef90e, 0x29d9c998, 0xb0d09822, 0xc7d7a8b4, 0x59b33d17,
0x2eb40d81, 0xb7bd5c3b, 0xc0ba6cad, 0xedb88320, 0x9abfb3b6,
0x03b6e20c, 0x74b1d29a, 0xead54739, 0x9dd277af, 0x04db2615,
0x73dc1683, 0xe3630b12, 0x94643b84, 0x0d6d6a3e, 0x7a6a5aa8,
0xe40ecf0b, 0x9309ff9d, 0x0a00ae27, 0x7d079eb1, 0xf00f9344,
0x8708a3d2, 0x1e01f268, 0x6906c2fe, 0xf762575d, 0x806567cb,
0x196c3671, 0x6e6b06e7, 0xfed41b76, 0x89d32be0, 0x10da7a5a,
0x67dd4acc, 0xf9b9df6f, 0x8ebeeff9, 0x17b7be43, 0x60b08ed5,
0xd6d6a3e8, 0xa1d1937e, 0x38d8c2c4, 0x4fdff252, 0xd1bb67f1,
0xa6bc5767, 0x3fb506dd, 0x48b2364b, 0xd80d2bda, 0xaf0a1b4c,
0x36034af6, 0x41047a60, 0xdf60efc3, 0xa867df55, 0x316e8eef,
0x4669be79, 0xcb61b38c, 0xbc66831a, 0x256fd2a0, 0x5268e236,
0xcc0c7795, 0xbb0b4703, 0x220216b9, 0x5505262f, 0xc5ba3bbe,
0xb2bd0b28, 0x2bb45a92, 0x5cb36a04, 0xc2d7ffa7, 0xb5d0cf31,
0x2cd99e8b, 0x5bdeae1d, 0x9b64c2b0, 0xec63f226, 0x756aa39c,
0x026d930a, 0x9c0906a9, 0xeb0e363f, 0x72076785, 0x05005713,
0x95bf4a82, 0xe2b87a14, 0x7bb12bae, 0x0cb61b38, 0x92d28e9b,
0xe5d5be0d, 0x7cdcefb7, 0x0bdbdf21, 0x86d3d2d4, 0xf1d4e242,
0x68ddb3f8, 0x1fda836e, 0x81be16cd, 0xf6b9265b, 0x6fb077e1,
0x18b74777, 0x88085ae6, 0xff0f6a70, 0x66063bca, 0x11010b5c,
0x8f659eff, 0xf862ae69, 0x616bffd3, 0x166ccf45, 0xa00ae278,
0xd70dd2ee, 0x4e048354, 0x3903b3c2, 0xa7672661, 0xd06016f7,
0x4969474d, 0x3e6e77db, 0xaed16a4a, 0xd9d65adc, 0x40df0b66,
0x37d83bf0, 0xa9bcae53, 0xdebb9ec5, 0x47b2cf7f, 0x30b5ffe9,
0xbdbdf21c, 0xcabac28a, 0x53b39330, 0x24b4a3a6, 0xbad03605,
0xcdd70693, 0x54de5729, 0x23d967bf, 0xb3667a2e, 0xc4614ab8,
0x5d681b02, 0x2a6f2b94, 0xb40bbe37, 0xc30c8ea1, 0x5a05df1b,
0x2d02ef8d
};
unsigned char *end;
crc = ~crc & 0xffffffff;
for (end = buf + len; buf < end; ++buf)
crc = crc32_table[(crc ^ *buf) & 0xff] ^ (crc >> 8);
return ~crc & 0xffffffff;
}
This computation does not apply to the “build ID” method.
18.4 Debugging information in a special section
Some systems ship pre-built executables and libraries that have a
special ‘.gnu_debugdata’ section. This feature is called
MiniDebugInfo. This section holds an LZMA-compressed object and
is used to supply extra symbols for backtraces.
The intent of this section is to provide extra minimal debugging
information for use in simple backtraces. It is not intended to be a
replacement for full separate debugging information (see Separate Debug Files). The example below shows the intended use; however,
GDB does not currently put restrictions on what sort of
debugging information might be included in the section.
GDB has support for this extension. If the section exists,
then it is used provided that no other source of debugging information
can be found, and that GDB was configured with LZMA support.
This section can be easily created using objcopy and other
standard utilities:
# Extract the dynamic symbols from the main binary, there is no need
# to also have these in the normal symbol table.
nm -D binary --format=posix --defined-only
| awk '{ print $1 }' | sort > dynsyms
# Extract all the text (i.e. function) symbols from the debuginfo.
# (Note that we actually also accept "D" symbols, for the benefit
# of platforms like PowerPC64 that use function descriptors.)
nm binary --format=posix --defined-only
| awk '{ if ($2 == "T" || $2 == "t" || $2 == "D") print $1 }'
| sort > funcsyms
# Keep all the function symbols not already in the dynamic symbol
# table.
comm -13 dynsyms funcsyms > keep_symbols
# Separate full debug info into debug binary.
objcopy --only-keep-debug binary debug
# Copy the full debuginfo, keeping only a minimal set of symbols and
# removing some unnecessary sections.
objcopy -S --remove-section .gdb_index --remove-section .comment
--keep-symbols=keep_symbols debug mini_debuginfo
# Drop the full debug info from the original binary.
strip --strip-all -R .comment binary
# Inject the compressed data into the .gnu_debugdata section of the
# original binary.
xz mini_debuginfo
objcopy --add-section .gnu_debugdata=mini_debuginfo.xz binary
18.5 Index Files Speed Up GDB
When GDB finds a symbol file, it scans the symbols in the
file in order to construct an internal symbol table. This lets most
GDB operations work quickly—at the cost of a delay early
on. For large programs, this delay can be quite lengthy, so
GDB provides a way to build an index, which speeds up
startup.
For convenience, GDB comes with a program,
gdb-add-index, which can be used to add the index to a
symbol file. It takes the symbol file as its only argument:
See gdb-add-index.
It is also possible to do the work manually. Here is what
gdb-add-index does behind the curtains.
The index is stored as a section in the symbol file. GDB can
write the index to a file, then you can put it into the symbol file
using objcopy.
To create an index file, use the save gdb-index command:
save gdb-index [-dwarf-5] directory-
Create index files for all symbol files currently known by
GDB. For each known symbol-file, this command by
default creates it produces a single file
symbol-file.gdb-index. If you invoke this command with
the -dwarf-5 option, it produces 2 files:
symbol-file.debug_names and
symbol-file.debug_str. The files are created in the
given directory.
Once you have created an index file you can merge it into your symbol
file, here named symfile, using objcopy:
$ objcopy --add-section .gdb_index=symfile.gdb-index
--set-section-flags .gdb_index=readonly symfile symfile
Or for -dwarf-5:
$ objcopy --dump-section .debug_str=symfile.debug_str.new symfile
$ cat symfile.debug_str >>symfile.debug_str.new
$ objcopy --add-section .debug_names=symfile.gdb-index
--set-section-flags .debug_names=readonly
--update-section .debug_str=symfile.debug_str.new symfile symfile
GDB will normally ignore older versions of .gdb_index
sections that have been deprecated. Usually they are deprecated because
they are missing a new feature or have performance issues.
To tell GDB to use a deprecated index section anyway
specify set use-deprecated-index-sections on.
The default is off.
This can speed up startup, but may result in some functionality being lost.
See Index Section Format.
Warning: Setting use-deprecated-index-sections to on
must be done before gdb reads the file. The following will not work:
$ gdb -ex "set use-deprecated-index-sections on" <program>
Instead you must do, for example,
$ gdb -iex "set use-deprecated-index-sections on" <program>
Indices only work when using DWARF debugging information, not stabs.
18.5.1 Automatic symbol index cache
It is possible for GDB to automatically save a copy of this index in a
cache on disk and retrieve it from there when loading the same binary in the
future. This feature can be turned on with set index-cache enabled on.
The following commands can be used to tweak the behavior of the index cache.
set index-cache enabled onset index-cache enabled off-
Enable or disable the use of the symbol index cache.
set index-cache directory directoryshow index-cache directory-
Set/show the directory where index files will be saved.
The default value for this directory depends on the host platform. On
most systems, the index is cached in the gdb subdirectory of
the directory pointed to by theXDG_CACHE_HOMEenvironment
variable, if it is defined, else in the .cache/gdb subdirectory
of your home directory. However, on some systems, the default may
differ according to local convention.There is no limit on the disk space used by index cache. It is perfectly safe
to delete the content of that directory to free up disk space. show index-cache stats-
Print the number of cache hits and misses since the launch of GDB.
18.6 Errors Reading Symbol Files
While reading a symbol file, GDB occasionally encounters problems,
such as symbol types it does not recognize, or known bugs in compiler
output. By default, GDB does not notify you of such problems, since
they are relatively common and primarily of interest to people
debugging compilers. If you are interested in seeing information
about ill-constructed symbol tables, you can either ask GDB to print
only one message about each such type of problem, no matter how many
times the problem occurs; or you can ask GDB to print more messages,
to see how many times the problems occur, with the set command (see Optional Warnings and
complaints
Messages).
The messages currently printed, and their meanings, include:
inner block not inside outer block in symbol-
The symbol information shows where symbol scopes begin and end
(such as at the start of a function or a block of statements). This
error indicates that an inner scope block is not fully contained
in its outer scope blocks.GDB circumvents the problem by treating the inner block as if it had
the same scope as the outer block. In the error message, symbol
may be shown as “(don't know)” if the outer block is not a
function. block at address out of order-
The symbol information for symbol scope blocks should occur in
order of increasing addresses. This error indicates that it does not
do so.GDB does not circumvent this problem, and has trouble
locating symbols in the source file whose symbols it is reading. (You
can often determine what source file is affected by specifying
set verbose on. See Optional Warnings and
Messages.) bad block start address patched-
The symbol information for a symbol scope block has a start address
smaller than the address of the preceding source line. This is known
to occur in the SunOS 4.1.1 (and earlier) C compiler.GDB circumvents the problem by treating the symbol scope block as
starting on the previous source line. bad string table offset in symbol n-
Symbol number n contains a pointer into the string table which is
larger than the size of the string table.GDB circumvents the problem by considering the symbol to have the
namefoo, which may cause other problems if many symbols end up
with this name. unknown symbol type0xnn-
The symbol information contains new data types that GDB does
not yet know how to read.0xnnis the symbol type of the
uncomprehended information, in hexadecimal.GDB circumvents the error by ignoring this symbol information.
This usually allows you to debug your program, though certain symbols
are not accessible. If you encounter such a problem and feel like
debugging it, you can debuggdbwith itself, breakpoint
oncomplain, then go up to the functionread_dbx_symtab
and examine*bufpto see the symbol. stub type has NULL name-
GDB could not find the full definition for a struct or class.
const/volatile indicator missing (ok if using g++ v1.x), got…-
The symbol information for a C++ member function is missing some
information that recent versions of the compiler should have output for
it. info mismatch between compiler and debugger-
GDB could not parse a type specification output by the compiler.
18.7 GDB Data Files
GDB will sometimes read an auxiliary data file. These files
are kept in a directory known as the data directory.
You can set the data directory’s name, and view the name GDB
is currently using.
set data-directory directory-
Set the directory which GDB searches for auxiliary data files
to directory. show data-directory-
Show the directory GDB searches for auxiliary data files.
You can set the default data directory by using the configure-time
‘—with-gdb-datadir’ option. If the data directory is inside
GDB’s configured binary prefix (set with ‘—prefix’ or
‘—exec-prefix’), then the default data directory will be updated
automatically if the installed GDB is moved to a new
location.
The data directory may also be specified with the
--data-directory command line option.
See Mode Options.
19 Specifying a Debugging Target
A target is the execution environment occupied by your program.
Often, GDB runs in the same host environment as your program;
in that case, the debugging target is specified as a side effect when
you use the file or core commands. When you need more
flexibility—for example, running GDB on a physically separate
host, or controlling a standalone system over a serial port or a
realtime system over a TCP/IP connection—you can use the target
command to specify one of the target types configured for GDB
(see Commands for Managing Targets).
It is possible to build GDB for several different target
architectures. When GDB is built like that, you can choose
one of the available architectures with the set architecture
command.
set architecture arch-
This command sets the current target architecture to arch. The
value of arch can be"auto", in addition to one of the
supported architectures. show architecture-
Show the current target architecture.
set processorprocessor-
These are alias commands for, respectively,
set architecture
andshow architecture.
19.1 Active Targets
There are multiple classes of targets such as: processes, executable files or
recording sessions. Core files belong to the process class, making core file
and process mutually exclusive. Otherwise, GDB can work concurrently
on multiple active targets, one in each class. This allows you to (for
example) start a process and inspect its activity, while still having access to
the executable file after the process finishes. Or if you start process
recording (see Reverse Execution) and reverse-step there, you are
presented a virtual layer of the recording target, while the process target
remains stopped at the chronologically last point of the process execution.
Use the core-file and exec-file commands to select a new core
file or executable target (see Commands to Specify Files). To
specify as a target a process that is already running, use the attach
command (see Debugging an Already-running Process).
19.2 Commands for Managing Targets
target type parameters-
Connects the GDB host environment to a target machine or
process. A target is typically a protocol for talking to debugging
facilities. You use the argument type to specify the type or
protocol of the target machine.Further parameters are interpreted by the target protocol, but
typically include things like device names or host names to connect
with, process numbers, and baud rates.The
targetcommand does not repeat if you press RET again
after executing the command. help target-
Displays the names of all targets available. To display targets
currently selected, use eitherinfo targetorinfo files
(see Commands to Specify Files). help target name-
Describe a particular target, including any parameters necessary to
select it. set gnutarget args-
GDB uses its own library BFD to read your files. GDB
knows whether it is reading an executable,
a core, or a .o file; however, you can specify the file format
with theset gnutargetcommand. Unlike mosttargetcommands,
withgnutargetthetargetrefers to a program, not a machine.Warning: To specify a file format with
set gnutarget,
you must know the actual BFD name.See Commands to Specify Files.
show gnutarget-
Use the
show gnutargetcommand to display what file format
gnutargetis set to read. If you have not setgnutarget,
GDB will determine the file format for each file automatically,
andshow gnutargetdisplays ‘The current BFD target is «auto»’.
Here are some common targets (available, or not, depending on the GDB
configuration):
target exec program-
An executable file. ‘target exec program’ is the same as
‘exec-file program’. target core filename-
A core dump file. ‘target core filename’ is the same as
‘core-file filename’. target remote medium-
A remote system connected to GDB via a serial line or network
connection. This command tells GDB to use its own remote
protocol over medium for debugging. See Remote Debugging.For example, if you have a board connected to /dev/ttya on the
machine running GDB, you could say:target remotesupports theloadcommand. This is only
useful if you have some other way of getting the stub to the target
system, and you can put it somewhere in memory where it won’t get
clobbered by the download. target sim [simargs] …-
Builtin CPU simulator. GDB includes simulators for most architectures.
In general,works; however, you cannot assume that a specific memory map, device
drivers, or even basic I/O is available, although some simulators do
provide these. For info about any processor-specific simulator details,
see the appropriate section in Embedded
Processors. target native-
Setup for local/native process debugging. Useful to make the
runcommand spawn native processes (likewiseattach,
etc.) even whenset auto-connect-native-targetisoff
(see set auto-connect-native-target).
Different targets are available on different configurations of GDB;
your configuration may have more or fewer targets.
Many remote targets require you to download the executable’s code once
you’ve successfully established a connection. You may wish to control
various aspects of this process.
set hash-
This command controls whether a hash mark ‘#’ is displayed while
downloading a file to the remote monitor. If on, a hash mark is
displayed after each S-record is successfully downloaded to the
monitor. show hash-
Show the current status of displaying the hash mark.
set debug monitor-
Enable or disable display of communications messages between
GDB and the remote monitor. show debug monitor-
Show the current status of displaying communications between
GDB and the remote monitor.
load filename offset-
Depending on what remote debugging facilities are configured into
GDB, theloadcommand may be available. Where it exists, it
is meant to make filename (an executable) available for debugging
on the remote system—by downloading, or dynamic linking, for example.
loadalso records the filename symbol table in GDB, like
theadd-symbol-filecommand.If your GDB does not have a
loadcommand, attempting to
execute it gets the error message “You can't do that when your”
target is …The file is loaded at whatever address is specified in the executable.
For some object file formats, you can specify the load address when you
link the program; for other formats, like a.out, the object file format
specifies a fixed address.It is also possible to tell GDB to load the executable file at a
specific offset described by the optional argument offset. When
offset is provided, filename must also be provided.Depending on the remote side capabilities, GDB may be able to
load programs into flash memory.loaddoes not repeat if you press RET again after using it.
flash-erase-
Erases all known flash memory regions on the target.
19.3 Choosing Target Byte Order
Some types of processors, such as the MIPS, PowerPC, and Renesas SH,
offer the ability to run either big-endian or little-endian byte
orders. Usually the executable or symbol will include a bit to
designate the endian-ness, and you will not need to worry about
which to use. However, you may still find it useful to adjust
GDB’s idea of processor endian-ness manually.
set endian big-
Instruct GDB to assume the target is big-endian.
set endian little-
Instruct GDB to assume the target is little-endian.
set endian auto-
Instruct GDB to use the byte order associated with the
executable. show endian-
Display GDB’s current idea of the target byte order.
If the set endian auto mode is in effect and no executable has
been selected, then the endianness used is the last one chosen either
by one of the set endian big and set endian little
commands or by inferring from the last executable used. If no
endianness has been previously chosen, then the default for this mode
is inferred from the target GDB has been built for, and is
little if the name of the target CPU has an el suffix
and big otherwise.
Note that these commands merely adjust interpretation of symbolic
data on the host, and that they have absolutely no effect on the
target system.
20 Debugging Remote Programs
If you are trying to debug a program running on a machine that cannot run
GDB in the usual way, it is often useful to use remote debugging.
For example, you might use remote debugging on an operating system kernel,
or on a small system which does not have a general purpose operating system
powerful enough to run a full-featured debugger.
Some configurations of GDB have special serial or TCP/IP interfaces
to make this work with particular debugging targets. In addition,
GDB comes with a generic serial protocol (specific to GDB,
but not specific to any particular target system) which you can use if you
write the remote stubs—the code that runs on the remote system to
communicate with GDB.
Other remote targets may be available in your
configuration of GDB; use help target to list them.
20.1 Connecting to a Remote Target
This section describes how to connect to a remote target, including the
types of connections and their differences, how to set up executable and
symbol files on the host and target, and the commands used for
connecting to and disconnecting from the remote target.
20.1.1 Types of Remote Connections
GDB supports two types of remote connections, target remote
mode and target extended-remote mode. Note that many remote targets
support only target remote mode. There are several major
differences between the two types of connections, enumerated here:
- Result of detach or program exit
-
With target remote mode: When the debugged program exits or you
detach from it, GDB disconnects from the target. When using
gdbserver,gdbserverwill exit.With target extended-remote mode: When the debugged program exits or
you detach from it, GDB remains connected to the target, even
though no program is running. You can rerun the program, attach to a
running program, or usemonitorcommands specific to the target.When using
gdbserverin this case, it does not exit unless it was
invoked using the —once option. If the —once option
was not used, you can askgdbserverto exit using the
monitor exitcommand (see Monitor Commands for gdbserver). - Specifying the program to debug
-
For both connection types you use the
filecommand to specify the
program on the host system. If you are usinggdbserverthere are
some differences in how to specify the location of the program on the
target.With target remote mode: You must either specify the program to debug
on thegdbservercommand line or use the —attach option
(see Attaching to a Running Program).With target extended-remote mode: You may specify the program to debug
on thegdbservercommand line, or you can load the program or attach
to it using GDB commands after connecting togdbserver.You can start
gdbserverwithout supplying an initial command to run
or process ID to attach. To do this, use the —multi command line
option. Then you can connect usingtarget extended-remoteand start
the program you want to debug (see below for details on using the
runcommand in this scenario). Note that the conditions under which
gdbserverterminates depend on how GDB connects to it
(target remoteortarget extended-remote). The
—multi option togdbserverhas no influence on that. - The
runcommand -
With target remote mode: The
runcommand is not
supported. Once a connection has been established, you can use all
the usual GDB commands to examine and change data. The
remote program is already running, so you can use commands like
step and continue.With target extended-remote mode: The
runcommand is
supported. Theruncommand uses the value set by
set remote exec-file(see set remote exec-file) to select
the program to run. Command line arguments are supported, except for
wildcard expansion and I/O redirection (see Arguments).If you specify the program to debug on the command line, then the
runcommand is not required to start execution, and you can
resume using commands like step and continue as with
target remotemode. - Attaching
-
With target remote mode: The GDB command
attachis
not supported. To attach to a running program usinggdbserver, you
must use the —attach option (see Running gdbserver).With target extended-remote mode: To attach to a running program,
you may use theattachcommand after the connection has been
established. If you are usinggdbserver, you may also invoke
gdbserverusing the —attach option
(see Running gdbserver).Some remote targets allow GDB to determine the executable file running
in the process the debugger is attaching to. In such a case, GDB
uses the value ofexec-file-mismatchto handle a possible mismatch
between the executable file name running in the process and the name of the
current exec-file loaded by GDB (see set exec-file-mismatch).
20.1.2 Host and Target Files
GDB, running on the host, needs access to symbol and debugging
information for your program running on the target. This requires
access to an unstripped copy of your program, and possibly any associated
symbol files. Note that this section applies equally to both target mode and
remotetarget extended-remote mode.
Some remote targets (see qXfer executable filename read, and
see Host I/O Packets) allow GDB to access program files over
the same connection used to communicate with GDB. With such a
target, if the remote program is unstripped, the only command you need is
target remote (or target extended-remote).
If the remote program is stripped, or the target does not support remote
program file access, start up GDB using the name of the local
unstripped copy of your program as the first argument, or use the
file command. Use set sysroot to specify the location (on
the host) of target libraries (unless your GDB was compiled with
the correct sysroot using --with-sysroot). Alternatively, you
may use set solib-search-path to specify how GDB locates
target libraries.
The symbol file and target libraries must exactly match the executable
and libraries on the target, with one exception: the files on the host
system should not be stripped, even if the files on the target system
are. Mismatched or missing files will lead to confusing results
during debugging. On GNU/Linux targets, mismatched or missing
files may also prevent gdbserver from debugging multi-threaded
programs.
20.1.3 Remote Connection Commands
GDB can communicate with the target over a serial line, a
local Unix domain socket, or
over an IP network using TCP or UDP. In
each case, GDB uses the same protocol for debugging your
program; only the medium carrying the debugging packets varies. The
target remote and target extended-remote commands
establish a connection to the target. Both commands accept the same
arguments, which indicate the medium to use:
target remote serial-devicetarget extended-remote serial-device-
Use serial-device to communicate with the target. For example,
to use a serial line connected to the device named /dev/ttyb:If you’re using a serial line, you may want to give GDB the
‘—baud’ option, or use theset serial baudcommand
(see set serial baud) before the
targetcommand. target remote local-sockettarget extended-remote local-socket-
Use local-socket to communicate with the target. For example,
to use a local Unix domain socket bound to the file system entry /tmp/gdb-socket0:target remote /tmp/gdb-socket0
Note that this command has the same form as the command to connect
to a serial line. GDB will automatically determine which
kind of file you have specified and will make the appropriate kind
of connection.
This feature is not available if the host system does not support
Unix domain sockets. target remotehost:porttarget remote[host]:porttarget remotetcp:host:porttarget remotetcp:[host]:porttarget remotetcp4:host:porttarget remotetcp6:host:porttarget remotetcp6:[host]:porttarget extended-remotehost:porttarget extended-remote[host]:porttarget extended-remotetcp:host:porttarget extended-remotetcp:[host]:porttarget extended-remotetcp4:host:porttarget extended-remotetcp6:host:porttarget extended-remotetcp6:[host]:port-
Debug using a TCP connection to port on host.
The host may be either a host name, a numeric IPv4
address, or a numeric IPv6 address (with or without the
square brackets to separate the address from the port); port
must be a decimal number. The host could be the target machine
itself, if it is directly connected to the net, or it might be a
terminal server which in turn has a serial line to the target.For example, to connect to port 2828 on a terminal server named
manyfarms:target remote manyfarms:2828
To connect to port 2828 on a terminal server whose address is
2001:0db8:85a3:0000:0000:8a2e:0370:7334, you can either use the
square bracket syntax:target remote [2001:0db8:85a3:0000:0000:8a2e:0370:7334]:2828
or explicitly specify the IPv6 protocol:
target remote tcp6:2001:0db8:85a3:0000:0000:8a2e:0370:7334:2828
This last example may be confusing to the reader, because there is no
visible separation between the hostname and the port number.
Therefore, we recommend the user to provide IPv6 addresses
using square brackets for clarity. However, it is important to
mention that for GDB there is no ambiguity: the number after
the last colon is considered to be the port number.If your remote target is actually running on the same machine as your
debugger session (e.g. a simulator for your target running on the
same host), you can omit the hostname. For example, to connect to
port 1234 on your local machine:Note that the colon is still required here.
target remoteudp:host:porttarget remoteudp:[host]:porttarget remoteudp4:host:porttarget remoteudp6:[host]:porttarget extended-remoteudp:host:porttarget extended-remoteudp:host:porttarget extended-remoteudp:[host]:porttarget extended-remoteudp4:host:porttarget extended-remoteudp6:host:porttarget extended-remoteudp6:[host]:port-
Debug using UDP packets to port on host. For example, to
connect to UDP port 2828 on a terminal server namedmanyfarms:target remote udp:manyfarms:2828
When using a UDP connection for remote debugging, you should
keep in mind that the ‘U’ stands for “Unreliable”. UDP
can silently drop packets on busy or unreliable networks, which will
cause havoc with your debugging session. target remote | commandtarget extended-remote | command-
Run command in the background and communicate with it using a
pipe. The command is a shell command, to be parsed and expanded
by the system’s command shell,/bin/sh; it should expect remote
protocol packets on its standard input, and send replies on its
standard output. You could use this to run a stand-alone simulator
that speaks the remote debugging protocol, to make net connections
using programs likessh, or for other similar tricks.If command closes its standard output (perhaps by exiting),
GDB will try to send it aSIGTERMsignal. (If the
program has already exited, this will have no effect.)
Whenever GDB is waiting for the remote program, if you type the
interrupt character (often Ctrl-c), GDB attempts to stop the
program. This may or may not succeed, depending in part on the hardware
and the serial drivers the remote system uses. If you type the
interrupt character once again, GDB displays this prompt:
Interrupted while waiting for the program. Give up (and stop debugging it)? (y or n)
In target remote mode, if you type y, GDB abandons
the remote debugging session. (If you decide you want to try again later,
you can use target remote again to connect once more.) If you type
n, GDB goes back to waiting.
In target extended-remote mode, typing n will leave
GDB connected to the target.
detach-
When you have finished debugging the remote program, you can use the
detachcommand to release it from GDB control.
Detaching from the target normally resumes its execution, but the results
will depend on your particular remote stub. After thedetach
command intarget remotemode, GDB is free to connect to
another target. Intarget extended-remotemode, GDB is
still connected to the target. disconnect-
The
disconnectcommand closes the connection to the target, and
the target is generally not resumed. It will wait for GDB
(this instance or another one) to connect and continue debugging. After
thedisconnectcommand, GDB is again free to connect to
another target. monitor cmd-
This command allows you to send arbitrary commands directly to the
remote monitor. Since GDB doesn’t care about the commands it
sends like this, this command is the way to extend GDB—you
can add new commands that only the external monitor will understand
and implement.
20.2 Sending files to a remote system
Some remote targets offer the ability to transfer files over the same
connection used to communicate with GDB. This is convenient
for targets accessible through other means, e.g. GNU/Linux systems
running gdbserver over a network interface. For other targets,
e.g. embedded devices with only a single serial port, this may be
the only way to upload or download files.
Not all remote targets support these commands.
remote put hostfile targetfile-
Copy file hostfile from the host system (the machine running
GDB) to targetfile on the target system. remote get targetfile hostfile-
Copy file targetfile from the target system to hostfile
on the host system. remote delete targetfile-
Delete targetfile from the target system.
20.3 Using the gdbserver Program
gdbserver is a control program for Unix-like systems, which
allows you to connect your program with a remote GDB via
target remote or target extended-remote—but without
linking in the usual debugging stub.
gdbserver is not a complete replacement for the debugging stubs,
because it requires essentially the same operating-system facilities
that GDB itself does. In fact, a system that can run
gdbserver to connect to a remote GDB could also run
GDB locally! gdbserver is sometimes useful nevertheless,
because it is a much smaller program than GDB itself. It is
also easier to port than all of GDB, so you may be able to get
started more quickly on a new system by using gdbserver.
Finally, if you develop code for real-time systems, you may find that
the tradeoffs involved in real-time operation make it more convenient to
do as much development work as possible on another system, for example
by cross-compiling. You can use gdbserver to make a similar
choice for debugging.
GDB and gdbserver communicate via either a serial line
or a TCP connection, using the standard GDB remote serial
protocol.
Warning:
gdbserverdoes not have any built-in security.
Do not rungdbserverconnected to any public network; a
GDB connection togdbserverprovides access to the
target system with the same privileges as the user running
gdbserver.
20.3.1 Running gdbserver
Run gdbserver on the target system. You need a copy of the
program you want to debug, including any libraries it requires.
gdbserver does not need your program’s symbol table, so you can
strip the program if necessary to save space. GDB on the host
system does all the symbol handling.
To use the server, you must tell it how to communicate with GDB;
the name of your program; and the arguments for your program. The usual
syntax is:
target> gdbserver comm program [ args … ]
comm is either a device name (to use a serial line), or a TCP
hostname and portnumber, or - or stdio to use
stdin/stdout of gdbserver.
For example, to debug Emacs with the argument
‘foo.txt’ and communicate with GDB over the serial port
/dev/com1:
target> gdbserver /dev/com1 emacs foo.txt
gdbserver waits passively for the host GDB to communicate
with it.
To use a TCP connection instead of a serial line:
target> gdbserver host:2345 emacs foo.txt
The only difference from the previous example is the first argument,
specifying that you are communicating with the host GDB via
TCP. The ‘host:2345’ argument means that gdbserver is to
expect a TCP connection from machine ‘host’ to local TCP port 2345.
(Currently, the ‘host’ part is ignored.) You can choose any number
you want for the port number as long as it does not conflict with any
TCP ports already in use on the target system (for example, 23 is
reserved for telnet).16 You must use the same port number with the host GDB
target remote command.
The stdio connection is useful when starting gdbserver
with ssh:
(gdb) target remote | ssh -T hostname gdbserver - hello
The ‘-T’ option to ssh is provided because we don’t need a remote pty,
and we don’t want escape-character handling. Ssh does this by default when
a command is provided, the flag is provided to make it explicit.
You could elide it if you want to.
Programs started with stdio-connected gdbserver have /dev/null for
stdin, and stdout,stderr are sent back to gdb for
display through a pipe connected to gdbserver.
Both stdout and stderr use the same pipe.
20.3.1.1 Attaching to a Running Program
On some targets, gdbserver can also attach to running programs.
This is accomplished via the --attach argument. The syntax is:
target> gdbserver --attach comm pid
pid is the process ID of a currently running process. It isn’t
necessary to point gdbserver at a binary for the running process.
In target extended-remote mode, you can also attach using the
GDB attach command
(see Attaching in Types of Remote Connections).
You can debug processes by name instead of process ID if your target has the
pidof utility:
target> gdbserver --attach comm `pidof program`
In case more than one copy of program is running, or program
has multiple threads, most versions of pidof support the
-s option to only return the first process ID.
20.3.1.2 TCP port allocation lifecycle of gdbserver
This section applies only when gdbserver is run to listen on a TCP
port.
gdbserver normally terminates after all of its debugged processes have
terminated in target remote mode. On the other hand, for target
extended-remote, gdbserver stays running even with no processes left.
GDB normally terminates the spawned debugged process on its exit,
which normally also terminates gdbserver in the target remote
mode. Therefore, when the connection drops unexpectedly, and GDB
cannot ask gdbserver to kill its debugged processes, gdbserver
stays running even in the target remote mode.
When gdbserver stays running, GDB can connect to it again later.
Such reconnecting is useful for features like disconnected tracing. For
completeness, at most one GDB can be connected at a time.
By default, gdbserver keeps the listening TCP port open, so that
subsequent connections are possible. However, if you start gdbserver
with the —once option, it will stop listening for any further
connection attempts after connecting to the first GDB session. This
means no further connections to gdbserver will be possible after the
first one. It also means gdbserver will terminate after the first
connection with remote GDB has closed, even for unexpectedly closed
connections and even in the target extended-remote mode. The
—once option allows reusing the same port number for connecting to
multiple instances of gdbserver running on the same host, since each
instance closes its port after the first connection.
20.3.1.3 Other Command-Line Arguments for gdbserver
You can use the —multi option to start gdbserver without
specifying a program to debug or a process to attach to. Then you can
attach in target extended-remote mode and run or attach to a
program. For more information,
see —multi Option in Types of Remote Connnections.
The —debug option tells gdbserver to display extra
status information about the debugging process.
The —remote-debug option tells gdbserver to display
remote protocol debug output.
The —debug-file=filename option tells gdbserver to
write any debug output to the given filename. These options are intended
for gdbserver development and for bug reports to the developers.
The —debug-format=option1[,option2,…] option tells
gdbserver to include additional information in each output.
Possible options are:
none-
Turn off all extra information in debugging output.
all-
Turn on all extra information in debugging output.
timestamps-
Include a timestamp in each line of debugging output.
Options are processed in order. Thus, for example, if none
appears last then no additional information is added to debugging output.
The —wrapper option specifies a wrapper to launch programs
for debugging. The option should be followed by the name of the
wrapper, then any command-line arguments to pass to the wrapper, then
-- indicating the end of the wrapper arguments.
gdbserver runs the specified wrapper program with a combined
command line including the wrapper arguments, then the name of the
program to debug, then any arguments to the program. The wrapper
runs until it executes your program, and then GDB gains control.
You can use any program that eventually calls execve with
its arguments as a wrapper. Several standard Unix utilities do
this, e.g. env and nohup. Any Unix shell script ending
with exec "$@" will also work.
For example, you can use env to pass an environment variable to
the debugged program, without setting the variable in gdbserver’s
environment:
$ gdbserver --wrapper env LD_PRELOAD=libtest.so -- :2222 ./testprog
The —selftest option runs the self tests in gdbserver:
$ gdbserver --selftest Ran 2 unit tests, 0 failed
These tests are disabled in release.
20.3.2 Connecting to gdbserver
The basic procedure for connecting to the remote target is:
- Run GDB on the host system.
- Make sure you have the necessary symbol files
(see Host and target files).
Load symbols for your application using thefilecommand before you
connect. Useset sysrootto locate target libraries (unless your
GDB was compiled with the correct sysroot using
--with-sysroot). - Connect to your target (see Connecting to a Remote Target).
For TCP connections, you must start upgdbserverprior to using
thetargetcommand. Otherwise you may get an error whose
text depends on the host system, but which usually looks something like
‘Connection refused’. Don’t use theload
command in GDB when usingtarget remotemode, since the
program is already on the target.
20.3.3 Monitor Commands for gdbserver
During a GDB session using gdbserver, you can use the
monitor command to send special requests to gdbserver.
Here are the available commands.
monitor help-
List the available monitor commands.
monitor set debug 0monitor set debug 1-
Disable or enable general debugging messages.
monitor set remote-debug 0monitor set remote-debug 1-
Disable or enable specific debugging messages associated with the remote
protocol (see Remote Protocol). monitor set debug-file filenamemonitor set debug-file-
Send any debug output to the given file, or to stderr.
monitor set debug-format option1[,option2,...]-
Specify additional text to add to debugging messages.
Possible options are:none-
Turn off all extra information in debugging output.
all-
Turn on all extra information in debugging output.
timestamps-
Include a timestamp in each line of debugging output.
Options are processed in order. Thus, for example, if none
appears last then no additional information is added to debugging output. monitor set libthread-db-search-path [PATH]-
When this command is issued, path is a colon-separated list of
directories to search forlibthread_db(see set
libthread-db-search-path). If you omit path,
‘libthread-db-search-path’ will be reset to its default value.The special entry ‘$pdir’ for ‘libthread-db-search-path’ is
not supported ingdbserver. monitor exit-
Tell gdbserver to exit immediately. This command should be followed by
disconnectto close the debugging session.gdbserverwill
detach from any attached processes and kill any processes it created.
Usemonitor exitto terminategdbserverat the end
of a multi-process mode debug session.
20.3.4 Tracepoints support in gdbserver
On some targets, gdbserver supports tracepoints, fast
tracepoints and static tracepoints.
For fast or static tracepoints to work, a special library called the
in-process agent (IPA), must be loaded in the inferior process.
This library is built and distributed as an integral part of
gdbserver. In addition, support for static tracepoints
requires building the in-process agent library with static tracepoints
support. At present, the UST (LTTng Userspace Tracer,
http://lttng.org/ust) tracing engine is supported. This support
is automatically available if UST development headers are found in the
standard include path when gdbserver is built, or if
gdbserver was explicitly configured using —with-ust
to point at such headers. You can explicitly disable the support
using —with-ust=no.
There are several ways to load the in-process agent in your program:
Specifying it as dependency at link time-
You can link your program dynamically with the in-process agent
library. On most systems, this is accomplished by adding
-linproctraceto the link command. Using the system's preloading mechanisms-
You can force loading the in-process agent at startup time by using
your system’s support for preloading shared libraries. Many Unixes
support the concept of preloading user defined libraries. In most
cases, you do that by specifyingLD_PRELOAD=libinproctrace.so
in the environment. See also the description ofgdbserver’s
—wrapper command line option. Using GDB to force loading the agent at run time-
On some systems, you can force the inferior to load a shared library,
by calling a dynamic loader function in the inferior that takes care
of dynamically looking up and loading a shared library. On most Unix
systems, the function isdlopen. You’ll use thecall
command for that. For example:(gdb) call dlopen ("libinproctrace.so", ...)Note that on most Unix systems, for the
dlopenfunction to be
available, the program needs to be linked with-ldl.
On systems that have a userspace dynamic loader, like most Unix
systems, when you connect to gdbserver using target, you’ll find that the program is stopped at the dynamic
remote
loader’s entry point, and no shared library has been loaded in the
program’s address space yet, including the in-process agent. In that
case, before being able to use any of the fast or static tracepoints
features, you need to let the loader run and load the shared
libraries. The simplest way to do that is to run the program to the
main procedure. E.g., if debugging a C or C++ program, start
gdbserver like so:
$ gdbserver :9999 myprogram
Start GDB and connect to gdbserver like so, and run to main:
$ gdb myprogram (gdb) target remote myhost:9999 0x00007f215893ba60 in ?? () from /lib64/ld-linux-x86-64.so.2 (gdb) b main (gdb) continue
The in-process tracing agent library should now be loaded into the
process; you can confirm it with the info sharedlibrary
command, which will list libinproctrace.so as loaded in the
process. You are now ready to install fast tracepoints, list static
tracepoint markers, probe static tracepoints markers, and start
tracing.
20.4 Remote Configuration
This section documents the configuration options available when
debugging remote programs. For the options related to the File I/O
extensions of the remote protocol, see system-call-allowed.
set remoteaddresssize bits-
Set the maximum size of address in a memory packet to the specified
number of bits. GDB will mask off the address bits above
that number, when it passes addresses to the remote target. The
default value is the number of bits in the target’s address. show remoteaddresssize-
Show the current value of remote address size in bits.
set serial baud n-
Set the baud rate for the remote serial I/O to n baud. The
value is used to set the speed of the serial port used for debugging
remote targets. show serial baud-
Show the current speed of the remote connection.
set serial parity parity-
Set the parity for the remote serial I/O. Supported values of parity are:
even,none, andodd. The default isnone. show serial parity-
Show the current parity of the serial port.
set remotebreak-
If set to on, GDB sends a
BREAKsignal to the remote
when you type Ctrl-c to interrupt the program running
on the remote. If set to off, GDB sends the ‘Ctrl-C’
character instead. The default is off, since most remote systems
expect to see ‘Ctrl-C’ as the interrupt signal. show remotebreak-
Show whether GDB sends
BREAKor ‘Ctrl-C’ to
interrupt the remote program. set remoteflow onset remoteflow off-
Enable or disable hardware flow control (
RTS/CTS)
on the serial port used to communicate to the remote target. show remoteflow-
Show the current setting of hardware flow control.
set remotelogbase base-
Set the base (a.k.a. radix) of logging serial protocol
communications to base. Supported values of base are:
ascii,octal, andhex. The default is
ascii. show remotelogbase-
Show the current setting of the radix for logging remote serial
protocol. set remotelogfile file-
Record remote serial communications on the named file. The
default is not to record at all. show remotelogfile-
Show the current setting of the file name on which to record the
serial communications. set remotetimeout num-
Set the timeout limit to wait for the remote target to respond to
num seconds. The default is 2 seconds. show remotetimeout-
Show the current number of seconds to wait for the remote target
responses. set remote hardware-watchpoint-limit limitset remote hardware-breakpoint-limit limit-
Restrict GDB to using limit remote hardware watchpoints
or breakpoints. The limit can be set to 0 to disable hardware
watchpoints or breakpoints, andunlimitedfor unlimited
watchpoints or breakpoints. show remote hardware-watchpoint-limitshow remote hardware-breakpoint-limit-
Show the current limit for the number of hardware watchpoints or
breakpoints that GDB can use. set remote hardware-watchpoint-length-limit limit-
Restrict GDB to using limit bytes for the maximum
length of a remote hardware watchpoint. A limit of 0 disables
hardware watchpoints andunlimitedallows watchpoints of any
length. show remote hardware-watchpoint-length-limit-
Show the current limit (in bytes) of the maximum length of
a remote hardware watchpoint. set remote exec-file filenameshow remote exec-file-
Select the file used for
runwithtarget. This should be set to a filename valid on the
extended-remote
target system. If it is not set, the target will use a default
filename (e.g. the last program run). set remote interrupt-sequence-
Allow the user to select one of ‘Ctrl-C’, a
BREAKor
‘BREAK-g’ as the
sequence to the remote target in order to interrupt the execution.
‘Ctrl-C’ is a default. Some system prefersBREAKwhich
is high level of serial line for some certain time.
Linux kernel prefers ‘BREAK-g’, a.k.a Magic SysRq g.
It isBREAKsignal followed by characterg. show remote interrupt-sequence-
Show which of ‘Ctrl-C’,
BREAKorBREAK-g
is sent by GDB to interrupt the remote program.
BREAK-gis BREAK signal followed bygand
also known as Magic SysRq g. set remote interrupt-on-connect-
Specify whether interrupt-sequence is sent to remote target when
GDB connects to it. This is mostly needed when you debug
Linux kernel. Linux kernel expectsBREAKfollowed byg
which is known as Magic SysRq g in order to connect GDB. show remote interrupt-on-connect-
Show whether interrupt-sequence is sent
to remote target when GDB connects to it. set tcp auto-retry on-
Enable auto-retry for remote TCP connections. This is useful if the remote
debugging agent is launched in parallel with GDB; there is a race
condition because the agent may not become ready to accept the connection
before GDB attempts to connect. When auto-retry is
enabled, if the initial attempt to connect fails, GDB reattempts
to establish the connection using the timeout specified by
set tcp connect-timeout. set tcp auto-retry off-
Do not auto-retry failed TCP connections.
show tcp auto-retry-
Show the current auto-retry setting.
set tcp connect-timeout secondsset tcp connect-timeout unlimited-
Set the timeout for establishing a TCP connection to the remote target to
seconds. The timeout affects both polling to retry failed connections
(enabled byset tcp auto-retry on) and waiting for connections
that are merely slow to complete, and represents an approximate cumulative
value. If seconds isunlimited, there is no timeout and
GDB will keep attempting to establish a connection forever,
unless interrupted with Ctrl-c. The default is 15 seconds. show tcp connect-timeout-
Show the current connection timeout setting.
The GDB remote protocol autodetects the packets supported by
your debugging stub. If you need to override the autodetection, you
can use these commands to enable or disable individual packets. Each
packet can be set to ‘on’ (the remote target supports this
packet), ‘off’ (the remote target does not support this packet),
or ‘auto’ (detect remote target support for this packet). They
all default to ‘auto’. For more information about each packet,
see Remote Protocol.
During normal use, you should not have to use any of these commands.
If you do, that may be a bug in your remote debugging stub, or a bug
in GDB. You may want to report the problem to the
GDB developers.
For each packet name, the command to enable or disable the
packet is set remote name-packet. The available settings
are:
| Command Name | Remote Packet | Related Features |
fetch-register |
p |
info registers |
set-register |
P |
set |
binary-download |
X |
load, set |
read-aux-vector |
qXfer:auxv:read |
info auxv |
symbol-lookup |
qSymbol |
Detecting multiple threads |
attach |
vAttach |
attach |
verbose-resume |
vCont |
Stepping or resuming multiple threads |
run |
vRun |
run |
software-breakpoint |
Z0 |
break |
hardware-breakpoint |
Z1 |
hbreak |
write-watchpoint |
Z2 |
watch |
read-watchpoint |
Z3 |
rwatch |
access-watchpoint |
Z4 |
awatch |
pid-to-exec-file |
qXfer:exec-file:read |
attach, run |
target-features |
qXfer:features:read |
set architecture |
library-info |
qXfer:libraries:read |
info sharedlibrary |
memory-map |
qXfer:memory-map:read |
info mem |
read-sdata-object |
qXfer:sdata:read |
print $_sdata |
read-siginfo-object |
qXfer:siginfo:read |
print $_siginfo |
write-siginfo-object |
qXfer:siginfo:write |
set $_siginfo |
threads |
qXfer:threads:read |
info threads |
get-thread-local- |
qGetTLSAddr |
Displaying __thread variables |
get-thread-information-block-address |
qGetTIBAddr |
Display MS-Windows Thread Information Block. |
search-memory |
qSearch:memory |
find |
supported-packets |
qSupported |
Remote communications parameters |
catch-syscalls |
QCatchSyscalls |
catch syscall |
pass-signals |
QPassSignals |
handle signal |
program-signals |
QProgramSignals |
handle signal |
hostio-close-packet |
vFile:close |
remote get, remote put |
hostio-open-packet |
vFile:open |
remote get, remote put |
hostio-pread-packet |
vFile:pread |
remote get, remote put |
hostio-pwrite-packet |
vFile:pwrite |
remote get, remote put |
hostio-unlink-packet |
vFile:unlink |
remote delete |
hostio-readlink-packet |
vFile:readlink |
Host I/O |
hostio-fstat-packet |
vFile:fstat |
Host I/O |
hostio-setfs-packet |
vFile:setfs |
Host I/O |
noack-packet |
QStartNoAckMode |
Packet acknowledgment |
osdata |
qXfer:osdata:read |
info os |
query-attached |
qAttached |
Querying remote process attach state. |
trace-buffer-size |
QTBuffer:size |
set trace-buffer-size |
trace-status |
qTStatus |
tstatus |
traceframe-info |
qXfer:traceframe-info:read |
Traceframe info |
install-in-trace |
InstallInTrace |
Install tracepoint in tracing |
disable-randomization |
QDisableRandomization |
set disable-randomization |
startup-with-shell |
QStartupWithShell |
set startup-with-shell |
environment-hex-encoded |
QEnvironmentHexEncoded |
set environment |
environment-unset |
QEnvironmentUnset |
unset environment |
environment-reset |
QEnvironmentReset |
Reset the inferior environment (i.e., unset user-set variables) |
set-working-dir |
QSetWorkingDir |
set cwd |
conditional-breakpoints-packet |
Z0 and Z1 |
Support for target-side breakpoint condition evaluation |
multiprocess-extensions |
multiprocess extensions |
Debug multiple processes and remote process PID awareness |
swbreak-feature |
swbreak stop reason |
break |
hwbreak-feature |
hwbreak stop reason |
hbreak |
fork-event-feature |
fork stop reason |
fork |
vfork-event-feature |
vfork stop reason |
vfork |
exec-event-feature |
exec stop reason |
exec |
thread-events |
QThreadEvents |
Tracking thread lifetime. |
no-resumed-stop-reply |
no resumed thread left stop reply |
Tracking thread lifetime. |
20.5 Implementing a Remote Stub
The stub files provided with GDB implement the target side of the
communication protocol, and the GDB side is implemented in the
GDB source file remote.c. Normally, you can simply allow
these subroutines to communicate, and ignore the details. (If you’re
implementing your own stub file, you can still ignore the details: start
with one of the existing stub files. sparc-stub.c is the best
organized, and therefore the easiest to read.)
To debug a program running on another machine (the debugging
target machine), you must first arrange for all the usual
prerequisites for the program to run by itself. For example, for a C
program, you need:
- A startup routine to set up the C runtime environment; these usually
have a name like crt0. The startup routine may be supplied by
your hardware supplier, or you may have to write your own. - A C subroutine library to support your program’s
subroutine calls, notably managing input and output. - A way of getting your program to the other machine—for example, a
download program. These are often supplied by the hardware
manufacturer, but you may have to write your own from hardware
documentation.
The next step is to arrange for your program to use a serial port to
communicate with the machine where GDB is running (the host
machine). In general terms, the scheme looks like this:
- On the host,
-
GDB already understands how to use this protocol; when everything
else is set up, you can simply use the ‘target remote’ command
(see Specifying a Debugging Target). - On the target,
-
you must link with your program a few special-purpose subroutines that
implement the GDB remote serial protocol. The file containing these
subroutines is called a debugging stub.On certain remote targets, you can use an auxiliary program
gdbserverinstead of linking a stub into your program.
See Using thegdbserverProgram, for details.
The debugging stub is specific to the architecture of the remote
machine; for example, use sparc-stub.c to debug programs on
SPARC boards.
These working remote stubs are distributed with GDB:
i386-stub.c-
For Intel 386 and compatible architectures.
m68k-stub.c-
For Motorola 680×0 architectures.
sh-stub.c-
For Renesas SH architectures.
sparc-stub.c-
For SPARC architectures.
sparcl-stub.c-
For Fujitsu SPARCLITE architectures.
The README file in the GDB distribution may list other
recently added stubs.
20.5.1 What the Stub Can Do for You
The debugging stub for your architecture supplies these three
subroutines:
set_debug_traps-
This routine arranges for
handle_exceptionto run when your
program stops. You must call this subroutine explicitly in your
program’s startup code. handle_exception-
This is the central workhorse, but your program never calls it
explicitly—the setup code arranges forhandle_exceptionto
run when a trap is triggered.handle_exceptiontakes control when your program stops during
execution (for example, on a breakpoint), and mediates communications
with GDB on the host machine. This is where the communications
protocol is implemented;handle_exceptionacts as the GDB
representative on the target machine. It begins by sending summary
information on the state of your program, then continues to execute,
retrieving and transmitting any information GDB needs, until you
execute a GDB command that makes your program resume; at that point,
handle_exceptionreturns control to your own code on the target
machine. breakpoint-
Use this auxiliary subroutine to make your program contain a
breakpoint. Depending on the particular situation, this may be the only
way for GDB to get control. For instance, if your target
machine has some sort of interrupt button, you won’t need to call this;
pressing the interrupt button transfers control to
handle_exception—in effect, to GDB. On some machines,
simply receiving characters on the serial port may also trigger a trap;
again, in that situation, you don’t need to callbreakpointfrom
your own program—simply running ‘target remote’ from the host
GDB session gets control.Call
breakpointif none of these is true, or if you simply want
to make certain your program stops at a predetermined point for the
start of your debugging session.
20.5.2 What You Must Do for the Stub
The debugging stubs that come with GDB are set up for a particular
chip architecture, but they have no information about the rest of your
debugging target machine.
First of all you need to tell the stub how to communicate with the
serial port.
int getDebugChar()-
Write this subroutine to read a single character from the serial port.
It may be identical togetcharfor your target system; a
different name is used to allow you to distinguish the two if you wish. void putDebugChar(int)-
Write this subroutine to write a single character to the serial port.
It may be identical toputcharfor your target system; a
different name is used to allow you to distinguish the two if you wish.
If you want GDB to be able to stop your program while it is
running, you need to use an interrupt-driven serial driver, and arrange
for it to stop when it receives a ^C (‘03’, the control-C
character). That is the character which GDB uses to tell the
remote system to stop.
Getting the debugging target to return the proper status to GDB
probably requires changes to the standard stub; one quick and dirty way
is to just execute a breakpoint instruction (the “dirty” part is that
GDB reports a SIGTRAP instead of a SIGINT).
Other routines you need to supply are:
void exceptionHandler (int exception_number, void *exception_address)-
Write this function to install exception_address in the exception
handling tables. You need to do this because the stub does not have any
way of knowing what the exception handling tables on your target system
are like (for example, the processor’s table might be in ROM,
containing entries which point to a table in RAM).
The exception_number specifies the exception which should be changed;
its meaning is architecture-dependent (for example, different numbers
might represent divide by zero, misaligned access, etc). When this
exception occurs, control should be transferred directly to
exception_address, and the processor state (stack, registers,
and so on) should be just as it is when a processor exception occurs. So if
you want to use a jump instruction to reach exception_address, it
should be a simple jump, not a jump to subroutine.For the 386, exception_address should be installed as an interrupt
gate so that interrupts are masked while the handler runs. The gate
should be at privilege level 0 (the most privileged level). The
SPARC and 68k stubs are able to mask interrupts themselves without
help fromexceptionHandler. void flush_i_cache()-
On SPARC and SPARCLITE only, write this subroutine to flush the
instruction cache, if any, on your target machine. If there is no
instruction cache, this subroutine may be a no-op.On target machines that have instruction caches, GDB requires this
function to make certain that the state of your program is stable.
You must also make sure this library routine is available:
void *memset(void *, int, int)-
This is the standard library function
memsetthat sets an area of
memory to a known value. If you have one of the free versions of
libc.a,memsetcan be found there; otherwise, you must
either obtain it from your hardware manufacturer, or write your own.
If you do not use the GNU C compiler, you may need other standard
library subroutines as well; this varies from one stub to another,
but in general the stubs are likely to use any of the common library
subroutines which GCC generates as inline code.
20.5.3 Putting it All Together
In summary, when your program is ready to debug, you must follow these
steps.
- Make sure you have defined the supporting low-level routines
(see What You Must Do for the Stub):getDebugChar,putDebugChar,flush_i_cache,memset,exceptionHandler. - Insert these lines in your program’s startup code, before the main
procedure is called:set_debug_traps(); breakpoint();
On some machines, when a breakpoint trap is raised, the hardware
automatically makes the PC point to the instruction after the
breakpoint. If your machine doesn’t do that, you may need to adjust
handle_exceptionto arrange for it to return to the instruction
after the breakpoint on this first invocation, so that your program
doesn’t keep hitting the initial breakpoint instead of making
progress. - For the 680×0 stub only, you need to provide a variable called
exceptionHook. Normally you just use:void (*exceptionHook)() = 0;
but if before calling
set_debug_traps, you set it to point to a
function in your program, that function is called when
GDBcontinues after stopping on a trap (for example, bus
error). The function indicated byexceptionHookis called with
one parameter: anintwhich is the exception number. - Compile and link together: your program, the GDB debugging stub for
your target architecture, and the supporting subroutines. - Make sure you have a serial connection between your target machine and
the GDB host, and identify the serial port on the host. - Download your program to your target machine (or get it there by
whatever means the manufacturer provides), and start it. - Start GDB on the host, and connect to the target
(see Connecting to a Remote Target).
21 Configuration-Specific Information
While nearly all GDB commands are available for all native and
cross versions of the debugger, there are some exceptions. This chapter
describes things that are only available in certain configurations.
There are three major categories of configurations: native
configurations, where the host and target are the same, embedded
operating system configurations, which are usually the same for several
different processor architectures, and bare embedded processors, which
are quite different from each other.
21.1 Native
This section describes details specific to particular native
configurations.
21.1.1 BSD libkvm Interface
BSD-derived systems (FreeBSD/NetBSD/OpenBSD) have a kernel memory
interface that provides a uniform interface for accessing kernel virtual
memory images, including live systems and crash dumps. GDB
uses this interface to allow you to debug live kernels and kernel crash
dumps on many native BSD configurations. This is implemented as a
special kvm debugging target. For debugging a live system, load
the currently running kernel into GDB and connect to the
kvm target:
For debugging crash dumps, provide the file name of the crash dump as an
argument:
(gdb) target kvm /var/crash/bsd.0
Once connected to the kvm target, the following commands are
available:
kvm pcb-
Set current context from the Process Control Block (PCB) address.
kvm proc-
Set current context from proc address. This command isn’t available on
modern FreeBSD systems.
21.1.2 Process Information
Some operating systems provide interfaces to fetch additional
information about running processes beyond memory and per-thread
register state. If GDB is configured for an operating system
with a supported interface, the command info proc is available
to report information about the process running your program, or about
any process running on your system.
One supported interface is a facility called ‘/proc’ that can be
used to examine the image of a running process using file-system
subroutines. This facility is supported on GNU/Linux and Solaris
systems.
On FreeBSD and NetBSD systems, system control nodes are used to query
process information.
In addition, some systems may provide additional process information
in core files. Note that a core file may include a subset of the
information available from a live process. Process information is
currently available from cores created on GNU/Linux and FreeBSD
systems.
info procinfo proc process-id-
Summarize available information about a process. If a
process ID is specified by process-id, display information about
that process; otherwise display information about the program being
debugged. The summary includes the debugged process ID, the command
line used to invoke it, its current working directory, and its
executable file’s absolute file name.On some systems, process-id can be of the form
‘[pid]/tid’ which specifies a certain thread ID
within a process. If the optional pid part is missing, it means
a thread from the process being debugged (the leading ‘/’ still
needs to be present, or else GDB will interpret the number as
a process ID rather than a thread ID). info proc cmdline-
Show the original command line of the process. This command is
supported on GNU/Linux, FreeBSD and NetBSD. info proc cwd-
Show the current working directory of the process. This command is
supported on GNU/Linux, FreeBSD and NetBSD. info proc exe-
Show the name of executable of the process. This command is supported
on GNU/Linux, FreeBSD and NetBSD. info proc files-
Show the file descriptors open by the process. For each open file
descriptor, GDB shows its number, type (file, directory,
character device, socket), file pointer offset, and the name of the
resource open on the descriptor. The resource name can be a file name
(for files, directories, and devices) or a protocol followed by socket
address (for network connections). This command is supported on
FreeBSD.This example shows the open file descriptors for a process using a
tty for standard input and output as well as two network sockets:(gdb) info proc files 22136 process 22136 Open files: FD Type Offset Flags Name text file - r-------- /usr/bin/ssh ctty chr - rw------- /dev/pts/20 cwd dir - r-------- /usr/home/john root dir - r-------- / 0 chr 0x32933a4 rw------- /dev/pts/20 1 chr 0x32933a4 rw------- /dev/pts/20 2 chr 0x32933a4 rw------- /dev/pts/20 3 socket 0x0 rw----n-- tcp4 10.0.1.2:53014 -> 10.0.1.10:22 4 socket 0x0 rw------- unix stream:/tmp/ssh-FIt89oAzOn5f/agent.2456 info proc mappings-
Report the memory address space ranges accessible in a process. On
Solaris, FreeBSD and NetBSD systems, each memory range includes information
on whether the process has read, write, or execute access rights to each
range. On GNU/Linux, FreeBSD and NetBSD systems, each memory range
includes the object file which is mapped to that range. info proc statinfo proc status-
Show additional process-related information, including the user ID and
group ID; virtual memory usage; the signals that are pending, blocked,
and ignored; its TTY; its consumption of system and user time; its
stack size; its ‘nice’ value; etc. These commands are supported
on GNU/Linux, FreeBSD and NetBSD.For GNU/Linux systems, see the ‘proc’ man page for more
information (type man 5 proc from your shell prompt).For FreeBSD and NetBSD systems,
info proc statis an alias for
info proc status. info proc all-
Show all the information about the process described under all of the
aboveinfo procsubcommands. set procfs-trace-
This command enables and disables tracing of
procfsAPI calls. show procfs-trace-
Show the current state of
procfsAPI call tracing. set procfs-file file-
Tell GDB to write
procfsAPI trace to the named
file. GDB appends the trace info to the previous
contents of the file. The default is to display the trace on the
standard output. show procfs-file-
Show the file to which
procfsAPI trace is written. proc-trace-entryproc-trace-exitproc-untrace-entryproc-untrace-exit-
These commands enable and disable tracing of entries into and exits
from thesyscallinterface. info pidlist-
For QNX Neutrino only, this command displays the list of all the
processes and all the threads within each process. info meminfo-
For QNX Neutrino only, this command displays the list of all mapinfos.
21.1.3 Features for Debugging DJGPP Programs
DJGPP is a port of the GNU development tools to MS-DOS and
MS-Windows. DJGPP programs are 32-bit protected-mode programs
that use the DPMI (DOS Protected-Mode Interface) API to run on
top of real-mode DOS systems and their emulations.
GDB supports native debugging of DJGPP programs, and
defines a few commands specific to the DJGPP port. This
subsection describes those commands.
info dos-
This is a prefix of DJGPP-specific commands which print
information about the target system and important OS structures. info dos sysinfo-
This command displays assorted information about the underlying
platform: the CPU type and features, the OS version and flavor, the
DPMI version, and the available conventional and DPMI memory. info dos gdtinfo dos ldtinfo dos idt-
These 3 commands display entries from, respectively, Global, Local,
and Interrupt Descriptor Tables (GDT, LDT, and IDT). The descriptor
tables are data structures which store a descriptor for each segment
that is currently in use. The segment’s selector is an index into a
descriptor table; the table entry for that index holds the
descriptor’s base address and limit, and its attributes and access
rights.A typical DJGPP program uses 3 segments: a code segment, a data
segment (used for both data and the stack), and a DOS segment (which
allows access to DOS/BIOS data structures and absolute addresses in
conventional memory). However, the DPMI host will usually define
additional segments in order to support the DPMI environment.These commands allow to display entries from the descriptor tables.
Without an argument, all entries from the specified table are
displayed. An argument, which should be an integer expression, means
display a single entry whose index is given by the argument. For
example, here’s a convenient way to display information about the
debugged program’s data segment:(gdb) info dos ldt $ds0x13f: base=0x11970000 limit=0x0009ffff 32-Bit Data (Read/Write, Exp-up)This comes in handy when you want to see whether a pointer is outside
the data segment’s limit (i.e. garbled). info dos pdeinfo dos pte-
These two commands display entries from, respectively, the Page
Directory and the Page Tables. Page Directories and Page Tables are
data structures which control how virtual memory addresses are mapped
into physical addresses. A Page Table includes an entry for every
page of memory that is mapped into the program’s address space; there
may be several Page Tables, each one holding up to 4096 entries. A
Page Directory has up to 4096 entries, one each for every Page Table
that is currently in use.Without an argument, info dos pde displays the entire Page
Directory, and info dos pte displays all the entries in all of
the Page Tables. An argument, an integer expression, given to the
info dos pde command means display only that entry from the Page
Directory table. An argument given to the info dos pte command
means display entries from a single Page Table, the one pointed to by
the specified entry in the Page Directory.These commands are useful when your program uses DMA (Direct
Memory Access), which needs physical addresses to program the DMA
controller.These commands are supported only with some DPMI servers.
info dos address-pte addr-
This command displays the Page Table entry for a specified linear
address. The argument addr is a linear address which should
already have the appropriate segment’s base address added to it,
because this command accepts addresses which may belong to any
segment. For example, here’s how to display the Page Table entry for
the page where a variableiis stored:(gdb) info dos address-pte __djgpp_base_address + (char *)&iPage Table entry for address 0x11a00d30:Base=0x02698000 Dirty Acc. Not-Cached Write-Back Usr Read-Write +0xd30This says that
iis stored at offset0xd30from the page
whose physical base address is0x02698000, and shows all the
attributes of that page.Note that you must cast the addresses of variables to a
char *,
since otherwise the value of__djgpp_base_address, the base
address of all variables and functions in a DJGPP program, will
be added using the rules of C pointer arithmetics: ifiis
declared anint, GDB will add 4 times the value of
__djgpp_base_addressto the address ofi.Here’s another example, it displays the Page Table entry for the
transfer buffer:(gdb) info dos address-pte *((unsigned *)&_go32_info_block + 3)Page Table entry for address 0x29110:Base=0x00029000 Dirty Acc. Not-Cached Write-Back Usr Read-Write +0x110(The
+ 3offset is because the transfer buffer’s address is the
3rd member of the_go32_info_blockstructure.) The output
clearly shows that this DPMI server maps the addresses in conventional
memory 1:1, i.e. the physical (0x00029000+0x110) and
linear (0x29110) addresses are identical.This command is supported only with some DPMI servers.
In addition to native debugging, the DJGPP port supports remote
debugging via a serial data link. The following commands are specific
to remote serial debugging in the DJGPP port of GDB.
set com1base addr-
This command sets the base I/O port address of the COM1 serial
port. set com1irq irq-
This command sets the Interrupt Request (
IRQ) line to use
for the COM1 serial port.There are similar commands ‘set com2base’, ‘set com3irq’,
etc. for setting the port address and theIRQlines for the
other 3 COM ports.The related commands ‘show com1base’, ‘show com1irq’ etc.
display the current settings of the base address and theIRQ
lines used by the COM ports. info serial-
This command prints the status of the 4 DOS serial ports. For each
port, it prints whether it’s active or not, its I/O base address and
IRQ number, whether it uses a 16550-style FIFO, its baudrate, and the
counts of various errors encountered so far.
21.1.4 Features for Debugging MS Windows PE Executables
GDB supports native debugging of MS Windows programs, including
DLLs with and without symbolic debugging information.
MS-Windows programs that call SetConsoleMode to switch off the
special meaning of the ‘Ctrl-C’ keystroke cannot be interrupted
by typing C-c. For this reason, GDB on MS-Windows
supports C-BREAK as an alternative interrupt key
sequence, which can be used to interrupt the debuggee even if it
ignores C-c.
There are various additional Cygwin-specific commands, described in
this section. Working with DLLs that have no debugging symbols is
described in Non-debug DLL Symbols.
info w32-
This is a prefix of MS Windows-specific commands which print
information about the target system and important OS structures. info w32 selector-
This command displays information returned by
the Win32 APIGetThreadSelectorEntryfunction.
It takes an optional argument that is evaluated to
a long value to give the information about this given selector.
Without argument, this command displays information
about the six segment registers. info w32 thread-information-block-
This command displays thread specific information stored in the
Thread Information Block (readable on the X86 CPU family using$fs
selector for 32-bit programs and$gsfor 64-bit programs). signal-event id-
This command signals an event with user-provided id. Used to resume
crashing process when attached to it using MS-Windows JIT debugging (AeDebug).To use it, create or edit the following keys in
HKLMSOFTWAREMicrosoftWindows NTCurrentVersionAeDebugand/or
HKLMSOFTWAREWow6432NodeMicrosoftWindows NTCurrentVersionAeDebug
(for x86_64 versions):- —
Debugger(REG_SZ) — a command to launch the debugger.
Suggested command is:fully-qualified-path-to-gdb.exe -ex.
"attach %ld" -ex "signal-event %ld" -ex "continue"The first
%ldwill be replaced by the process ID of the
crashing process, the second%ldwill be replaced by the ID of
the event that blocks the crashing process, waiting for GDB
to attach. - —
Auto(REG_SZ) — either1or0.1will
make the system run debugger specified by the Debugger key
automatically,0will cause a dialog box with “OK” and
“Cancel” buttons to appear, which allows the user to either
terminate the crashing process (OK) or debug it (Cancel).
- —
set cygwin-exceptions mode-
If mode is
on, GDB will break on exceptions that
happen inside the Cygwin DLL. If mode isoff,
GDB will delay recognition of exceptions, and may ignore some
exceptions which seem to be caused by internal Cygwin DLL
“bookkeeping”. This option is meant primarily for debugging the
Cygwin DLL itself; the default value isoffto avoid annoying
GDB users with falseSIGSEGVsignals. show cygwin-exceptions-
Displays whether GDB will break on exceptions that happen
inside the Cygwin DLL itself. set new-console mode-
If mode is
onthe debuggee will
be started in a new console on next start.
If mode isoff, the debuggee will
be started in the same console as the debugger. show new-console-
Displays whether a new console is used
when the debuggee is started. set new-group mode-
This boolean value controls whether the debuggee should
start a new group or stay in the same group as the debugger.
This affects the way the Windows OS handles
‘Ctrl-C’. show new-group-
Displays current value of new-group boolean.
set debugevents-
This boolean value adds debug output concerning kernel events related
to the debuggee seen by the debugger. This includes events that
signal thread and process creation and exit, DLL loading and
unloading, console interrupts, and debugging messages produced by the
WindowsOutputDebugStringAPI call. set debugexec-
This boolean value adds debug output concerning execute events
(such as resume thread) seen by the debugger. set debugexceptions-
This boolean value adds debug output concerning exceptions in the
debuggee seen by the debugger. set debugmemory-
This boolean value adds debug output concerning debuggee memory reads
and writes by the debugger. set shell-
This boolean values specifies whether the debuggee is called
via a shell or directly (default value is on). show shell-
Displays if the debuggee will be started with a shell.
21.1.4.1 Support for DLLs without Debugging Symbols
Very often on windows, some of the DLLs that your program relies on do
not include symbolic debugging information (for example,
kernel32.dll). When GDB doesn’t recognize any debugging
symbols in a DLL, it relies on the minimal amount of symbolic
information contained in the DLL’s export table. This section
describes working with such symbols, known internally to GDB as
“minimal symbols”.
Note that before the debugged program has started execution, no DLLs
will have been loaded. The easiest way around this problem is simply to
start the program — either by setting a breakpoint or letting the
program run once to completion.
21.1.4.2 DLL Name Prefixes
In keeping with the naming conventions used by the Microsoft debugging
tools, DLL export symbols are made available with a prefix based on the
DLL name, for instance KERNEL32!CreateFileA. The plain name is
also entered into the symbol table, so CreateFileA is often
sufficient. In some cases there will be name clashes within a program
(particularly if the executable itself includes full debugging symbols)
necessitating the use of the fully qualified name when referring to the
contents of the DLL. Use single-quotes around the name to avoid the
exclamation mark (“!”) being interpreted as a language operator.
Note that the internal name of the DLL may be all upper-case, even
though the file name of the DLL is lower-case, or vice-versa. Since
symbols within GDB are case-sensitive this may cause
some confusion. If in doubt, try the info functions and
info variables commands or even maint print msymbols
(see Symbols). Here’s an example:
(gdb) info function CreateFileA All functions matching regular expression "CreateFileA": Non-debugging symbols: 0x77e885f4 CreateFileA 0x77e885f4 KERNEL32!CreateFileA
(gdb) info function ! All functions matching regular expression "!": Non-debugging symbols: 0x6100114c cygwin1!__assert 0x61004034 cygwin1!_dll_crt0@0 0x61004240 cygwin1!dll_crt0(per_process *) [etc...]
21.1.4.3 Working with Minimal Symbols
Symbols extracted from a DLL’s export table do not contain very much
type information. All that GDB can do is guess whether a symbol
refers to a function or variable depending on the linker section that
contains the symbol. Also note that the actual contents of the memory
contained in a DLL are not available unless the program is running. This
means that you cannot examine the contents of a variable or disassemble
a function within a DLL without a running program.
Variables are generally treated as pointers and dereferenced
automatically. For this reason, it is often necessary to prefix a
variable name with the address-of operator (“&”) and provide explicit
type information in the command. Here’s an example of the type of
problem:
(gdb) print 'cygwin1!__argv' 'cygwin1!__argv' has unknown type; cast it to its declared type
(gdb) x 'cygwin1!__argv' 'cygwin1!__argv' has unknown type; cast it to its declared type
And two possible solutions:
(gdb) print ((char **)'cygwin1!__argv')[0] $2 = 0x22fd98 "/cygdrive/c/mydirectory/myprogram"
(gdb) x/2x &'cygwin1!__argv' 0x610c0aa8 <cygwin1!__argv>: 0x10021608 0x00000000 (gdb) x/x 0x10021608 0x10021608: 0x0022fd98 (gdb) x/s 0x0022fd98 0x22fd98: "/cygdrive/c/mydirectory/myprogram"
Setting a break point within a DLL is possible even before the program
starts execution. However, under these circumstances, GDB can’t
examine the initial instructions of the function in order to skip the
function’s frame set-up code. You can work around this by using “*&”
to set the breakpoint at a raw memory address:
(gdb) break *&'python22!PyOS_Readline' Breakpoint 1 at 0x1e04eff0
The author of these extensions is not entirely convinced that setting a
break point within a shared DLL like kernel32.dll is completely
safe.
21.1.5 Commands Specific to GNU Hurd Systems
This subsection describes GDB commands specific to the
GNU Hurd native debugging.
set signalsset sigs-
This command toggles the state of inferior signal interception by
GDB. Mach exceptions, such as breakpoint traps, are not
affected by this command.sigsis a shorthand alias for
signals. show signalsshow sigs-
Show the current state of intercepting inferior’s signals.
set signal-threadset sigthread-
This command tells GDB which thread is the
libcsignal
thread. That thread is run when a signal is delivered to a running
process.set sigthreadis the shorthand alias ofset.
signal-thread show signal-threadshow sigthread-
These two commands show which thread will run when the inferior is
delivered a signal. set stopped-
This commands tells GDB that the inferior process is stopped,
as with theSIGSTOPsignal. The stopped process can be
continued by delivering a signal to it. show stopped-
This command shows whether GDB thinks the debuggee is
stopped. set exceptions-
Use this command to turn off trapping of exceptions in the inferior.
When exception trapping is off, neither breakpoints nor
single-stepping will work. To restore the default, set exception
trapping on. show exceptions-
Show the current state of trapping exceptions in the inferior.
set task pause-
This command toggles task suspension when GDB has control.
Setting it to on takes effect immediately, and the task is suspended
whenever GDB gets control. Setting it to off will take
effect the next time the inferior is continued. If this option is set
to off, you can useset thread default pause onorset(see below) to pause individual threads.
thread pause on show task pause-
Show the current state of task suspension.
set task detach-suspend-count-
This command sets the suspend count the task will be left with when
GDB detaches from it. show task detach-suspend-count-
Show the suspend count the task will be left with when detaching.
set task exception-portset task excp-
This command sets the task exception port to which GDB will
forward exceptions. The argument should be the value of the send
rights of the task.set task excpis a shorthand alias. set noninvasive-
This command switches GDB to a mode that is the least
invasive as far as interfering with the inferior is concerned. This
is the same as usingset task pause,set exceptions, and
set signalsto values opposite to the defaults. info send-rightsinfo receive-rightsinfo port-rightsinfo port-setsinfo dead-namesinfo portsinfo psets-
These commands display information about, respectively, send rights,
receive rights, port rights, port sets, and dead names of a task.
There are also shorthand aliases:info portsforinfoand
port-rightsinfo psetsforinfo port-sets. set thread pause-
This command toggles current thread suspension when GDB has
control. Setting it to on takes effect immediately, and the current
thread is suspended whenever GDB gets control. Setting it to
off will take effect the next time the inferior is continued.
Normally, this command has no effect, since when GDB has
control, the whole task is suspended. However, if you usedset(see above), this command comes in handy to suspend
task pause off
only the current thread. show thread pause-
This command shows the state of current thread suspension.
set thread run-
This command sets whether the current thread is allowed to run.
show thread run-
Show whether the current thread is allowed to run.
set thread detach-suspend-count-
This command sets the suspend count GDB will leave on a
thread when detaching. This number is relative to the suspend count
found by GDB when it notices the thread; useset threadto force it to an absolute value.
takeover-suspend-count show thread detach-suspend-count-
Show the suspend count GDB will leave on the thread when
detaching. set thread exception-portset thread excp-
Set the thread exception port to which to forward exceptions. This
overrides the port set byset task exception-port(see above).
set thread excpis the shorthand alias. set thread takeover-suspend-count-
Normally, GDB’s thread suspend counts are relative to the
value GDB finds when it notices each thread. This command
changes the suspend counts to be absolute instead. set thread defaultshow thread default-
Each of the above
set threadcommands has aset threadcounterpart (e.g.,
defaultset thread default pause,set, etc.). The
thread default exception-portthread default
variety of commands sets the default thread properties for all
threads; you can then change the properties of individual threads with
the non-default commands.
21.1.6 Darwin
GDB provides the following commands specific to the Darwin target:
set debug darwin num-
When set to a non zero value, enables debugging messages specific to
the Darwin support. Higher values produce more verbose output. show debug darwin-
Show the current state of Darwin messages.
set debug mach-o num-
When set to a non zero value, enables debugging messages while
GDB is reading Darwin object files. (Mach-O is the
file format used on Darwin for object and executable files.) Higher
values produce more verbose output. This is a command to diagnose
problems internal to GDB and should not be needed in normal
usage. show debug mach-o-
Show the current state of Mach-O file messages.
set mach-exceptions onset mach-exceptions off-
On Darwin, faults are first reported as a Mach exception and are then
mapped to a Posix signal. Use this command to turn on trapping of
Mach exceptions in the inferior. This might be sometimes useful to
better understand the cause of a fault. The default is off. show mach-exceptions-
Show the current state of exceptions trapping.
21.1.7 FreeBSD
When the ABI of a system call is changed in the FreeBSD kernel, this
is implemented by leaving a compatibility system call using the old
ABI at the existing number and allocating a new system call number for
the version using the new ABI. As a convenience, when a system call
is caught by name (see catch syscall), compatibility system calls
are also caught.
For example, FreeBSD 12 introduced a new variant of the kevent
system call and catching the kevent system call by name catches
both variants:
(gdb) catch syscall kevent Catchpoint 1 (syscalls 'freebsd11_kevent' [363] 'kevent' [560]) (gdb)
21.2 Embedded Operating Systems
This section describes configurations involving the debugging of
embedded operating systems that are available for several different
architectures.
GDB includes the ability to debug programs running on
various real-time operating systems.
21.3 Embedded Processors
This section goes into details specific to particular embedded
configurations.
Whenever a specific embedded processor has a simulator, GDB
allows to send an arbitrary command to the simulator.
sim command-
Send an arbitrary command string to the simulator. Consult the
documentation for the specific simulator in use for information about
acceptable commands.
21.3.1 Synopsys ARC
GDB provides the following ARC-specific commands:
set debug arc-
Control the level of ARC specific debug messages. Use 0 for no messages (the
default), 1 for debug messages, and 2 for even more debug messages. show debug arc-
Show the level of ARC specific debugging in operation.
maint print arc arc-instruction address-
Print internal disassembler information about instruction at a given address.
21.3.2 ARM
GDB provides the following ARM-specific commands:
set arm disassembler-
This commands selects from a list of disassembly styles. The
"std"style is the standard style. show arm disassembler-
Show the current disassembly style.
set arm apcs32-
This command toggles ARM operation mode between 32-bit and 26-bit.
show arm apcs32-
Display the current usage of the ARM 32-bit mode.
set arm fpu fputype-
This command sets the ARM floating-point unit (FPU) type. The
argument fputype can be one of these:auto-
Determine the FPU type by querying the OS ABI.
softfpa-
Software FPU, with mixed-endian doubles on little-endian ARM
processors. fpa-
GCC-compiled FPA co-processor.
softvfp-
Software FPU with pure-endian doubles.
vfp-
VFP co-processor.
show arm fpu-
Show the current type of the FPU.
set arm abi-
This command forces GDB to use the specified ABI.
show arm abi-
Show the currently used ABI.
set arm fallback-mode (arm|thumb|auto)-
GDB uses the symbol table, when available, to determine
whether instructions are ARM or Thumb. This command controls
GDB’s default behavior when the symbol table is not
available. The default is ‘auto’, which causes GDB to
use the current execution mode (from theTbit in theCPSR
register). show arm fallback-mode-
Show the current fallback instruction mode.
set arm force-mode (arm|thumb|auto)-
This command overrides use of the symbol table to determine whether
instructions are ARM or Thumb. The default is ‘auto’, which
causes GDB to use the symbol table and then the setting
of ‘set arm fallback-mode’. show arm force-mode-
Show the current forced instruction mode.
set arm unwind-secure-frames-
This command enables unwinding from Non-secure to Secure mode on
Cortex-M with Security extension.
This can trigger security exceptions when unwinding the exception
stack.
It is enabled by default. show arm unwind-secure-frames-
Show whether unwinding from Non-secure to Secure mode is enabled.
set debug arm-
Toggle whether to display ARM-specific debugging messages from the ARM
target support subsystem. show debug arm-
Show whether ARM-specific debugging messages are enabled.
target sim [simargs] …-
The GDB ARM simulator accepts the following optional arguments.
--swi-support=type-
Tell the simulator which SWI interfaces to support. The argument
type may be a comma separated list of the following values.
The default value isall.nonedemonangelredbootall
21.3.3 BPF
target sim [simargs] …-
The GDB BPF simulator accepts the following optional arguments.
--skb-data-offset=offset-
Tell the simulator the offset, measured in bytes, of the
skb_datafield in the kernelstruct sk_buffstructure.
This offset is used by some BPF specific-purpose load/store
instructions. Defaults to 0.
21.3.4 M68k
The Motorola m68k configuration includes ColdFire support.
21.3.5 MicroBlaze
The MicroBlaze is a soft-core processor supported on various Xilinx
FPGAs, such as Spartan or Virtex series. Boards with these processors
usually have JTAG ports which connect to a host system running the Xilinx
Embedded Development Kit (EDK) or Software Development Kit (SDK).
This host system is used to download the configuration bitstream to
the target FPGA. The Xilinx Microprocessor Debugger (XMD) program
communicates with the target board using the JTAG interface and
presents a gdbserver interface to the board. By default
xmd uses port 1234. (While it is possible to change
this default port, it requires the use of undocumented xmd
commands. Contact Xilinx support if you need to do this.)
Use these GDB commands to connect to the MicroBlaze target processor.
target remote :1234-
Use this command to connect to the target if you are running GDB
on the same system asxmd. target remote xmd-host:1234-
Use this command to connect to the target if it is connected to
xmd
running on a different system named xmd-host. load-
Use this command to download a program to the MicroBlaze target.
set debug microblaze n-
Enable MicroBlaze-specific debugging messages if non-zero.
show debug microblaze n-
Show MicroBlaze-specific debugging level.
21.3.6 MIPS Embedded
GDB supports these special commands for MIPS targets:
set mipsfpu doubleset mipsfpu singleset mipsfpu noneset mipsfpu autoshow mipsfpu-
If your target board does not support the MIPS floating point
coprocessor, you should use the command ‘set mipsfpu none’ (if you
need this, you may wish to put the command in your GDB init
file). This tells GDB how to find the return value of
functions which return floating point values. It also allows
GDB to avoid saving the floating point registers when calling
functions on the board. If you are using a floating point coprocessor
with only single precision floating point support, as on the R4650
processor, use the command ‘set mipsfpu single’. The default
double precision floating point coprocessor may be selected using
‘set mipsfpu double’.In previous versions the only choices were double precision or no
floating point, so ‘set mipsfpu on’ will select double precision
and ‘set mipsfpu off’ will select no floating point.As usual, you can inquire about the
mipsfpuvariable with
‘show mipsfpu’.
21.3.7 OpenRISC 1000
The OpenRISC 1000 provides a free RISC instruction set architecture. It is
mainly provided as a soft-core which can run on Xilinx, Altera and other
FPGA’s.
GDB for OpenRISC supports the below commands when connecting to
a target:
target sim-
Runs the builtin CPU simulator which can run very basic
programs but does not support most hardware functions like MMU.
For more complex use cases the user is advised to run an external
target, and connect using ‘target remote’.Example:
target sim set debug or1k-
Toggle whether to display OpenRISC-specific debugging messages from the
OpenRISC target support subsystem. show debug or1k-
Show whether OpenRISC-specific debugging messages are enabled.
21.3.8 PowerPC Embedded
GDB supports using the DVC (Data Value Compare) register to
implement in hardware simple hardware watchpoint conditions of the form:
(gdb) watch address|variable if address|variable == constant expression
The DVC register will be automatically used when GDB detects
such pattern in a condition expression, and the created watchpoint uses one
debug register (either the exact-watchpoints option is on and the
variable is scalar, or the variable has a length of one byte). This feature
is available in native GDB running on a Linux kernel version 2.6.34
or newer.
When running on PowerPC embedded processors, GDB automatically uses
ranged hardware watchpoints, unless the exact-watchpoints option is on,
in which case watchpoints using only one debug register are created when
watching variables of scalar types.
You can create an artificial array to watch an arbitrary memory
region using one of the following commands (see Expressions):
(gdb) watch *((char *) address)@length
(gdb) watch {char[length]} address
PowerPC embedded processors support masked watchpoints. See the discussion
about the mask argument in Set Watchpoints.
PowerPC embedded processors support hardware accelerated
ranged breakpoints. A ranged breakpoint stops execution of
the inferior whenever it executes an instruction at any address within
the range it was set at. To set a ranged breakpoint in GDB,
use the break-range command.
GDB provides the following PowerPC-specific commands:
break-range start-locspec, end-locspec-
Set a breakpoint for an address range given by start-locspec and
end-locspec, which are location specs. See Location Specifications, for a list of all the possible forms of location
specs. GDB resolves both start-locspec and
end-locspec, and uses the addresses of the resolved code
locations as start and end addresses of the range to break at. The
breakpoint will stop execution of the inferior whenever it executes an
instruction at any address between the start and end addresses,
inclusive. If either start-locspec or end-locspec resolve
to multiple code locations in the program, then the command aborts
with an error without creating a breakpoint. set powerpc soft-floatshow powerpc soft-float-
Force GDB to use (or not use) a software floating point calling
convention. By default, GDB selects the calling convention based
on the selected architecture and the provided executable file. set powerpc vector-abishow powerpc vector-abi-
Force GDB to use the specified calling convention for vector
arguments and return values. The valid options are ‘auto’;
‘generic’, to avoid vector registers even if they are present;
‘altivec’, to use AltiVec registers; and ‘spe’ to use SPE
registers. By default, GDB selects the calling convention
based on the selected architecture and the provided executable file. set powerpc exact-watchpointsshow powerpc exact-watchpoints-
Allow GDB to use only one debug register when watching a variable
of scalar type, thus assuming that the variable is accessed through the
address of its first byte.
21.3.9 Atmel AVR
When configured for debugging the Atmel AVR, GDB supports the
following AVR-specific commands:
info io_registers-
This command displays information about the AVR I/O registers. For
each register, GDB prints its number and value.
21.3.10 CRIS
When configured for debugging CRIS, GDB provides the
following CRIS-specific commands:
set cris-version ver-
Set the current CRIS version to ver, either ‘10’ or ‘32’.
The CRIS version affects register names and sizes. This command is useful in
case autodetection of the CRIS version fails. show cris-version-
Show the current CRIS version.
set cris-dwarf2-cfi-
Set the usage of DWARF-2 CFI for CRIS debugging. The default is ‘on’.
Change to ‘off’ when usinggcc-criswhose version is below
R59. show cris-dwarf2-cfi-
Show the current state of using DWARF-2 CFI.
set cris-mode mode-
Set the current CRIS mode to mode. It should only be changed when
debugging in guru mode, in which case it should be set to
‘guru’ (the default is ‘normal’). show cris-mode-
Show the current CRIS mode.
21.3.11 Renesas Super-H
For the Renesas Super-H processor, GDB provides these
commands:
set sh calling-convention convention-
Set the calling-convention used when calling functions from GDB.
Allowed values are ‘gcc’, which is the default setting, and ‘renesas’.
With the ‘gcc’ setting, functions are called using the GCC calling
convention. If the DWARF-2 information of the called function specifies
that the function follows the Renesas calling convention, the function
is called using the Renesas calling convention. If the calling convention
is set to ‘renesas’, the Renesas calling convention is always used,
regardless of the DWARF-2 information. This can be used to override the
default of ‘gcc’ if debug information is missing, or the compiler
does not emit the DWARF-2 calling convention entry for a function. show sh calling-convention-
Show the current calling convention setting.
21.4 Architectures
This section describes characteristics of architectures that affect
all uses of GDB with the architecture, both native and cross.
21.4.1 AArch64
When GDB is debugging the AArch64 architecture, it provides the
following special commands:
set debug aarch64-
This command determines whether AArch64 architecture-specific debugging
messages are to be displayed. show debug aarch64-
Show whether AArch64 debugging messages are displayed.
21.4.1.1 AArch64 SVE.
When GDB is debugging the AArch64 architecture, if the Scalable Vector
Extension (SVE) is present, then GDB will provide the vector registers
$z0 through $z31, vector predicate registers $p0 through
$p15, and the $ffr register. In addition, the pseudo register
$vg will be provided. This is the vector granule for the current thread
and represents the number of 64-bit chunks in an SVE z register.
If the vector length changes, then the $vg register will be updated,
but the lengths of the z and p registers will not change. This
is a known limitation of GDB and does not affect the execution of the
target process.
21.4.1.2 AArch64 Pointer Authentication.
When GDB is debugging the AArch64 architecture, and the program is
using the v8.3-A feature Pointer Authentication (PAC), then whenever the link
register $lr is pointing to an PAC function its value will be masked.
When GDB prints a backtrace, any addresses that required unmasking will be
postfixed with the marker [PAC]. When using the MI, this is printed as part
of the addr_flags field.
21.4.1.3 AArch64 Memory Tagging Extension.
When GDB is debugging the AArch64 architecture, the program is
using the v8.5-A feature Memory Tagging Extension (MTE) and there is support
in the kernel for MTE, GDB will make memory tagging functionality
available for inspection and editing of logical and allocation tags.
See Memory Tagging.
To aid debugging, GDB will output additional information when SIGSEGV
signals are generated as a result of memory tag failures.
If the tag violation is synchronous, the following will be shown:
Program received signal SIGSEGV, Segmentation fault Memory tag violation while accessing address 0x0500fffff7ff8000 Allocation tag 0x1 Logical tag 0x5.
If the tag violation is asynchronous, the fault address is not available.
In this case GDB will show the following:
Program received signal SIGSEGV, Segmentation fault Memory tag violation Fault address unavailable.
A special register, tag_ctl, is made available through the
org.gnu.gdb.aarch64.mte feature. This register exposes some
options that can be controlled at runtime and emulates the prctl
option PR_SET_TAGGED_ADDR_CTRL. For further information, see the
documentation in the Linux kernel.
GDB supports dumping memory tag data to core files through the
gcore command and reading memory tag data from core files generated
by the gcore command or the Linux kernel.
When a process uses memory-mapped pages protected by memory tags (for
example, AArch64 MTE), this additional information will be recorded in
the core file in the event of a crash or if GDB generates a core file
from the current process state.
The memory tag data will be used so developers can display the memory
tags from a particular memory region (using the ‘m’ modifier to the
x command, using the print command or using the various
memory-tag subcommands.
In the case of a crash, GDB will attempt to retrieve the memory tag
information automatically from the core file, and will show one of the above
messages depending on whether the synchronous or asynchronous mode is selected.
See Memory Tagging. See Memory.
21.4.2 x86 Architecture-specific Issues
set struct-convention mode-
Set the convention used by the inferior to return
structs and
unions from functions to mode. Possible values of
mode are"pcc","reg", and"default"(the
default)."default"or"pcc"means thatstructs
are returned on the stack, while"reg"means that a
structor aunionwhose size is 1, 2, 4, or 8 bytes will
be returned in a register. show struct-convention-
Show the current setting of the convention to return
structs
from functions.
21.4.2.1 Intel Memory Protection Extensions (MPX).
Memory Protection Extension (MPX) adds the bound registers ‘BND0’
17 through ‘BND3’. Bound registers store a pair of 64-bit values
which are the lower bound and upper bound. Bounds are effective addresses or
memory locations. The upper bounds are architecturally represented in 1’s
complement form. A bound having lower bound = 0, and upper bound = 0
(1’s complement of all bits set) will allow access to the entire address space.
‘BND0’ through ‘BND3’ are represented in GDB as ‘bnd0raw’
through ‘bnd3raw’. Pseudo registers ‘bnd0’ through ‘bnd3’
display the upper bound performing the complement of one operation on the
upper bound value, i.e. when upper bound in ‘bnd0raw’ is 0 in the
GDB ‘bnd0’ it will be 0xfff…. In this sense it
can also be noted that the upper bounds are inclusive.
As an example, assume that the register BND0 holds bounds for a pointer having
access allowed for the range between 0x32 and 0x71. The values present on
bnd0raw and bnd registers are presented as follows:
bnd0raw = {0x32, 0xffffffff8e}
bnd0 = {lbound = 0x32, ubound = 0x71} : size 64
This way the raw value can be accessed via bnd0raw…bnd3raw. Any
change on bnd0…bnd3 or bnd0raw…bnd3raw is reflect on its
counterpart. When the bnd0…bnd3 registers are displayed via
Python, the display includes the memory size, in bits, accessible to
the pointer.
Bounds can also be stored in bounds tables, which are stored in
application memory. These tables store bounds for pointers by specifying
the bounds pointer’s value along with its bounds. Evaluating and changing
bounds located in bound tables is therefore interesting while investigating
bugs on MPX context. GDB provides commands for this purpose:
show mpx bound pointer-
Display bounds of the given pointer.
set mpx bound pointer, lbound, ubound-
Set the bounds of a pointer in the bound table.
This command takes three parameters: pointer is the pointers
whose bounds are to be changed, lbound and ubound are new values
for lower and upper bounds respectively.
When you call an inferior function on an Intel MPX enabled program,
GDB sets the inferior’s bound registers to the init (disabled) state
before calling the function. As a consequence, bounds checks for the
pointer arguments passed to the function will always pass.
This is necessary because when you call an inferior function, the
program is usually in the middle of the execution of other function.
Since at that point bound registers are in an arbitrary state, not
clearing them would lead to random bound violations in the called
function.
You can still examine the influence of the bound registers on the
execution of the called function by stopping the execution of the
called function at its prologue, setting bound registers, and
continuing the execution. For example:
$ break *upper
Breakpoint 2 at 0x4009de: file i386-mpx-call.c, line 47.
$ print upper (a, b, c, d, 1)
Breakpoint 2, upper (a=0x0, b=0x6e0000005b, c=0x0, d=0x0, len=48)....
$ print $bnd0
{lbound = 0x0, ubound = ffffffff} : size -1
At this last step the value of bnd0 can be changed for investigation of bound
violations caused along the execution of the call. In order to know how to
set the bound registers or bound table for the call consult the ABI.
21.4.3 Alpha
See the following section.
21.4.4 MIPS
Alpha- and MIPS-based computers use an unusual stack frame, which
sometimes requires GDB to search backward in the object code to
find the beginning of a function.
To improve response time (especially for embedded applications, where
GDB may be restricted to a slow serial line for this search)
you may want to limit the size of this search, using one of these
commands:
set heuristic-fence-post limit-
Restrict GDB to examining at most limit bytes in its
search for the beginning of a function. A value of 0 (the
default) means there is no limit. However, except for 0, the
larger the limit the more bytesheuristic-fence-postmust search
and therefore the longer it takes to run. You should only need to use
this command when debugging a stripped executable. show heuristic-fence-post-
Display the current limit.
These commands are available only when GDB is configured
for debugging programs on Alpha or MIPS processors.
Several MIPS-specific commands are available when debugging MIPS
programs:
set mips abi arg-
Tell GDB which MIPS ABI is used by the inferior. Possible
values of arg are:- ‘auto’
-
The default ABI associated with the current binary (this is the
default). - ‘o32’
- ‘o64’
- ‘n32’
- ‘n64’
- ‘eabi32’
- ‘eabi64’
show mips abi-
Show the MIPS ABI used by GDB to debug the inferior.
set mips compression arg-
Tell GDB which MIPS compressed
ISA (Instruction Set Architecture) encoding is used by the
inferior. GDB uses this for code disassembly and other
internal interpretation purposes. This setting is only referred to
when no executable has been associated with the debugging session or
the executable does not provide information about the encoding it uses.
Otherwise this setting is automatically updated from information
provided by the executable.Possible values of arg are ‘mips16’ and ‘micromips’.
The default compressed ISA encoding is ‘mips16’, as
executables containing MIPS16 code frequently are not
identified as such.This setting is “sticky”; that is, it retains its value across
debugging sessions until reset either explicitly with this command or
implicitly from an executable.The compiler and/or assembler typically add symbol table annotations to
identify functions compiled for the MIPS16 or
microMIPS ISAs. If these function-scope annotations
are present, GDB uses them in preference to the global
compressed ISA encoding setting. show mips compression-
Show the MIPS compressed ISA encoding used by
GDB to debug the inferior. set mipsfpushow mipsfpu-
See set mipsfpu.
set mips mask-address arg-
This command determines whether the most-significant 32 bits of 64-bit
MIPS addresses are masked off. The argument arg can be
‘on’, ‘off’, or ‘auto’. The latter is the default
setting, which lets GDB determine the correct value. show mips mask-address-
Show whether the upper 32 bits of MIPS addresses are masked off or
not. set remote-mips64-transfers-32bit-regs-
This command controls compatibility with 64-bit MIPS targets that
transfer data in 32-bit quantities. If you have an old MIPS 64 target
that transfers 32 bits for some registers, like SR and FSR,
and 64 bits for other registers, set this option to ‘on’. show remote-mips64-transfers-32bit-regs-
Show the current setting of compatibility with older MIPS 64 targets.
set debug mips-
This command turns on and off debugging messages for the MIPS-specific
target code in GDB. show debug mips-
Show the current setting of MIPS debugging messages.
21.4.5 HPPA
When GDB is debugging the HP PA architecture, it provides the
following special commands:
set debug hppa-
This command determines whether HPPA architecture-specific debugging
messages are to be displayed. show debug hppa-
Show whether HPPA debugging messages are displayed.
maint print unwind address-
This command displays the contents of the unwind table entry at the
given address.
21.4.6 PowerPC
When GDB is debugging the PowerPC architecture, it provides a set of
pseudo-registers to enable inspection of 128-bit wide Decimal Floating Point
numbers stored in the floating point registers. These values must be stored
in two consecutive registers, always starting at an even register like
f0 or f2.
The pseudo-registers go from $dl0 through $dl15, and are formed
by joining the even/odd register pairs f0 and f1 for $dl0,
f2 and f3 for $dl1 and so on.
For POWER7 processors, GDB provides a set of pseudo-registers, the 64-bit
wide Extended Floating Point Registers (‘f32’ through ‘f63’).
21.4.7 Nios II
When GDB is debugging the Nios II architecture,
it provides the following special commands:
set debug nios2-
This command turns on and off debugging messages for the Nios II
target code in GDB. show debug nios2-
Show the current setting of Nios II debugging messages.
21.4.8 Sparc64
21.4.8.1 ADI Support
The M7 processor supports an Application Data Integrity (ADI) feature that
detects invalid data accesses. When software allocates memory and enables
ADI on the allocated memory, it chooses a 4-bit version number, sets the
version in the upper 4 bits of the 64-bit pointer to that data, and stores
the 4-bit version in every cacheline of that data. Hardware saves the latter
in spare bits in the cache and memory hierarchy. On each load and store,
the processor compares the upper 4 VA (virtual address) bits to the
cacheline’s version. If there is a mismatch, the processor generates a
version mismatch trap which can be either precise or disrupting. The trap
is an error condition which the kernel delivers to the process as a SIGSEGV
signal.
Note that only 64-bit applications can use ADI and need to be built with
ADI-enabled.
Values of the ADI version tags, which are in granularity of a
cacheline (64 bytes), can be viewed or modified.
adi (examine | x) [ / n ] addr-
The
adi examinecommand displays the value of one ADI version tag per
cacheline.n is a decimal integer specifying the number in bytes; the default
is 1. It specifies how much ADI version information, at the ratio of 1:ADI
block size, to display.addr is the address in user address space where you want GDB
to begin displaying the ADI version tags.Below is an example of displaying ADI versions of variable «shmaddr».
(gdb) adi x/100 shmaddr 0xfff800010002c000: 0 0
adi (assign | a) [ / n ] addr = tag-
The
adi assigncommand is used to assign new ADI version tag
to an address.n is a decimal integer specifying the number in bytes;
the default is 1. It specifies how much ADI version information, at the
ratio of 1:ADI block size, to modify.addr is the address in user address space where you want GDB
to begin modifying the ADI version tags.tag is the new ADI version tag.
For example, do the following to modify then verify ADI versions of
variable «shmaddr»:(gdb) adi a/100 shmaddr = 7 (gdb) adi x/100 shmaddr 0xfff800010002c000: 7 7
21.4.9 S12Z
When GDB is debugging the S12Z architecture,
it provides the following special command:
maint info bdccsr-
This command displays the current value of the microprocessor’s
BDCCSR register.
22 Controlling GDB
You can alter the way GDB interacts with you by using the
set command. For commands controlling how GDB displays
data, see Print Settings. Other settings are
described here.
22.1 Prompt
GDB indicates its readiness to read a command by printing a string
called the prompt. This string is normally ‘(gdb)’. You
can change the prompt string with the set prompt command. For
instance, when debugging GDB with GDB, it is useful to change
the prompt in one of the GDB sessions so that you can always tell
which one you are talking to.
Note: set prompt does not add a space for you after the
prompt you set. This allows you to set a prompt which ends in a space
or a prompt that does not.
set prompt newprompt-
Directs GDB to use newprompt as its prompt string henceforth.
show prompt-
Prints a line of the form: ‘Gdb’s prompt is: your-prompt’
Versions of GDB that ship with Python scripting enabled have
prompt extensions. The commands for interacting with these extensions
are:
set extended-prompt prompt-
Set an extended prompt that allows for substitutions.
See gdb.prompt, for a list of escape sequences that can be used for
substitution. Any escape sequences specified as part of the prompt
string are replaced with the corresponding strings each time the prompt
is displayed.For example:
set extended-prompt Current working directory: w (gdb)
Note that when an extended-prompt is set, it takes control of the
prompt_hook hook. See prompt_hook, for further information. show extended-prompt-
Prints the extended prompt. Any escape sequences specified as part of
the prompt string withset extended-prompt, are replaced with the
corresponding strings each time the prompt is displayed.
22.2 Command Editing
GDB reads its input commands via the Readline interface. This
GNU library provides consistent behavior for programs which provide a
command line interface to the user. Advantages are GNU Emacs-style
or vi-style inline editing of commands, csh-like history
substitution, and a storage and recall of command history across
debugging sessions.
You may control the behavior of command line editing in GDB with the
command set.
set editingset editing on-
Enable command line editing (enabled by default).
set editing off-
Disable command line editing.
show editing-
Show whether command line editing is enabled.
See Command Line Editing,
for more details about the Readline
interface. Users unfamiliar with GNU Emacs or vi are
encouraged to read that chapter.
GDB sets the Readline application name to ‘gdb’. This
is useful for conditions in .inputrc.
GDB defines a bindable Readline command,
operate-and-get-next. This is bound to C-o by default.
This command accepts the current line for execution and fetches the
next line relative to the current line from the history for editing.
Any argument is ignored.
22.3 Command History
GDB can keep track of the commands you type during your
debugging sessions, so that you can be certain of precisely what
happened. Use these commands to manage the GDB command
history facility.
GDB uses the GNU History library, a part of the Readline
package, to provide the history facility.
See Using History Interactively,
for the detailed description of the History library.
To issue a command to GDB without affecting certain aspects of
the state which is seen by users, prefix it with ‘server ’
(see Server Prefix). This
means that this command will not affect the command history, nor will it
affect GDB’s notion of which command to repeat if RET is
pressed on a line by itself.
The server prefix does not affect the recording of values into the value
history; to print a value without recording it into the value history,
use the output command instead of the print command.
Here is the description of GDB commands related to command
history.
set history filename [fname]-
Set the name of the GDB command history file to fname.
This is the file where GDB reads an initial command history
list, and where it writes the command history from this session when it
exits. You can access this list through history expansion or through
the history command editing characters listed below. This file defaults
to the value of the environment variableGDBHISTFILE, or to
./.gdb_history (./_gdb_history on MS-DOS) if this variable
is not set.The
GDBHISTFILEenvironment variable is read after processing
any GDB initialization files (see Startup) and after
processing any commands passed using command line options (for
example,-ex).If the fname argument is not given, or if the
GDBHISTFILE
is the empty string then GDB will neither try to load an
existing history file, nor will it try to save the history on exit. set history saveset history save on-
Record command history in a file, whose name may be specified with the
set history filenamecommand. By default, this option is
disabled. The command history will be recorded when GDB
exits. Ifset history filenameis set to the empty string then
history saving is disabled, even whenset history saveis
on. set history save off-
Don’t record the command history into the file specified by
setwhen GDB exits.
history filename set history size sizeset history size unlimited-
Set the number of commands which GDB keeps in its history list.
This defaults to the value of the environment variableGDBHISTSIZE, or
to 256 if this variable is not set. Non-numeric values ofGDBHISTSIZE
are ignored. If size isunlimitedor ifGDBHISTSIZEis
either a negative number or the empty string, then the number of commands
GDB keeps in the history list is unlimited.The
GDBHISTSIZEenvironment variable is read after processing
any GDB initialization files (see Startup) and after
processing any commands passed using command line options (for
example,-ex). set history remove-duplicates countset history remove-duplicates unlimited-
Control the removal of duplicate history entries in the command history list.
If count is non-zero, GDB will look back at the last count
history entries and remove the first entry that is a duplicate of the current
entry being added to the command history list. If count is
unlimitedthen this lookbehind is unbounded. If count is 0, then
removal of duplicate history entries is disabled.Only history entries added during the current session are considered for
removal. This option is set to 0 by default.
History expansion assigns special meaning to the character !.
See Event Designators,
for more details.
Since ! is also the logical not operator in C, history expansion
is off by default. If you decide to enable history expansion with the
set history expansion on command, you may sometimes need to
follow ! (when it is used as logical not, in an expression) with
a space or a tab to prevent it from being expanded. The readline
history facilities do not attempt substitution on the strings
!= and !(, even when history expansion is enabled.
The commands to control history expansion are:
set history expansion onset history expansion-
Enable history expansion. History expansion is off by default.
set history expansion off-
Disable history expansion.
show historyshow history filenameshow history saveshow history sizeshow history expansion-
These commands display the state of the GDB history parameters.
show historyby itself displays all four states.
show commands-
Display the last ten commands in the command history.
show commands n-
Print ten commands centered on command number n.
show commands +-
Print ten commands just after the commands last printed.
22.4 Screen Size
Certain commands to GDB may produce large amounts of
information output to the screen. To help you read all of it,
GDB pauses and asks you for input at the end of each page of
output. Type RET when you want to see one more page of output,
q to discard the remaining output, or c to continue
without paging for the rest of the current command. Also, the screen
width setting determines when to wrap lines of output. Depending on
what is being printed, GDB tries to break the line at a
readable place, rather than simply letting it overflow onto the
following line.
Normally GDB knows the size of the screen from the terminal
driver software. For example, on Unix GDB uses the termcap data base
together with the value of the TERM environment variable and the
stty rows and stty cols settings. If this is not correct,
you can override it with the set height and set commands:
width
set height lppset height unlimitedshow heightset width cplset width unlimitedshow width-
These
setcommands specify a screen height of lpp lines and
a screen width of cpl characters. The associatedshow
commands display the current settings.If you specify a height of either
unlimitedor zero lines,
GDB does not pause during output no matter how long the
output is. This is useful if output is to a file or to an editor
buffer.Likewise, you can specify ‘set width unlimited’ or ‘set
width 0’ to prevent GDB from wrapping its output. set pagination onset pagination off-
Turn the output pagination on or off; the default is on. Turning
pagination off is the alternative toset height unlimited. Note that
running GDB with the —batch option (see -batch) also automatically disables pagination. show pagination-
Show the current pagination mode.
22.5 Output Styling
GDB can style its output on a capable terminal. This is
enabled by default on most systems, but disabled by default when in
batch mode (see Mode Options). Various style settings are available;
and styles can also be disabled entirely.
set style enabled ‘on|off’-
Enable or disable all styling. The default is host-dependent, with
most hosts defaulting to ‘on’. show style enabled-
Show the current state of styling.
set style sources ‘on|off’-
Enable or disable source code styling. This affects whether source
code, such as the output of thelistcommand, is styled. The
default is ‘on’. Note that source styling only works if styling
in general is enabled, and if a source highlighting library is
available to GDB.There are two ways that highlighting can be done. First, if
GDB was linked with the GNU Source Highlight library, then it
is used. Otherwise, if GDB was configured with Python
scripting support, and if the Python Pygments package is available,
then it will be used. show style sources-
Show the current state of source code styling.
set style tui-current-position ‘on|off’-
Enable or disable styling of the source and assembly code highlighted
by the TUI’s current position indicator. The default is ‘off’.
See GDB Text User Interface. show style tui-current-position-
Show whether the source and assembly code highlighted by the TUI’s
current position indicator is styled. set style disassembler enabled ‘on|off’-
Enable or disable disassembler styling. This affects whether
disassembler output, such as the output of thedisassemble
command, is styled. Disassembler styling only works if styling in
general is enabled (withset style enabled on), and if a source
highlighting library is available to GDB.The two source highlighting libraries that GDB could use to
style disassembler output are; GDB’s builtin disassembler, or
the Python Pygments package.GDB’s first choice will be to use the builtin disassembler
for styling, this usually provides better results, being able to style
different types of instruction operands differently. However, the
builtin disassembler is not able to style all architectures.For architectures that the builtin disassembler is unable to style,
GDB will fall back to use the Python Pygments package where
possible. In order to use the Python Pygments package, GDB
must be built with Python support, and the Pygments package must be
installed.If neither of these options are available then GDB will
produce unstyled disassembler output, even when this setting is
‘on’.To discover if the current architecture supports styling using the
builtin disassembler library see maint
show libopcodes-styling enabled. show style disassembler enabled-
Show the current state of disassembler styling.
Subcommands of set style control specific forms of styling.
These subcommands all follow the same pattern: each style-able object
can be styled with a foreground color, a background color, and an
intensity.
For example, the style of file names can be controlled using the
set style filename group of commands:
set style filename background color-
Set the background to color. Valid colors are ‘none’
(meaning the terminal’s default color), ‘black’, ‘red’,
‘green’, ‘yellow’, ‘blue’, ‘magenta’, ‘cyan’,
and‘white’. set style filename foreground color-
Set the foreground to color. Valid colors are ‘none’
(meaning the terminal’s default color), ‘black’, ‘red’,
‘green’, ‘yellow’, ‘blue’, ‘magenta’, ‘cyan’,
and‘white’. set style filename intensity value-
Set the intensity to value. Valid intensities are ‘normal’
(the default), ‘bold’, and ‘dim’.
The show style command and its subcommands are styling
a style name in their output using its own style.
So, use show style to see the complete list of styles,
their characteristics and the visual aspect of each style.
The style-able objects are:
filename-
Control the styling of file names and URLs. By default, this style’s
foreground color is green. function-
Control the styling of function names. These are managed with the
set style functionfamily of commands. By default, this
style’s foreground color is yellow.This style is also used for symbol names in styled disassembler output
if GDB is using its builtin disassembler library for styling
(see set style disassembler
enabled). variable-
Control the styling of variable names. These are managed with the
set style variablefamily of commands. By default, this style’s
foreground color is cyan. address-
Control the styling of addresses. These are managed with the
set style addressfamily of commands. By default, this style’s
foreground color is blue.This style is also used for addresses in styled disassembler output
if GDB is using its builtin disassembler library for styling
(see set style disassembler
enabled). version-
Control the styling of GDB’s version number text. By
default, this style’s foreground color is magenta and it has bold
intensity. The version number is displayed in two places, the output
ofshow version, and when GDB starts up.In order to control how GDB styles the version number at
startup, add theset style versionfamily of commands to the
early initialization command file (see Initialization Files). title-
Control the styling of titles. These are managed with the
set style titlefamily of commands. By default, this style’s
intensity is bold. Commands are using the title style to improve
the readability of large output. For example, the commands
aproposandhelpare using the title style
for the command names. highlight-
Control the styling of highlightings. These are managed with the
set style highlightfamily of commands. By default, this style’s
foreground color is red. Commands are using the highlight style to draw
the user attention to some specific parts of their output. For example,
the commandapropos -v REGEXPuses the highlight style to
mark the documentation parts matching regexp. metadata-
Control the styling of data annotations added by GDB to data
it displays. By default, this style’s intensity is dim. Metadata
annotations include the ‘repeats n times’ annotation for
suppressed display of repeated array elements (see Print Settings),
‘<unavailable>’ and ‘<error descr>’ annotations
for errors and ‘<optimized-out>’ annotations for optimized-out
values in displaying stack frame information in backtraces
(see Backtrace), etc. tui-border-
Control the styling of the TUI border. Note that, unlike other
styling options, only the color of the border can be controlled via
set style. This was done for compatibility reasons, as TUI
controls to set the border’s intensity predated the addition of
general styling to GDB. See TUI Configuration. tui-active-border-
Control the styling of the active TUI border; that is, the TUI window
that has the focus. disassembler comment-
Control the styling of comments in the disassembler output. These are
managed with theset style disassembler commentfamily of
commands. This style is only used when GDB is styling using
its builtin disassembler library
(see set style disassembler
enabled). By default, this style’s intensity is dim, and its
foreground color is white. disassembler immediate-
Control the styling of numeric operands in the disassembler output.
These are managed with theset style disassembler immediate
family of commands. This style is not used for instruction operands
that represent addresses, in that case the ‘disassembler address’
style is used. This style is only used when GDB is styling
using its builtin disassembler library. By default, this style’s
foreground color is blue. disassembler address-
Control the styling of address operands in the disassembler output.
This is an alias for the ‘address’ style. disassembler symbol-
Control the styling of symbol names in the disassembler output. This
is an alias for the ‘function’ style. disassembler mnemonic-
Control the styling of instruction mnemonics in the disassembler
output. These are managed with theset style disassemblerfamily of commands. This style is also used for assembler
mnemonic
directives, e.g..byte,.word, etc. This style is
only used when GDB is styling using its builtin disassembler
library. By default, this style’s foreground color is green. disassembler register-
Control the styling of register operands in the disassembler output.
These are managed with theset style disassembler register
family of commands. This style is only used when GDB is
styling using its builtin disassembler library. By default, this style’s
foreground color is red.
22.6 Numbers
You can always enter numbers in octal, decimal, or hexadecimal in
GDB by the usual conventions: octal numbers begin with
‘0’, decimal numbers end with ‘.’, and hexadecimal numbers
begin with ‘0x’. Numbers that neither begin with ‘0’ or
‘0x’, nor end with a ‘.’ are, by default, entered in base
10; likewise, the default display for numbers—when no particular
format is specified—is base 10. You can change the default base for
both input and output with the commands described below.
set input-radix base-
Set the default base for numeric input. Supported choices
for base are decimal 8, 10, or 16. The base must itself be
specified either unambiguously or using the current input radix; for
example, any ofset input-radix 012 set input-radix 10. set input-radix 0xa
sets the input base to decimal. On the other hand, ‘set input-radix 10’
leaves the input radix unchanged, no matter what it was, since
‘10’, being without any leading or trailing signs of its base, is
interpreted in the current radix. Thus, if the current radix is 16,
‘10’ is interpreted in hex, i.e. as 16 decimal, which doesn’t
change the radix. set output-radix base-
Set the default base for numeric display. Supported choices
for base are decimal 8, 10, or 16. The base must itself be
specified either unambiguously or using the current input radix. show input-radix-
Display the current default base for numeric input.
show output-radix-
Display the current default base for numeric display.
set radix [base]show radix-
These commands set and show the default base for both input and output
of numbers.set radixsets the radix of input and output to
the same base; without an argument, it resets the radix back to its
default value of 10.
22.7 Configuring the Current ABI
GDB can determine the ABI (Application Binary Interface) of your
application automatically. However, sometimes you need to override its
conclusions. Use these commands to manage GDB’s view of the
current ABI.
One GDB configuration can debug binaries for multiple operating
system targets, either via remote debugging or native emulation.
GDB will autodetect the OS ABI (Operating System ABI) in use,
but you can override its conclusion using the set osabi command.
One example where this is useful is in debugging of binaries which use
an alternate C library (e.g. UCLIBC for GNU/Linux) which does
not have the same identifying marks that the standard C library for your
platform provides.
When GDB is debugging the AArch64 architecture, it provides a
“Newlib” OS ABI. This is useful for handling setjmp and
longjmp when debugging binaries that use the NEWLIB C library.
The “Newlib” OS ABI can be selected by set osabi Newlib.
show osabi-
Show the OS ABI currently in use.
set osabi-
With no argument, show the list of registered available OS ABI’s.
set osabi abi-
Set the current OS ABI to abi.
Generally, the way that an argument of type float is passed to a
function depends on whether the function is prototyped. For a prototyped
(i.e. ANSI/ISO style) function, float arguments are passed unchanged,
according to the architecture’s convention for float. For unprototyped
(i.e. K&R style) functions, float arguments are first promoted to type
double and then passed.
Unfortunately, some forms of debug information do not reliably indicate whether
a function is prototyped. If GDB calls a function that is not marked
as prototyped, it consults set coerce-float-to-double.
set coerce-float-to-doubleset coerce-float-to-double on-
Arguments of type
floatwill be promoted todoublewhen passed
to an unprototyped function. This is the default setting. set coerce-float-to-double off-
Arguments of type
floatwill be passed directly to unprototyped
functions. show coerce-float-to-double-
Show the current setting of promoting
floattodouble.
GDB needs to know the ABI used for your program’s C++
objects. The correct C++ ABI depends on which C++ compiler was
used to build your application. GDB only fully supports
programs with a single C++ ABI; if your program contains code using
multiple C++ ABI’s or if GDB can not identify your
program’s ABI correctly, you can tell GDB which ABI to use.
Currently supported ABI’s include “gnu-v2”, for g++ versions
before 3.0, “gnu-v3”, for g++ versions 3.0 and later, and
“hpaCC” for the HP ANSI C++ compiler. Other C++ compilers may
use the “gnu-v2” or “gnu-v3” ABI’s as well. The default setting is
“auto”.
show cp-abi-
Show the C++ ABI currently in use.
set cp-abi-
With no argument, show the list of supported C++ ABI’s.
set cp-abi abiset cp-abi auto-
Set the current C++ ABI to abi, or return to automatic detection.
22.8 Automatically loading associated files
GDB sometimes reads files with commands and settings automatically,
without being explicitly told so by the user. We call this feature
auto-loading. While auto-loading is useful for automatically adapting
GDB to the needs of your project, it can sometimes produce unexpected
results or introduce security risks (e.g., if the file comes from untrusted
sources).
There are various kinds of files GDB can automatically load.
In addition to these files, GDB supports auto-loading code written
in various extension languages. See Auto-loading extensions.
Note that loading of these associated files (including the local .gdbinit
file) requires accordingly configured auto-load safe-path
(see Auto-loading safe path).
For these reasons, GDB includes commands and options to let you
control when to auto-load files and which files should be auto-loaded.
set auto-load off-
Globally disable loading of all auto-loaded files.
You may want to use this command with the ‘-iex’ option
(see Option -init-eval-command) such as:$ gdb -iex "set auto-load off" untrusted-executable corefile
Be aware that system init file (see System-wide configuration)
and init files from your home directory (see Home Directory Init File)
still get read (as they come from generally trusted directories).
To prevent GDB from auto-loading even those init files, use the
-nx option (see Mode Options), in addition to
set auto-load no. show auto-load-
Show whether auto-loading of each specific ‘auto-load’ file(s) is enabled
or disabled.(gdb) show auto-load gdb-scripts: Auto-loading of canned sequences of commands scripts is on. libthread-db: Auto-loading of inferior specific libthread_db is on. local-gdbinit: Auto-loading of .gdbinit script from current directory is on. python-scripts: Auto-loading of Python scripts is on. safe-path: List of directories from which it is safe to auto-load files is $debugdir:$datadir/auto-load. scripts-directory: List of directories from which to load auto-loaded scripts is $debugdir:$datadir/auto-load. info auto-load-
Print whether each specific ‘auto-load’ file(s) have been auto-loaded or
not.(gdb) info auto-load gdb-scripts: Loaded Script Yes /home/user/gdb/gdb-gdb.gdb libthread-db: No auto-loaded libthread-db. local-gdbinit: Local .gdbinit file "/home/user/gdb/.gdbinit" has been loaded. python-scripts: Loaded Script Yes /home/user/gdb/gdb-gdb.py
These are GDB control commands for the auto-loading:
| See set auto-load off. | Disable auto-loading globally. |
| See show auto-load. | Show setting of all kinds of files. |
| See info auto-load. | Show state of all kinds of files. |
| See set auto-load gdb-scripts. | Control for GDB command scripts. |
| See show auto-load gdb-scripts. | Show setting of GDB command scripts. |
| See info auto-load gdb-scripts. | Show state of GDB command scripts. |
| See set auto-load python-scripts. | Control for GDB Python scripts. |
| See show auto-load python-scripts. | Show setting of GDB Python scripts. |
| See info auto-load python-scripts. | Show state of GDB Python scripts. |
| See set auto-load guile-scripts. | Control for GDB Guile scripts. |
| See show auto-load guile-scripts. | Show setting of GDB Guile scripts. |
| See info auto-load guile-scripts. | Show state of GDB Guile scripts. |
| See set auto-load scripts-directory. | Control for GDB auto-loaded scripts location. |
| See show auto-load scripts-directory. | Show GDB auto-loaded scripts location. |
| See add-auto-load-scripts-directory. | Add directory for auto-loaded scripts location list. |
| See set auto-load local-gdbinit. | Control for init file in the current directory. |
| See show auto-load local-gdbinit. | Show setting of init file in the current directory. |
| See info auto-load local-gdbinit. | Show state of init file in the current directory. |
| See set auto-load libthread-db. | Control for thread debugging library. |
| See show auto-load libthread-db. | Show setting of thread debugging library. |
| See info auto-load libthread-db. | Show state of thread debugging library. |
| See set auto-load safe-path. | Control directories trusted for automatic loading. |
| See show auto-load safe-path. | Show directories trusted for automatic loading. |
| See add-auto-load-safe-path. | Add directory trusted for automatic loading. |
22.8.1 Automatically loading init file in the current directory
By default, GDB reads and executes the canned sequences of commands
from init file (if any) in the current working directory,
see Init File in the Current Directory during Startup.
Note that loading of this local .gdbinit file also requires accordingly
configured auto-load safe-path (see Auto-loading safe path).
set auto-load local-gdbinit [on|off]-
Enable or disable the auto-loading of canned sequences of commands
(see Sequences) found in init file in the current directory. show auto-load local-gdbinit-
Show whether auto-loading of canned sequences of commands from init file in the
current directory is enabled or disabled. info auto-load local-gdbinit-
Print whether canned sequences of commands from init file in the
current directory have been auto-loaded.
22.8.2 Automatically loading thread debugging library
This feature is currently present only on GNU/Linux native hosts.
GDB reads in some cases thread debugging library from places specific
to the inferior (see set libthread-db-search-path).
The special ‘libthread-db-search-path’ entry ‘$sdir’ is processed
without checking this ‘set auto-load libthread-db’ switch as system
libraries have to be trusted in general. In all other cases of
‘libthread-db-search-path’ entries GDB checks first if ‘set
auto-load libthread-db’ is enabled before trying to open such thread debugging
library.
Note that loading of this debugging library also requires accordingly configured
auto-load safe-path (see Auto-loading safe path).
set auto-load libthread-db [on|off]-
Enable or disable the auto-loading of inferior specific thread debugging library.
show auto-load libthread-db-
Show whether auto-loading of inferior specific thread debugging library is
enabled or disabled. info auto-load libthread-db-
Print the list of all loaded inferior specific thread debugging libraries and
for each such library print list of inferior pids using it.
22.8.3 Security restriction for auto-loading
As the files of inferior can come from untrusted source (such as submitted by
an application user) GDB does not always load any files automatically.
GDB provides the ‘set auto-load safe-path’ setting to list
directories trusted for loading files not explicitly requested by user.
Each directory can also be a shell wildcard pattern.
If the path is not set properly you will see a warning and the file will not
get loaded:
$ ./gdb -q ./gdb
Reading symbols from /home/user/gdb/gdb...
warning: File "/home/user/gdb/gdb-gdb.gdb" auto-loading has been
declined by your `auto-load safe-path' set
to "$debugdir:$datadir/auto-load".
warning: File "/home/user/gdb/gdb-gdb.py" auto-loading has been
declined by your `auto-load safe-path' set
to "$debugdir:$datadir/auto-load".
To instruct GDB to go ahead and use the init files anyway,
invoke GDB like this:
$ gdb -q -iex "set auto-load safe-path /home/user/gdb" ./gdb
The list of trusted directories is controlled by the following commands:
set auto-load safe-path [directories]-
Set the list of directories (and their subdirectories) trusted for automatic
loading and execution of scripts. You can also enter a specific trusted file.
Each directory can also be a shell wildcard pattern; wildcards do not match
directory separator — seeFNM_PATHNAMEfor system functionfnmatch
(see fnmatch in GNU C Library Reference Manual).
If you omit directories, ‘auto-load safe-path’ will be reset to
its default value as specified during GDB compilation.The list of directories uses path separator (‘:’ on GNU and Unix
systems, ‘;’ on MS-Windows and MS-DOS) to separate directories, similarly
to thePATHenvironment variable. show auto-load safe-path-
Show the list of directories trusted for automatic loading and execution of
scripts. add-auto-load-safe-path-
Add an entry (or list of entries) to the list of directories trusted for
automatic loading and execution of scripts. Multiple entries may be delimited
by the host platform path separator in use.
This variable defaults to what --with-auto-load-dir has been configured
to (see with-auto-load-dir). $debugdir and $datadir
substitution applies the same as for set auto-load scripts-directory.
The default set auto-load safe-path value can be also overriden by
GDB configuration option —with-auto-load-safe-path.
Setting this variable to / disables this security protection,
corresponding GDB configuration option is
—without-auto-load-safe-path.
This variable is supposed to be set to the system directories writable by the
system superuser only. Users can add their source directories in init files in
their home directories (see Home Directory Init File). See also deprecated
init file in the current directory
(see Init File in the Current Directory during Startup).
To force GDB to load the files it declined to load in the previous
example, you could use one of the following ways:
- ~/.gdbinit: ‘add-auto-load-safe-path ~/src/gdb’
-
Specify this trusted directory (or a file) as additional component of the list.
You have to specify also any existing directories displayed by
by ‘show auto-load safe-path’ (such as ‘/usr:/bin’ in this example). - gdb -iex "set auto-load safe-path /usr:/bin:~/src/gdb" …
-
Specify this directory as in the previous case but just for a single
GDB session. - gdb -iex "set auto-load safe-path /" …
-
Disable auto-loading safety for a single GDB session.
This assumes all the files you debug during this GDB session will come
from trusted sources. - ./configure --without-auto-load-safe-path
-
During compilation of GDB you may disable any auto-loading safety.
This assumes all the files you will ever debug with this GDB come from
trusted sources.
On the other hand you can also explicitly forbid automatic files loading which
also suppresses any such warning messages:
- gdb -iex "set auto-load no" …
-
You can use GDB command-line option for a single GDB session.
- ~/.gdbinit: ‘set auto-load no’
-
Disable auto-loading globally for the user
(see Home Directory Init File). While it is improbable, you could also
use system init file instead (see System-wide configuration).
This setting applies to the file names as entered by user. If no entry matches
GDB tries as a last resort to also resolve all the file names into
their canonical form (typically resolving symbolic links) and compare the
entries again. GDB already canonicalizes most of the filenames on its
own before starting the comparison so a canonical form of directories is
recommended to be entered.
22.8.4 Displaying files tried for auto-load
For better visibility of all the file locations where you can place scripts to
be auto-loaded with inferior — or to protect yourself against accidental
execution of untrusted scripts — GDB provides a feature for printing
all the files attempted to be loaded. Both existing and non-existing files may
be printed.
For example the list of directories from which it is safe to auto-load files
(see Auto-loading safe path) applies also to canonicalized filenames which
may not be too obvious while setting it up.
(gdb) set debug auto-load on
(gdb) file ~/src/t/true
auto-load: Loading canned sequences of commands script "/tmp/true-gdb.gdb"
for objfile "/tmp/true".
auto-load: Updating directories of "/usr:/opt".
auto-load: Using directory "/usr".
auto-load: Using directory "/opt".
warning: File "/tmp/true-gdb.gdb" auto-loading has been declined
by your `auto-load safe-path' set to "/usr:/opt".
set debug auto-load [on|off]-
Set whether to print the filenames attempted to be auto-loaded.
show debug auto-load-
Show whether printing of the filenames attempted to be auto-loaded is turned
on or off.
22.9 Optional Warnings and Messages
By default, GDB is silent about its inner workings. If you are
running on a slow machine, you may want to use the set verbose
command. This makes GDB tell you when it does a lengthy
internal operation, so you will not think it has crashed.
Currently, the messages controlled by set verbose are those
which announce that the symbol table for a source file is being read;
see symbol-file in Commands to Specify Files.
set verbose on-
Enables GDB output of certain informational messages.
set verbose off-
Disables GDB output of certain informational messages.
show verbose-
Displays whether
set verboseis on or off.
By default, if GDB encounters bugs in the symbol table of an
object file, it is silent; but if you are debugging a compiler, you may
find this information useful (see Errors Reading
Symbol Files).
set complaints limit-
Permits GDB to output limit complaints about each type of
unusual symbols before becoming silent about the problem. Set
limit to zero to suppress all complaints; set it to a large number
to prevent complaints from being suppressed. show complaints-
Displays how many symbol complaints GDB is permitted to produce.
By default, GDB is cautious, and asks what sometimes seems to be a
lot of stupid questions to confirm certain commands. For example, if
you try to run a program which is already running:
(gdb) run The program being debugged has been started already. Start it from the beginning? (y or n)
If you are willing to unflinchingly face the consequences of your own
commands, you can disable this “feature”:
set confirm off-
Disables confirmation requests. Note that running GDB with
the —batch option (see -batch) also
automatically disables confirmation requests. set confirm on-
Enables confirmation requests (the default).
show confirm-
Displays state of confirmation requests.
If you need to debug user-defined commands or sourced files you may find it
useful to enable command tracing. In this mode each command will be
printed as it is executed, prefixed with one or more ‘+’ symbols, the
quantity denoting the call depth of each command.
set trace-commands on-
Enable command tracing.
set trace-commands off-
Disable command tracing.
show trace-commands-
Display the current state of command tracing.
22.10 Optional Messages about Internal Happenings
GDB has commands that enable optional debugging messages from
various GDB subsystems; normally these commands are of
interest to GDB maintainers, or when reporting a bug. This
section documents those commands.
set exec-done-display-
Turns on or off the notification of asynchronous commands’
completion. When on, GDB will print a message when an
asynchronous command finishes its execution. The default is off. show exec-done-display-
Displays the current setting of asynchronous command completion
notification. set debug aarch64-
Turns on or off display of debugging messages related to ARM AArch64.
The default is off. show debug aarch64-
Displays the current state of displaying debugging messages related to
ARM AArch64. set debug arch-
Turns on or off display of gdbarch debugging info. The default is off
show debug arch-
Displays the current state of displaying gdbarch debugging info.
set debug aix-thread-
Display debugging messages about inner workings of the AIX thread
module. show debug aix-thread-
Show the current state of AIX thread debugging info display.
set debug check-physname-
Check the results of the “physname” computation. When reading DWARF
debugging information for C++, GDB attempts to compute
each entity’s name. GDB can do this computation in two
different ways, depending on exactly what information is present.
When enabled, this setting causes GDB to compute the names
both ways and display any discrepancies. show debug check-physname-
Show the current state of “physname” checking.
set debug coff-pe-read-
Control display of debugging messages related to reading of COFF/PE
exported symbols. The default is off. show debug coff-pe-read-
Displays the current state of displaying debugging messages related to
reading of COFF/PE exported symbols. set debug dwarf-die-
Dump DWARF DIEs after they are read in.
The value is the number of nesting levels to print.
A value of zero turns off the display. show debug dwarf-die-
Show the current state of DWARF DIE debugging.
set debug dwarf-line-
Turns on or off display of debugging messages related to reading
DWARF line tables. The default is 0 (off).
A value of 1 provides basic information.
A value greater than 1 provides more verbose information. show debug dwarf-line-
Show the current state of DWARF line table debugging.
set debug dwarf-read-
Turns on or off display of debugging messages related to reading
DWARF debug info. The default is 0 (off).
A value of 1 provides basic information.
A value greater than 1 provides more verbose information. show debug dwarf-read-
Show the current state of DWARF reader debugging.
set debug displaced-
Turns on or off display of GDB debugging info for the
displaced stepping support. The default is off. show debug displaced-
Displays the current state of displaying GDB debugging info
related to displaced stepping. set debug event-
Turns on or off display of GDB event debugging info. The
default is off. show debug event-
Displays the current state of displaying GDB event debugging
info. set debug event-loop-
Controls output of debugging info about the event loop. The possible
values are ‘off’, ‘all’ (shows all debugging info) and
‘all-except-ui’ (shows all debugging info except those about
UI-related events). show debug event-loop-
Shows the current state of displaying debugging info about the event
loop. set debug expression-
Turns on or off display of debugging info about GDB
expression parsing. The default is off. show debug expression-
Displays the current state of displaying debugging info about
GDB expression parsing. set debug fbsd-lwp-
Turns on or off debugging messages from the FreeBSD LWP debug support.
show debug fbsd-lwp-
Show the current state of FreeBSD LWP debugging messages.
set debug fbsd-nat-
Turns on or off debugging messages from the FreeBSD native target.
show debug fbsd-nat-
Show the current state of FreeBSD native target debugging messages.
set debug fortran-array-slicing-
Turns on or off display of GDB Fortran array slicing
debugging info. The default is off. show debug fortran-array-slicing-
Displays the current state of displaying GDB Fortran array
slicing debugging info. set debug frame-
Turns on or off display of GDB frame debugging info. The
default is off. show debug frame-
Displays the current state of displaying GDB frame debugging
info. set debug gnu-nat-
Turn on or off debugging messages from the GNU/Hurd debug support.
show debug gnu-nat-
Show the current state of GNU/Hurd debugging messages.
set debug infrun-
Turns on or off display of GDB debugging info for running the inferior.
The default is off. infrun.c contains GDB’s runtime state machine used
for implementing operations such as single-stepping the inferior. show debug infrun-
Displays the current state of GDB inferior debugging.
set debug infcall-
Turns on or off display of debugging info related to inferior function
calls made by GDB. show debug infcall-
Displays the current state of GDB inferior function call debugging.
set debug jit-
Turn on or off debugging messages from JIT debug support.
show debug jit-
Displays the current state of GDB JIT debugging.
set debug linux-nat [on|off]-
Turn on or off debugging messages from the Linux native target debug support.
show debug linux-nat-
Show the current state of Linux native target debugging messages.
set debug linux-namespaces-
Turn on or off debugging messages from the Linux namespaces debug support.
show debug linux-namespaces-
Show the current state of Linux namespaces debugging messages.
set debug mach-o-
Control display of debugging messages related to Mach-O symbols
processing. The default is off. show debug mach-o-
Displays the current state of displaying debugging messages related to
reading of COFF/PE exported symbols. set debug notification-
Turn on or off debugging messages about remote async notification.
The default is off. show debug notification-
Displays the current state of remote async notification debugging messages.
set debug observer-
Turns on or off display of GDB observer debugging. This
includes info such as the notification of observable events. show debug observer-
Displays the current state of observer debugging.
set debug overload-
Turns on or off display of GDB C++ overload debugging
info. This includes info such as ranking of functions, etc. The default
is off. show debug overload-
Displays the current state of displaying GDB C++ overload
debugging info. set debug parser-
Turns on or off the display of expression parser debugging output.
Internally, this sets theyydebugvariable in the expression
parser. See Tracing Your Parser in Bison, for
details. The default is off. show debug parser-
Show the current state of expression parser debugging.
set debug remote-
Turns on or off display of reports on all packets sent back and forth across
the serial line to the remote machine. The info is printed on the
GDB standard output stream. The default is off. show debug remote-
Displays the state of display of remote packets.
set debug remote-packet-max-chars-
Sets the maximum number of characters to display for each remote packet when
set debug remoteis on. This is useful to prevent GDB from
displaying lengthy remote packets and polluting the console.The default value is
512, which means GDB will truncate each
remote packet after 512 bytes.Setting this option to
unlimitedwill disable truncation and will output
the full length of the remote packets. show debug remote-packet-max-chars-
Displays the number of bytes to output for remote packet debugging.
set debug separate-debug-file-
Turns on or off display of debug output about separate debug file search.
show debug separate-debug-file-
Displays the state of separate debug file search debug output.
set debug serial-
Turns on or off display of GDB serial debugging info. The
default is off. show debug serial-
Displays the current state of displaying GDB serial debugging
info. set debug solib-
Turns on or off display of debugging messages related to shared libraries.
The default is off. show debug solib-
Show the current state of solib debugging messages.
set debug symbol-lookup-
Turns on or off display of debugging messages related to symbol lookup.
The default is 0 (off).
A value of 1 provides basic information.
A value greater than 1 provides more verbose information. show debug symbol-lookup-
Show the current state of symbol lookup debugging messages.
set debug symfile-
Turns on or off display of debugging messages related to symbol file functions.
The default is off. See Files. show debug symfile-
Show the current state of symbol file debugging messages.
set debug symtab-create-
Turns on or off display of debugging messages related to symbol table creation.
The default is 0 (off).
A value of 1 provides basic information.
A value greater than 1 provides more verbose information. show debug symtab-create-
Show the current state of symbol table creation debugging.
set debug target-
Turns on or off display of GDB target debugging info. This info
includes what is going on at the target level of GDB, as it happens. The
default is 0. Set it to 1 to track events, and to 2 to also track the
value of large memory transfers. show debug target-
Displays the current state of displaying GDB target debugging
info. set debug timestamp-
Turns on or off display of timestamps with GDB debugging info.
When enabled, seconds and microseconds are displayed before each debugging
message. show debug timestamp-
Displays the current state of displaying timestamps with GDB
debugging info. set debug varobj-
Turns on or off display of GDB variable object debugging
info. The default is off. show debug varobj-
Displays the current state of displaying GDB variable object
debugging info. set debug xml-
Turn on or off debugging messages for built-in XML parsers.
show debug xml-
Displays the current state of XML debugging messages.
22.11 Other Miscellaneous Settings
set interactive-mode-
If
on, forces GDB to assume that GDB was started
in a terminal. In practice, this means that GDB should wait
for the user to answer queries generated by commands entered at
the command prompt. Ifoff, forces GDB to operate
in the opposite mode, and it uses the default answers to all queries.
Ifauto(the default), GDB tries to determine whether
its standard input is a terminal, and works in interactive-mode if it
is, non-interactively otherwise.In the vast majority of cases, the debugger should be able to guess
correctly which mode should be used. But this setting can be useful
in certain specific cases, such as running a MinGW GDB
inside a cygwin window. show interactive-mode-
Displays whether the debugger is operating in interactive mode or not.
set suppress-cli-notifications-
If
on, command-line-interface (CLI) notifications that are
printed by GDB are suppressed. Ifoff, the
notifications are printed as usual. The default value isoff.
CLI notifications occur when you change the selected context or when
the program being debugged stops, as detailed below.- User-selected context changes:
-
When you change the selected context (i.e. the current inferior,
thread and/or the frame), GDB prints information about the
new context. For example, the default behavior is below:(gdb) inferior 1 [Switching to inferior 1 [process 634] (/tmp/test)] [Switching to thread 1 (process 634)] #0 main () at test.c:3 3 return 0; (gdb)
When the notifications are suppressed, the new context is not printed:
(gdb) set suppress-cli-notifications on (gdb) inferior 1 (gdb)
- The program being debugged stops:
-
When the program you are debugging stops (e.g. because of hitting a
breakpoint, completing source-stepping, an interrupt, etc.),
GDB prints information about the stop event. For example,
below is a breakpoint hit:(gdb) break test.c:3 Breakpoint 2 at 0x555555555155: file test.c, line 3. (gdb) continue Continuing. Breakpoint 2, main () at test.c:3 3 return 0; (gdb)
When the notifications are suppressed, the output becomes:
(gdb) break test.c:3 Breakpoint 2 at 0x555555555155: file test.c, line 3. (gdb) set suppress-cli-notifications on (gdb) continue Continuing. (gdb)
Suppressing CLI notifications may be useful in scripts to obtain a
reduced output from a list of commands.
show suppress-cli-notifications-
Displays whether printing CLI notifications is suppressed or not.
23 Extending GDB
GDB provides several mechanisms for extension.
GDB also provides the ability to automatically load
extensions when it reads a file for debugging. This allows the
user to automatically customize GDB for the program
being debugged.
To facilitate the use of extension languages, GDB is capable
of evaluating the contents of a file. When doing so, GDB
can recognize which extension language is being used by looking at
the filename extension. Files with an unrecognized filename extension
are always treated as a GDB Command Files.
See Command files.
You can control how GDB evaluates these files with the following
setting:
set script-extension off-
All scripts are always evaluated as GDB Command Files.
set script-extension soft-
The debugger determines the scripting language based on filename
extension. If this scripting language is supported, GDB
evaluates the script using that language. Otherwise, it evaluates
the file as a GDB Command File. set script-extension strict-
The debugger determines the scripting language based on filename
extension, and evaluates the script using that language. If the
language is not supported, then the evaluation fails. show script-extension-
Display the current value of the
script-extensionoption.
23.1 Canned Sequences of Commands
Aside from breakpoint commands (see Breakpoint
Command Lists), GDB provides two ways to store sequences of
commands for execution as a unit: user-defined commands and command
files.
23.1.1 User-defined Commands
A user-defined command is a sequence of GDB commands to
which you assign a new name as a command. This is done with the
define command. User commands may accept an unlimited number of arguments
separated by whitespace. Arguments are accessed within the user command
via $arg0…$argN. A trivial example:
define adder print $arg0 + $arg1 + $arg2 end
To execute the command use:
This defines the command adder, which prints the sum of
its three arguments. Note the arguments are text substitutions, so they may
reference variables, use complex expressions, or even perform inferior
functions calls.
In addition, $argc may be used to find out how many arguments have
been passed.
define adder
if $argc == 2
print $arg0 + $arg1
end
if $argc == 3
print $arg0 + $arg1 + $arg2
end
end
Combining with the eval command (see eval) makes it easier
to process a variable number of arguments:
define adder
set $i = 0
set $sum = 0
while $i < $argc
eval "set $sum = $sum + $arg%d", $i
set $i = $i + 1
end
print $sum
end
define commandname-
Define a command named commandname. If there is already a command
by that name, you are asked to confirm that you want to redefine it.
The argument commandname may be a bare command name consisting of letters,
numbers, dashes, dots, and underscores. It may also start with any
predefined or user-defined prefix command.
For example, ‘define target my-target’ creates
a user-defined ‘target my-target’ command.The definition of the command is made up of other GDB command lines,
which are given following thedefinecommand. The end of these
commands is marked by a line containingend. document commandname-
Document the user-defined command commandname, so that it can be
accessed byhelp. The command commandname must already be
defined. This command reads lines of documentation just asdefine
reads the lines of the command definition, ending withend.
After thedocumentcommand is finished,helpon command
commandname displays the documentation you have written.You may use the
documentcommand again to change the
documentation of a command. Redefining the command withdefine
does not change the documentation.It is also possible to document user-defined aliases. The alias documentation
will then be used by thehelpandaproposcommands
instead of the documentation of the aliased command.
Documenting a user-defined alias is particularly useful when defining
an alias as a set of nestedwithcommands
(see Command aliases default args). define-prefix commandname-
Define or mark the command commandname as a user-defined prefix
command. Once marked, commandname can be used as prefix command
by thedefinecommand.
Note thatdefine-prefixcan be used with a not yet defined
commandname. In such a case, commandname is defined as
an empty user-defined command.
In case you redefine a command that was marked as a user-defined
prefix command, the subcommands of the redefined command are kept
(and GDB indicates so to the user).Example:
(gdb) define-prefix abc (gdb) define-prefix abc def (gdb) define abc def Type commands for definition of "abc def". End with a line saying just "end". >echo command initial defn >end (gdb) define abc def ghi Type commands for definition of "abc def ghi". End with a line saying just "end". >echo command ghin >end (gdb) define abc def Keeping subcommands of prefix command "def". Redefine command "def"? (y or n) y Type commands for definition of "abc def". End with a line saying just "end". >echo command defn >end (gdb) abc def ghi command ghi (gdb) abc def command def (gdb)
dont-repeat-
Used inside a user-defined command, this tells GDB that this
command should not be repeated when the user hits RET
(see repeat last command). help user-defined-
List all user-defined commands and all python commands defined in class
COMMAND_USER. The first line of the documentation or docstring is
included (if any). show usershow user commandname-
Display the GDB commands used to define commandname (but
not its documentation). If no commandname is given, display the
definitions for all user-defined commands.
This does not work for user-defined python commands. show max-user-call-depthset max-user-call-depth-
The value of
max-user-call-depthcontrols how many recursion
levels are allowed in user-defined commands before GDB suspects an
infinite recursion and aborts the command.
This does not apply to user-defined python commands.
In addition to the above commands, user-defined commands frequently
use control flow commands, described in Command Files.
When user-defined commands are executed, the
commands of the definition are not printed. An error in any command
stops execution of the user-defined command.
If used interactively, commands that would ask for confirmation proceed
without asking when used inside a user-defined command. Many GDB
commands that normally print messages to say what they are doing omit the
messages when used in a user-defined command.
23.1.2 User-defined Command Hooks
You may define hooks, which are a special kind of user-defined
command. Whenever you run the command ‘foo’, if the user-defined
command ‘hook-foo’ exists, it is executed (with no arguments)
before that command.
A hook may also be defined which is run after the command you executed.
Whenever you run the command ‘foo’, if the user-defined command
‘hookpost-foo’ exists, it is executed (with no arguments) after
that command. Post-execution hooks may exist simultaneously with
pre-execution hooks, for the same command.
It is valid for a hook to call the command which it hooks. If this
occurs, the hook is not re-executed, thereby avoiding infinite recursion.
In addition, a pseudo-command, ‘stop’ exists. Defining
(‘hook-stop’) makes the associated commands execute every time
execution stops in your program: before breakpoint commands are run,
displays are printed, or the stack frame is printed.
For example, to ignore SIGALRM signals while
single-stepping, but treat them normally during normal execution,
you could define:
define hook-stop handle SIGALRM nopass end define hook-run handle SIGALRM pass end define hook-continue handle SIGALRM pass end
As a further example, to hook at the beginning and end of the echo
command, and to add extra text to the beginning and end of the message,
you could define:
define hook-echo echo <<<--- end define hookpost-echo echo --->>>n end (gdb) echo Hello World <<<---Hello World--->>> (gdb)
You can define a hook for any single-word command in GDB, but
not for command aliases; you should define a hook for the basic command
name, e.g. backtrace rather than bt.
You can hook a multi-word command by adding hook- or
hookpost- to the last word of the command, e.g.
‘define target hook-remote’ to add a hook to ‘target remote’.
If an error occurs during the execution of your hook, execution of
GDB commands stops and GDB issues a prompt
(before the command that you actually typed had a chance to run).
If you try to define a hook which does not match any known command, you
get a warning from the define command.
23.1.3 Command Files
A command file for GDB is a text file made of lines that are
GDB commands. Comments (lines starting with #) may
also be included. An empty line in a command file does nothing; it
does not mean to repeat the last command, as it would from the
terminal.
You can request the execution of a command file with the source
command. Note that the source command is also used to evaluate
scripts that are not Command Files. The exact behavior can be configured
using the script-extension setting.
See Extending GDB.
source [-s] [-v] filename-
Execute the command file filename.
The lines in a command file are generally executed sequentially,
unless the order of execution is changed by one of the
flow-control commands described below. The commands are not
printed as they are executed. An error in any command terminates
execution of the command file and control is returned to the console.
GDB first searches for filename in the current directory.
If the file is not found there, and filename does not specify a
directory, then GDB also looks for the file on the source search path
(specified with the ‘directory’ command);
except that $cdir is not searched because the compilation directory
is not relevant to scripts.
If -s is specified, then GDB searches for filename
on the search path even if filename specifies a directory.
The search is done by appending filename to each element of the
search path. So, for example, if filename is mylib/myscript
and the search path contains /home/user then GDB will
look for the script /home/user/mylib/myscript.
The search is also done if filename is an absolute path.
For example, if filename is /tmp/myscript and
the search path contains /home/user then GDB will
look for the script /home/user/tmp/myscript.
For DOS-like systems, if filename contains a drive specification,
it is stripped before concatenation. For example, if filename is
d:myscript and the search path contains c:/tmp then GDB
will look for the script c:/tmp/myscript.
If -v, for verbose mode, is given then GDB displays
each command as it is executed. The option must be given before
filename, and is interpreted as part of the filename anywhere else.
Commands that would ask for confirmation if used interactively proceed
without asking when used in a command file. Many GDB commands that
normally print messages to say what they are doing omit the messages
when called from command files.
GDB also accepts command input from standard input. In this
mode, normal output goes to standard output and error output goes to
standard error. Errors in a command file supplied on standard input do
not terminate execution of the command file—execution continues with
the next command.
(The syntax above will vary depending on the shell used.) This example
will execute commands from the file cmds. All output and errors
would be directed to log.
Since commands stored on command files tend to be more general than
commands typed interactively, they frequently need to deal with
complicated situations, such as different or unexpected values of
variables and symbols, changes in how the program being debugged is
built, etc. GDB provides a set of flow-control commands to
deal with these complexities. Using these commands, you can write
complex scripts that loop over data structures, execute commands
conditionally, etc.
ifelse-
This command allows to include in your script conditionally executed
commands. Theifcommand takes a single argument, which is an
expression to evaluate. It is followed by a series of commands that
are executed only if the expression is true (its value is nonzero).
There can then optionally be anelseline, followed by a series
of commands that are only executed if the expression was false. The
end of the list is marked by a line containingend. while-
This command allows to write loops. Its syntax is similar to
if: the command takes a single argument, which is an expression
to evaluate, and must be followed by the commands to execute, one per
line, terminated by anend. These commands are called the
body of the loop. The commands in the body ofwhileare
executed repeatedly as long as the expression evaluates to true. loop_break-
This command exits the
whileloop in whose body it is included.
Execution of the script continues after thatwhilesend
line. loop_continue-
This command skips the execution of the rest of the body of commands
in thewhileloop in whose body it is included. Execution
branches to the beginning of thewhileloop, where it evaluates
the controlling expression. end-
Terminate the block of commands that are the body of
if,
else, orwhileflow-control commands.
23.1.4 Commands for Controlled Output
During the execution of a command file or a user-defined command, normal
GDB output is suppressed; the only output that appears is what is
explicitly printed by the commands in the definition. This section
describes three commands useful for generating exactly the output you
want.
echo text-
Print text. Nonprinting characters can be included in
text using C escape sequences, such as ‘n’ to print a
newline. No newline is printed unless you specify one.
In addition to the standard C escape sequences, a backslash followed
by a space stands for a space. This is useful for displaying a
string with spaces at the beginning or the end, since leading and
trailing spaces are otherwise trimmed from all arguments.
To print ‘ and foo = ’, use the command
‘echo and foo = ’.A backslash at the end of text can be used, as in C, to continue
the command onto subsequent lines. For example,echo This is some textn which is continuedn onto several lines.n
produces the same output as
echo This is some textn echo which is continuedn echo onto several lines.n
output expression-
Print the value of expression and nothing but that value: no
newlines, no ‘$nn = ’. The value is not entered in the
value history either. See Expressions, for more information
on expressions. output/fmt expression-
Print the value of expression in format fmt. You can use
the same formats as forprint. See Output
Formats, for more information. printf template, expressions…-
Print the values of one or more expressions under the control of
the string template. To print several values, make
expressions be a comma-separated list of individual expressions,
which may be either numbers or pointers. Their values are printed as
specified by template, exactly as a C program would do by
executing the code below:printf (template, expressions…);
As in
Cprintf, ordinary characters in template
are printed verbatim, while conversion specification introduced
by the ‘%’ character cause subsequent expressions to be
evaluated, their values converted and formatted according to type and
style information encoded in the conversion specifications, and then
printed.For example, you can print two values in hex like this:
printf "foo, bar-foo = 0x%x, 0x%xn", foo, bar-foo
printfsupports all the standardCconversion
specifications, including the flags and modifiers between the ‘%’
character and the conversion letter, with the following exceptions:- The argument-ordering modifiers, such as ‘2$’, are not supported.
- The modifier ‘*’ is not supported for specifying precision or
width. - The ‘‘’ flag (for separation of digits into groups according to
LC_NUMERIC') is not supported. - The type modifiers ‘hh’, ‘j’, ‘t’, and ‘z’ are not
supported. - The conversion letter ‘n’ (as in ‘%n’) is not supported.
- The conversion letters ‘a’ and ‘A’ are not supported.
Note that the ‘ll’ type modifier is supported only if the
underlyingCimplementation used to build GDB supports
thelong long inttype, and the ‘L’ type modifier is
supported only iflong doubletype is available.As in
C,printfsupports simple backslash-escape
sequences, such asn, ‘t’, ‘\’, ‘«’,
‘a’, and ‘f’, that consist of backslash followed by a
single character. Octal and hexadecimal escape sequences are not
supported.Additionally,
printfsupports conversion specifications for DFP
(Decimal Floating Point) types using the following length modifiers
together with a floating point specifier.
letters:- ‘H’ for printing
Decimal32types. - ‘D’ for printing
Decimal64types. - ‘DD’ for printing
Decimal128types.
If the underlying
Cimplementation used to build GDB has
support for the three length modifiers for DFP types, other modifiers
such as width and precision will also be available for GDB to use.In case there is no such
Csupport, no additional modifiers will be
available and the value will be printed in the standard way.Here’s an example of printing DFP types using the above conversion letters:
printf "D32: %Hf - D64: %Df - D128: %DDfn",1.2345df,1.2E10dd,1.2E1dl
eval template, expressions…-
Convert the values of one or more expressions under the control of
the string template to a command line, and call it.
23.1.5 Controlling auto-loading native GDB scripts
When a new object file is read (for example, due to the file
command, or because the inferior has loaded a shared library),
GDB will look for the command file objfile-gdb.gdb.
See Auto-loading extensions.
Auto-loading can be enabled or disabled,
and the list of auto-loaded scripts can be printed.
set auto-load gdb-scripts [on|off]-
Enable or disable the auto-loading of canned sequences of commands scripts.
show auto-load gdb-scripts-
Show whether auto-loading of canned sequences of commands scripts is enabled or
disabled. info auto-load gdb-scripts [regexp]-
Print the list of all canned sequences of commands scripts that GDB
auto-loaded.
If regexp is supplied only canned sequences of commands scripts with
matching names are printed.
23.2 Command Aliases
Aliases allow you to define alternate spellings for existing commands.
For example, if a new GDB command defined in Python
(see Python) has a long name, it is handy to have an abbreviated
version of it that involves less typing.
GDB itself uses aliases. For example ‘s’ is an alias
of the ‘step’ command even though it is otherwise an ambiguous
abbreviation of other commands like ‘set’ and ‘show’.
Aliases are also used to provide shortened or more common versions
of multi-word commands. For example, GDB provides the
‘tty’ alias of the ‘set inferior-tty’ command.
You can define a new alias with the ‘alias’ command.
alias [-a] [--] alias = command [default-args]
alias specifies the name of the new alias. Each word of
alias must consist of letters, numbers, dashes and underscores.
command specifies the name of an existing command
that is being aliased.
command can also be the name of an existing alias. In this
case, command cannot be an alias that has default arguments.
The ‘-a’ option specifies that the new alias is an abbreviation
of the command. Abbreviations are not used in command completion.
The ‘—’ option specifies the end of options,
and is useful when alias begins with a dash.
You can specify default-args for your alias. These
default-args will be automatically added before the alias
arguments typed explicitly on the command line.
For example, the below defines an alias btfullall that shows all local
variables and all frame arguments:
(gdb) alias btfullall = backtrace -full -frame-arguments all
For more information about default-args, see Default Arguments.
Here is a simple example showing how to make an abbreviation of a
command so that there is less to type. Suppose you were tired of
typing ‘disas’, the current shortest unambiguous abbreviation of
the ‘disassemble’ command and you wanted an even shorter version
named ‘di’. The following will accomplish this.
(gdb) alias -a di = disas
Note that aliases are different from user-defined commands. With a
user-defined command, you also need to write documentation for it with
the ‘document’ command. An alias automatically picks up the
documentation of the existing command.
Here is an example where we make ‘elms’ an abbreviation of
‘elements’ in the ‘set print elements’ command.
This is to show that you can make an abbreviation of any part
of a command.
(gdb) alias -a set print elms = set print elements (gdb) alias -a show print elms = show print elements (gdb) set p elms 200 (gdb) show p elms Limit on string chars or array elements to print is 200.
Note that if you are defining an alias of a ‘set’ command,
and you want to have an alias for the corresponding ‘show’
command, then you need to define the latter separately.
Unambiguously abbreviated commands are allowed in command and
alias, just as they are normally.
(gdb) alias -a set pr elms = set p ele
Finally, here is an example showing the creation of a one word
alias for a more complex command.
This creates alias ‘spe’ of the command ‘set print elements’.
(gdb) alias spe = set print elements (gdb) spe 20
23.2.1 Default Arguments
You can tell GDB to always prepend some default arguments to
the list of arguments provided explicitly by the user when using a
user-defined alias.
If you repeatedly use the same arguments or options for a command, you
can define an alias for this command and tell GDB to
automatically prepend these arguments or options to the list of
arguments you type explicitly when using the alias18.
For example, if you often use the command thread apply all
specifying to work on the threads in ascending order and to continue in case it
encounters an error, you can tell GDB to automatically preprend
the -ascending and -c options by using:
(gdb) alias thread apply asc-all = thread apply all -ascending -c
Once you have defined this alias with its default args, any time you type
the thread apply asc-all followed by some arguments,
GDB will execute thread apply all -ascending -c some arguments.
To have even less to type, you can also define a one word alias:
(gdb) alias t_a_c = thread apply all -ascending -c
As usual, unambiguous abbreviations can be used for alias
and default-args.
The different aliases of a command do not share their default args.
For example, you define a new alias bt_ALL showing all possible
information and another alias bt_SMALL showing very limited information
using:
(gdb) alias bt_ALL = backtrace -entry-values both -frame-arg all -past-main -past-entry -full (gdb) alias bt_SMALL = backtrace -entry-values no -frame-arg none -past-main off -past-entry off
(For more on using the alias command, see Aliases.)
Default args are not limited to the arguments and options of command,
but can specify nested commands if command accepts such a nested command
as argument.
For example, the below defines faalocalsoftype that lists the
frames having locals of a certain type, together with the matching
local vars:
(gdb) alias faalocalsoftype = frame apply all info locals -q -t (gdb) faalocalsoftype int #1 0x55554f5e in sleeper_or_burner (v=0xdf50) at sleepers.c:86 i = 0 ret = 21845
This is also very useful to define an alias for a set of nested with
commands to have a particular combination of temporary settings. For example,
the below defines the alias pp10 that pretty prints an expression
argument, with a maximum of 10 elements if the expression is a string or
an array:
(gdb) alias pp10 = with print pretty -- with print elements 10 -- print
This defines the alias pp10 as being a sequence of 3 commands.
The first part with print pretty -- temporarily activates the setting
set print pretty, then launches the command that follows the separator
--.
The command following the first part is also a with command that
temporarily changes the setting set print elements to 10, then
launches the command that follows the second separator --.
The third part print is the command the pp10 alias will launch,
using the temporary values of the settings and the arguments explicitly given
by the user.
For more information about the with command usage,
see Command Settings.
By default, asking the help for an alias shows the documentation of
the aliased command. When the alias is a set of nested commands, help
of an alias shows the documentation of the first command. This help
is not particularly useful for an alias such as pp10.
For such an alias, it is useful to give a specific documentation
using the document command (see document).
23.3 Extending GDB using Python
You can extend GDB using the Python programming language. This feature is available only if
GDB was configured using —with-python.
Python scripts used by GDB should be installed in
data-directory/python, where data-directory is
the data directory as determined at GDB startup (see Data Files).
This directory, known as the python directory,
is automatically added to the Python Search Path in order to allow
the Python interpreter to locate all scripts installed at this location.
Additionally, GDB commands and convenience functions which
are written in Python and are located in the
data-directory/python/gdb/command or
data-directory/python/gdb/function directories are
automatically imported when GDB starts.
23.3.1 Python Commands
GDB provides two commands for accessing the Python interpreter,
and one related setting:
python-interactive [command]pi [command]-
Without an argument, the
python-interactivecommand can be used
to start an interactive Python prompt. To return to GDB,
type theEOFcharacter (e.g., Ctrl-D on an empty prompt).Alternatively, a single-line Python command can be given as an
argument and evaluated. If the command is an expression, the result
will be printed; otherwise, nothing will be printed. For example:(gdb) python-interactive 2 + 3 5
python [command]py [command]-
The
pythoncommand can be used to evaluate Python code.If given an argument, the
pythoncommand will evaluate the
argument as a Python command. For example:If you do not provide an argument to
python, it will act as a
multi-line command, likedefine. In this case, the Python
script is made up of subsequent command lines, given after the
pythoncommand. This command list is terminated using a line
containingend. For example:(gdb) python >print 23 >end 23
set python print-stack-
By default, GDB will print only the message component of a
Python exception when an error occurs in a Python script. This can be
controlled usingset python print-stack: iffull, then
full Python stack printing is enabled; ifnone, then Python stack
and message printing is disabled; ifmessage, the default, only
the message component of the error is printed. set python ignore-environment [on|off]-
By default this option is ‘off’, and, when GDB
initializes its internal Python interpreter, the Python interpreter
will check the environment for variables that will effect how it
behaves, for examplePYTHONHOME, and
PYTHONPATH19.If this option is set to ‘on’ before Python is initialized then
Python will ignore all such environment variables. As Python is
initialized early during GDB’s startup process, then this
option must be placed into the early initialization file
(see Initialization Files) to have the desired effect.This option is equivalent to passing -E to the real
pythonexecutable. set python dont-write-bytecode [auto|on|off]-
When this option is ‘off’, then, once GDB has
initialized the Python interpreter, the interpreter will byte-compile
any Python modules that it imports and write the byte code to disk in
.pyc files.If this option is set to ‘on’ before Python is initialized then
Python will no longer write the byte code to disk. As Python is
initialized early during GDB’s startup process, then this
option must be placed into the early initialization file
(see Initialization Files) to have the desired effect.By default this option is set to ‘auto’. In this mode, provided
thepython ignore-environmentsetting is ‘off’, the
environment variablePYTHONDONTWRITEBYTECODEis examined to see
if it should write out byte-code or not.
PYTHONDONTWRITEBYTECODEis considered to be off/disabled either
when set to the empty string or when the environment variable doesn’t
exist. All other settings, including those which don’t seem to make
sense, indicate that it’s on/enabled.This option is equivalent to passing -B to the real
pythonexecutable.
It is also possible to execute a Python script from the GDB
interpreter:
source script-name-
The script name must end with ‘.py’ and GDB must be configured
to recognize the script language based on filename extension using
thescript-extensionsetting. See Extending GDB.
The following commands are intended to help debug GDB itself:
set debug py-breakpoint on|offshow debug py-breakpoint-
When ‘on’, GDB prints debug messages related to the
Python breakpoint API. This is ‘off’ by default. set debug py-unwind on|offshow debug py-unwind-
When ‘on’, GDB prints debug messages related to the
Python unwinder API. This is ‘off’ by default.
23.3.2 Python API
You can get quick online help for GDB’s Python API by issuing
the command python help (gdb).
Functions and methods which have two or more optional arguments allow
them to be specified using keyword syntax. This allows passing some
optional arguments while skipping others. Example:
gdb.some_function ('foo', bar = 1, baz = 2).
23.3.2.1 Basic Python
At startup, GDB overrides Python’s sys.stdout and
sys.stderr to print using GDB’s output-paging streams.
A Python program which outputs to one of these streams may have its
output interrupted by the user (see Screen Size). In this
situation, a Python KeyboardInterrupt exception is thrown.
Some care must be taken when writing Python code to run in
GDB. Two things worth noting in particular:
- GDB install handlers for
SIGCHLDandSIGINT.
Python code must not override these, or even change the options using
sigaction. If your program changes the handling of these
signals, GDB will most likely stop working correctly. Note
that it is unfortunately common for GUI toolkits to install a
SIGCHLDhandler. - GDB takes care to mark its internal file descriptors as
close-on-exec. However, this cannot be done in a thread-safe way on
all platforms. Your Python programs should be aware of this and
should both create new file descriptors with the close-on-exec flag
set and arrange to close unneeded file descriptors before starting a
child process.
GDB introduces a new Python module, named gdb. All
methods and classes added by GDB are placed in this module.
GDB automatically imports the gdb module for
use in all scripts evaluated by the python command.
Some types of the gdb module come with a textual representation
(accessible through the repr or str functions). These are
offered for debugging purposes only, expect them to change over time.
- Variable: gdb.PYTHONDIR
-
A string containing the python directory (see Python).
- Function: gdb.execute (command [, from_tty [, to_string]])
-
Evaluate command, a string, as a GDB CLI command.
If a GDB exception happens while command runs, it is
translated as described in Exception Handling.The from_tty flag specifies whether GDB ought to consider this
command as having originated from the user invoking it interactively.
It must be a boolean value. If omitted, it defaults toFalse.By default, any output produced by command is sent to
GDB’s standard output (and to the log output if logging is
turned on). If the to_string parameter is
True, then output will be collected bygdb.executeand
returned as a string. The default isFalse, in which case the
return value isNone. If to_string isTrue, the
GDB virtual terminal will be temporarily set to unlimited width
and height, and its pagination will be disabled; see Screen Size.
- Function: gdb.breakpoints ()
-
Return a sequence holding all of GDB’s breakpoints.
See Breakpoints In Python, for more information. In GDB
version 7.11 and earlier, this function returnedNoneif there
were no breakpoints. This peculiarity was subsequently fixed, and now
gdb.breakpointsreturns an empty sequence in this case.
- Function: gdb.rbreak (regex [, minsyms [, throttle, [, symtabs ]]])
-
Return a Python list holding a collection of newly set
gdb.Breakpointobjects matching function names defined by the
regex pattern. If the minsyms keyword isTrue, all
system functions (those not explicitly defined in the inferior) will
also be included in the match. The throttle keyword takes an
integer that defines the maximum number of pattern matches for
functions matched by the regex pattern. If the number of
matches exceeds the integer value of throttle, a
RuntimeErrorwill be raised and no breakpoints will be created.
If throttle is not defined then there is no imposed limit on the
maximum number of matches and breakpoints to be created. The
symtabs keyword takes a Python iterable that yields a collection
ofgdb.Symtabobjects and will restrict the search to those
functions only contained within thegdb.Symtabobjects.
- Function: gdb.parameter (parameter)
-
Return the value of a GDB parameter given by its name,
a string; the parameter name string may contain spaces if the parameter has a
multi-part name. For example, ‘print object’ is a valid
parameter name.If the named parameter does not exist, this function throws a
gdb.error(see Exception Handling). Otherwise, the
parameter’s value is converted to a Python value of the appropriate
type, and returned.
- Function: gdb.set_parameter (name, value)
-
Sets the gdb parameter name to value. As with
gdb.parameter, the parameter name string may contain spaces if
the parameter has a multi-part name.
- Function: gdb.with_parameter (name, value)
-
Create a Python context manager (for use with the Python
withstatement) that temporarily sets the gdb parameter
name to value. On exit from the context, the previous
value will be restored.This uses
gdb.parameterin its implementation, so it can throw
the same exceptions as that function.For example, it’s sometimes useful to evaluate some Python code with a
particular gdb language:with gdb.with_parameter('language', 'pascal'): ... language-specific operations
- Function: gdb.history (number)
-
Return a value from GDB’s value history (see Value History). The number argument indicates which history element to return.
If number is negative, then GDB will take its absolute value
and count backward from the last element (i.e., the most recent element) to
find the value to return. If number is zero, then GDB will
return the most recent element. If the element specified by number
doesn’t exist in the value history, agdb.errorexception will be
raised.If no exception is raised, the return value is always an instance of
gdb.Value(see Values From Inferior).
- Function: gdb.add_history (value)
-
Takes value, an instance of
gdb.Value(see Values From Inferior), and appends the value this object represents to
GDB’s value history (see Value History), and return an
integer, its history number. If value is not a
gdb.Value, it is is converted using thegdb.Value
constructor. If value can’t be converted to agdb.Value
then aTypeErroris raised.When a command implemented in Python prints a single
gdb.Value
as its result, then placing the value into the history will allow the
user convenient access to those values via CLI history facilities.
- Function: gdb.history_count ()
-
Return an integer indicating the number of values in GDB’s
value history (see Value History).
- Function: gdb.convenience_variable (name)
-
Return the value of the convenience variable (see Convenience Vars) named name. name must be a string. The name
should not include the ‘$’ that is used to mark a convenience
variable in an expression. If the convenience variable does not
exist, thenNoneis returned.
- Function: gdb.set_convenience_variable (name, value)
-
Set the value of the convenience variable (see Convenience Vars)
named name. name must be a string. The name should not
include the ‘$’ that is used to mark a convenience variable in an
expression. If value isNone, then the convenience
variable is removed. Otherwise, if value is not a
gdb.Value(see Values From Inferior), it is is converted
using thegdb.Valueconstructor.
- Function: gdb.parse_and_eval (expression)
-
Parse expression, which must be a string, as an expression in
the current language, evaluate it, and return the result as a
gdb.Value.This function can be useful when implementing a new command
(see CLI Commands In Python, see GDB/MI Commands In Python),
as it provides a way to parse the
command’s argument as an expression. It is also useful simply to
compute values.
- Function: gdb.find_pc_line (pc)
-
Return the
gdb.Symtab_and_lineobject corresponding to the
pc value. See Symbol Tables In Python. If an invalid
value of pc is passed as an argument, then thesymtaband
lineattributes of the returnedgdb.Symtab_and_lineobject
will beNoneand 0 respectively. This is identical to
gdb.current_progspace().find_pc_line(pc)and is included for
historical compatibility.
- Function: gdb.post_event (event)
-
Put event, a callable object taking no arguments, into
GDB’s internal event queue. This callable will be invoked at
some later point, during GDB’s event processing. Events
posted usingpost_eventwill be run in the order in which they
were posted; however, there is no way to know when they will be
processed relative to other events inside GDB.GDB is not thread-safe. If your Python program uses multiple
threads, you must be careful to only call GDB-specific
functions in the GDB thread.post_eventensures
this. For example:(gdb) python >import threading > >class Writer(): > def __init__(self, message): > self.message = message; > def __call__(self): > gdb.write(self.message) > >class MyThread1 (threading.Thread): > def run (self): > gdb.post_event(Writer("Hello ")) > >class MyThread2 (threading.Thread): > def run (self): > gdb.post_event(Writer("Worldn")) > >MyThread1().start() >MyThread2().start() >end (gdb) Hello World
- Function: gdb.write (string [, stream])
-
Print a string to GDB’s paginated output stream. The
optional stream determines the stream to print to. The default
stream is GDB’s standard output stream. Possible stream
values are:gdb.STDOUT-
GDB’s standard output stream.
gdb.STDERR-
GDB’s standard error stream.
gdb.STDLOG-
GDB’s log stream (see Logging Output).
Writing to
sys.stdoutorsys.stderrwill automatically
call this function and will automatically direct the output to the
relevant stream.
- Function: gdb.flush ([, stream])
-
Flush the buffer of a GDB paginated stream so that the
contents are displayed immediately. GDB will flush the
contents of a stream automatically when it encounters a newline in the
buffer. The optional stream determines the stream to flush. The
default stream is GDB’s standard output stream. Possible
stream values are:gdb.STDOUT-
GDB’s standard output stream.
gdb.STDERR-
GDB’s standard error stream.
gdb.STDLOG-
GDB’s log stream (see Logging Output).
Flushing
sys.stdoutorsys.stderrwill automatically
call this function for the relevant stream.
- Function: gdb.target_charset ()
-
Return the name of the current target character set (see Character Sets). This differs from
gdb.parameter('target-charset')in
that ‘auto’ is never returned.
- Function: gdb.target_wide_charset ()
-
Return the name of the current target wide character set
(see Character Sets). This differs from
gdb.parameter('target-wide-charset')in that ‘auto’ is
never returned.
- Function: gdb.host_charset ()
-
Return a string, the name of the current host character set
(see Character Sets). This differs from
gdb.parameter('host-charset')in that ‘auto’ is never
returned.
- Function: gdb.solib_name (address)
-
Return the name of the shared library holding the given address
as a string, orNone. This is identical to
gdb.current_progspace().solib_name(address)and is included for
historical compatibility.
- Function: gdb.decode_line ([expression])
-
Return locations of the line specified by expression, or of the
current line if no argument was given. This function returns a Python
tuple containing two elements. The first element contains a string
holding any unparsed section of expression (orNoneif
the expression has been fully parsed). The second element contains
eitherNoneor another tuple that contains all the locations
that match the expression represented asgdb.Symtab_and_line
objects (see Symbol Tables In Python). If expression is
provided, it is decoded the way that GDB’s inbuilt
breakoreditcommands do (see Location Specifications).
- Function: gdb.prompt_hook (current_prompt)
-
If prompt_hook is callable, GDB will call the method
assigned to this operation before a prompt is displayed by
GDB.The parameter
current_promptcontains the current GDB
prompt. This method must return a Python string, orNone. If
a string is returned, the GDB prompt will be set to that
string. IfNoneis returned, GDB will continue to use
the current prompt.Some prompts cannot be substituted in GDB. Secondary prompts
such as those used by readline for command input, and annotation
related prompts are prohibited from being changed.
- Function: gdb.architecture_names ()
-
Return a list containing all of the architecture names that the
current build of GDB supports. Each architecture name is a
string. The names returned in this list are the same names as are
returned fromgdb.Architecture.name
(see Architecture.name).
- Function: gdb.connections
-
Return a list of
gdb.TargetConnectionobjects, one for each
currently active connection (see Connections In Python). The
connection objects are in no particular order in the returned list.
- Function: gdb.format_address (address [, progspace, architecture])
-
Return a string in the format ‘addr
<symbol+offset>’, where addr is address
formatted in hexadecimal, symbol is the symbol whose address is
the nearest to address and below it in memory, and offset
is the offset from symbol to address in decimal.If no suitable symbol was found, then the
<symbol+offset> part is not included in the returned
string, instead the returned string will just contain the
address formatted as hexadecimal. How far GDB looks
back for a suitable symbol can be controlled with set print
max-symbolic-offset (see Print Settings).Additionally, the returned string can include file name and line
number information when set print symbol-filename on
(see Print Settings), in this case the format of the returned
string is ‘addr <symbol+offset> at
filename:line-number’.The progspace is the gdb.Progspace in which symbol is
looked up, and architecture is used when formatting addr,
e.g. in order to determine the size of an address in bytes.If neither progspace or architecture are passed, then by
default GDB will use the program space and architecture of
the currently selected inferior, thus, the following two calls are
equivalent:gdb.format_address(address) gdb.format_address(address, gdb.selected_inferior().progspace, gdb.selected_inferior().architecture())It is not valid to only pass one of progspace or
architecture, either they must both be provided, or neither must
be provided (and the defaults will be used).This method uses the same mechanism for formatting address, symbol,
and offset information as core GDB does in commands such as
disassemble.Here are some examples of the possible string formats:
0x00001042 0x00001042 <symbol+16> 0x00001042 <symbol+16 at file.c:123>
- Function: gdb.current_language ()
-
Return the name of the current language as a string. Unlike
gdb.parameter('language'), this function will never return
‘auto’. If agdb.Frameobject is available (see Frames In Python), thelanguagemethod might be preferable in some
cases, as that is not affected by the user’s language setting.
23.3.2.2 Exception Handling
When executing the python command, Python exceptions
uncaught within the Python code are translated to calls to
GDB error-reporting mechanism. If the command that called
python does not handle the error, GDB will
terminate it and print an error message containing the Python
exception name, the associated value, and the Python call stack
backtrace at the point where the exception was raised. Example:
(gdb) python print foo Traceback (most recent call last): File "<string>", line 1, in <module> NameError: name 'foo' is not defined
GDB errors that happen in GDB commands invoked by
Python code are converted to Python exceptions. The type of the
Python exception depends on the error.
gdb.error-
This is the base class for most exceptions generated by GDB.
It is derived fromRuntimeError, for compatibility with earlier
versions of GDB.If an error occurring in GDB does not fit into some more
specific category, then the generated exception will have this type. gdb.MemoryError-
This is a subclass of
gdb.errorwhich is thrown when an
operation tried to access invalid memory in the inferior. KeyboardInterrupt-
User interrupt (via C-c or by typing q at a pagination
prompt) is translated to a PythonKeyboardInterruptexception.
In all cases, your exception handler will see the GDB error
message as its value and the Python call stack backtrace at the Python
statement closest to where the GDB error occured as the
traceback.
When implementing GDB commands in Python via
gdb.Command, or functions via gdb.Function, it is useful
to be able to throw an exception that doesn’t cause a traceback to be
printed. For example, the user may have invoked the command
incorrectly. GDB provides a special exception class that can
be used for this purpose.
gdb.GdbError-
When thrown from a command or function, this exception will cause the
command or function to fail, but the Python stack will not be
displayed. GDB does not throw this exception itself, but
rather recognizes it when thrown from user Python code. Example:(gdb) python >class HelloWorld (gdb.Command): > """Greet the whole world.""" > def __init__ (self): > super (HelloWorld, self).__init__ ("hello-world", gdb.COMMAND_USER) > def invoke (self, args, from_tty): > argv = gdb.string_to_argv (args) > if len (argv) != 0: > raise gdb.GdbError ("hello-world takes no arguments") > print ("Hello, World!") >HelloWorld () >end (gdb) hello-world 42 hello-world takes no arguments
23.3.2.3 Values From Inferior
GDB provides values it obtains from the inferior program in
an object of type gdb.Value. GDB uses this object
for its internal bookkeeping of the inferior’s values, and for
fetching values when necessary.
Inferior values that are simple scalars can be used directly in
Python expressions that are valid for the value’s data type. Here’s
an example for an integer or floating-point value some_val:
As result of this, bar will also be a gdb.Value object
whose values are of the same type as those of some_val. Valid
Python operations can also be performed on gdb.Value objects
representing a struct or class object. For such cases,
the overloaded operator (if present), is used to perform the operation.
For example, if val1 and val2 are gdb.Value objects
representing instances of a class which overloads the +
operator, then one can use the + operator in their Python script
as follows:
The result of the operation val3 is also a gdb.Value
object corresponding to the value returned by the overloaded +
operator. In general, overloaded operators are invoked for the
following operations: + (binary addition), - (binary
subtraction), * (multiplication), /, %, <<,
>>, |, &, ^.
Inferior values that are structures or instances of some class can
be accessed using the Python dictionary syntax. For example, if
some_val is a gdb.Value instance holding a structure, you
can access its foo element with:
Again, bar will also be a gdb.Value object. Structure
elements can also be accessed by using gdb.Field objects as
subscripts (see Types In Python, for more information on
gdb.Field objects). For example, if foo_field is a
gdb.Field object corresponding to element foo of the above
structure, then bar can also be accessed as follows:
bar = some_val[foo_field]
A gdb.Value that represents a function can be executed via
inferior function call. Any arguments provided to the call must match
the function’s prototype, and must be provided in the order specified
by that prototype.
For example, some_val is a gdb.Value instance
representing a function that takes two integers as arguments. To
execute this function, call it like so:
result = some_val (10,20)
Any values returned from a function call will be stored as a
gdb.Value.
The following attributes are provided:
- Variable: Value.address
-
If this object is addressable, this read-only attribute holds a
gdb.Valueobject representing the address. Otherwise,
this attribute holdsNone.
- Variable: Value.is_optimized_out
-
This read-only boolean attribute is true if the compiler optimized out
this value, thus it is not available for fetching from the inferior.
- Variable: Value.type
-
The type of this
gdb.Value. The value of this attribute is a
gdb.Typeobject (see Types In Python).
- Variable: Value.dynamic_type
-
The dynamic type of this
gdb.Value. This uses the object’s
virtual table and the C++ run-time type information
(RTTI) to determine the dynamic type of the value. If this
value is of class type, it will return the class in which the value is
embedded, if any. If this value is of pointer or reference to a class
type, it will compute the dynamic type of the referenced object, and
return a pointer or reference to that type, respectively. In all
other cases, it will return the value’s static type.Note that this feature will only work when debugging a C++ program
that includes RTTI for the object in question. Otherwise,
it will just return the static type of the value as in ptype foo
(see ptype).
- Variable: Value.is_lazy
-
The value of this read-only boolean attribute is
Trueif this
gdb.Valuehas not yet been fetched from the inferior.
GDB does not fetch values until necessary, for efficiency.
For example:myval = gdb.parse_and_eval ('somevar')The value of
somevaris not fetched at this time. It will be
fetched when the value is needed, or when thefetch_lazy
method is invoked.
The following methods are provided:
- Function: Value.__init__ (val)
-
Many Python values can be converted directly to a
gdb.Valuevia
this object initializer. Specifically:- Python boolean
-
A Python boolean is converted to the boolean type from the current
language. - Python integer
-
A Python integer is converted to the C
longtype for the
current architecture. - Python long
-
A Python long is converted to the C
long longtype for the
current architecture. - Python float
-
A Python float is converted to the C
doubletype for the
current architecture. - Python string
-
A Python string is converted to a target string in the current target
language using the current target encoding.
If a character cannot be represented in the current target encoding,
then an exception is thrown. gdb.Value-
If
valis agdb.Value, then a copy of the value is made. gdb.LazyString-
If
valis agdb.LazyString(see Lazy Strings In Python), then the lazy string’svaluemethod is called, and
its result is used.
- Function: Value.__init__ (val, type)
-
This second form of the
gdb.Valueconstructor returns a
gdb.Valueof type type where the value contents are taken
from the Python buffer object specified by val. The number of
bytes in the Python buffer object must be greater than or equal to the
size of type.If type is
Nonethen this version of__init__
behaves as though type was not passed at all.
- Function: Value.cast (type)
-
Return a new instance of
gdb.Valuethat is the result of
casting this instance to the type described by type, which must
be agdb.Typeobject. If the cast cannot be performed for some
reason, this method throws an exception.
- Function: Value.dereference ()
-
For pointer data types, this method returns a new
gdb.Valueobject
whose contents is the object pointed to by the pointer. For example, if
foois a C pointer to anint, declared in your C program asthen you can use the corresponding
gdb.Valueto access what
foopoints to like this:The result
barwill be agdb.Valueobject holding the
value pointed to byfoo.A similar function
Value.referenced_valueexists which also
returnsgdb.Valueobjects corresponding to the values pointed to
by pointer values (and additionally, values referenced by reference
values). However, the behavior ofValue.dereference
differs fromValue.referenced_valueby the fact that the
behavior ofValue.dereferenceis identical to applying the C
unary operator*on a given value. For example, consider a
reference to a pointerptrref, declared in your C++ program
astypedef int *intptr; ... int val = 10; intptr ptr = &val; intptr &ptrref = ptr;
Though
ptrrefis a reference value, one can apply the method
Value.dereferenceto thegdb.Valueobject corresponding
to it and obtain agdb.Valuewhich is identical to that
corresponding toval. However, if you apply the method
Value.referenced_value, the result would be agdb.Value
object identical to that corresponding toptr.py_ptrref = gdb.parse_and_eval ("ptrref") py_val = py_ptrref.dereference () py_ptr = py_ptrref.referenced_value ()The
gdb.Valueobjectpy_valis identical to that
corresponding toval, andpy_ptris identical to that
corresponding toptr. In general,Value.dereferencecan
be applied whenever the C unary operator*can be applied
to the corresponding C value. For those cases where applying both
Value.dereferenceandValue.referenced_valueis allowed,
the results obtained need not be identical (as we have seen in the above
example). The results are however identical when applied on
gdb.Valueobjects corresponding to pointers (gdb.Value
objects with type codeTYPE_CODE_PTR) in a C/C++ program.
- Function: Value.referenced_value ()
-
For pointer or reference data types, this method returns a new
gdb.Valueobject corresponding to the value referenced by the
pointer/reference value. For pointer data types,
Value.dereferenceandValue.referenced_valueproduce
identical results. The difference between these methods is that
Value.dereferencecannot get the values referenced by reference
values. For example, consider a reference to anint, declared
in your C++ program asint val = 10; int &ref = val;
then applying
Value.dereferenceto thegdb.Valueobject
corresponding torefwill result in an error, while applying
Value.referenced_valuewill result in agdb.Valueobject
identical to that corresponding toval.py_ref = gdb.parse_and_eval ("ref") er_ref = py_ref.dereference () # Results in error py_val = py_ref.referenced_value () # Returns the referenced valueThe
gdb.Valueobjectpy_valis identical to that
corresponding toval.
- Function: Value.reference_value ()
-
Return a
gdb.Valueobject which is a reference to the value
encapsulated by this instance.
- Function: Value.const_value ()
-
Return a
gdb.Valueobject which is aconstversion of the
value encapsulated by this instance.
- Function: Value.dynamic_cast (type)
-
Like
Value.cast, but works as if the C++dynamic_cast
operator were used. Consult a C++ reference for details.
- Function: Value.reinterpret_cast (type)
-
Like
Value.cast, but works as if the C++reinterpret_cast
operator were used. Consult a C++ reference for details.
- Function: Value.format_string (…)
-
Convert a
gdb.Valueto a string, similarly to what theprint
command does. Invoked with no arguments, this is equivalent to calling
thestrfunction on thegdb.Value. The representation of
the same value may change across different versions of GDB, so
you shouldn’t, for instance, parse the strings returned by this method.All the arguments are keyword only. If an argument is not specified, the
current global default setting is used.raw-
Trueif pretty-printers (see Pretty Printing) should not be
used to format the value.Falseif enabled pretty-printers
matching the type represented by thegdb.Valueshould be used to
format it. pretty_arrays-
Trueif arrays should be pretty printed to be more convenient to
read,Falseif they shouldn’t (seeset print arrayin
Print Settings). pretty_structs-
Trueif structs should be pretty printed to be more convenient to
read,Falseif they shouldn’t (seeset print prettyin
Print Settings). array_indexes-
Trueif array indexes should be included in the string
representation of arrays,Falseif they shouldn’t (seesetin Print Settings).
print array-indexes symbols-
Trueif the string representation of a pointer should include the
corresponding symbol name (if one exists),Falseif it shouldn’t
(seeset print symbolin Print Settings). unions-
Trueif unions which are contained in other structures or unions
should be expanded,Falseif they shouldn’t (seeset printin Print Settings).
union address-
Trueif the string representation of a pointer should include the
address,Falseif it shouldn’t (seeset print addressin
Print Settings). nibbles-
Trueif binary values should be displayed in groups of four bits,
known as nibbles.Falseif it shouldn’t (see set print nibbles). deref_refs-
Trueif C++ references should be resolved to the value they
refer to,False(the default) if they shouldn’t. Note that, unlike
for theprintcommand, references are not automatically expanded
when using theformat_stringmethod or thestr
function. There is no globalprintsetting to change the default
behaviour. actual_objects-
Trueif the representation of a pointer to an object should
identify the actual (derived) type of the object rather than the
declared type, using the virtual function table.Falseif
the declared type should be used. (Seeset print objectin
Print Settings). static_members-
Trueif static members should be included in the string
representation of a C++ object,Falseif they shouldn’t (see
set print static-membersin Print Settings). max_elements-
Number of array elements to print, or
0to print an unlimited
number of elements (seeset print elementsin Print Settings). max_depth-
The maximum depth to print for nested structs and unions, or
-1
to print an unlimited number of elements (seeset printin Print Settings).
max-depth repeat_threshold-
Set the threshold for suppressing display of repeated array elements, or
0to represent all elements, even if repeated. (Seesetin Print Settings).
print repeats format-
A string containing a single character representing the format to use for
the returned string. For instance,'x'is equivalent to using the
GDB commandprintwith the/xoption and formats
the value as a hexadecimal number. styling-
Trueif GDB should apply styling to the returned
string. When styling is applied, the returned string might contain
ANSI terminal escape sequences. Escape sequences will only be
included if styling is turned on, see Output Styling.
Additionally, GDB only styles some value contents, so not
every output string will contain escape sequences.When
False, which is the default, no output styling is applied. summary-
Truewhen just a summary should be printed. In this mode,
scalar values are printed in their entirety, but aggregates such as
structures or unions are omitted. This mode is used byset(see Print Settings).
print frame-arguments scalars
- Function: Value.string ([encoding[, errors[, length]]])
-
If this
gdb.Valuerepresents a string, then this method
converts the contents to a Python string. Otherwise, this method will
throw an exception.Values are interpreted as strings according to the rules of the
current language. If the optional length argument is given, the
string will be converted to that length, and will include any embedded
zeroes that the string may contain. Otherwise, for languages
where the string is zero-terminated, the entire string will be
converted.For example, in C-like languages, a value is a string if it is a pointer
to or an array of characters or ints of typewchar_t,char16_t,
orchar32_t.If the optional encoding argument is given, it must be a string
naming the encoding of the string in thegdb.Value, such as
"ascii","iso-8859-6"or"utf-8". It accepts
the same encodings as the corresponding argument to Python’s
string.decodemethod, and the Python codec machinery will be used
to convert the string. If encoding is not given, or if
encoding is the empty string, then either thetarget-charset
(see Character Sets) will be used, or a language-specific encoding
will be used, if the current language is able to supply one.The optional errors argument is the same as the corresponding
argument to Python’sstring.decodemethod.If the optional length argument is given, the string will be
fetched and converted to the given length.
- Function: Value.lazy_string ([encoding [, length]])
-
If this
gdb.Valuerepresents a string, then this method
converts the contents to agdb.LazyString(see Lazy Strings In Python). Otherwise, this method will throw an exception.If the optional encoding argument is given, it must be a string
naming the encoding of thegdb.LazyString. Some examples are:
‘ascii’, ‘iso-8859-6’ or ‘utf-8’. If the
encoding argument is an encoding that GDB does
recognize, GDB will raise an error.When a lazy string is printed, the GDB encoding machinery is
used to convert the string during printing. If the optional
encoding argument is not provided, or is an empty string,
GDB will automatically select the encoding most suitable for
the string type. For further information on encoding in GDB
please see Character Sets.If the optional length argument is given, the string will be
fetched and encoded to the length of characters specified. If
the length argument is not provided, the string will be fetched
and encoded until a null of appropriate width is found.
- Function: Value.fetch_lazy ()
-
If the
gdb.Valueobject is currently a lazy value
(gdb.Value.is_lazyisTrue), then the value is
fetched from the inferior. Any errors that occur in the process
will produce a Python exception.If the
gdb.Valueobject is not a lazy value, this method
has no effect.This method does not return a value.
23.3.2.4 Types In Python
GDB represents types from the inferior using the class
gdb.Type.
The following type-related functions are available in the gdb
module:
- Function: gdb.lookup_type (name [, block])
-
This function looks up a type by its name, which must be a string.
If block is given, then name is looked up in that scope.
Otherwise, it is searched for globally.Ordinarily, this function will return an instance of
gdb.Type.
If the named type cannot be found, it will throw an exception.
Integer types can be found without looking them up by name.
See Architectures In Python, for the integer_type method.
If the type is a structure or class type, or an enum type, the fields
of that type can be accessed using the Python dictionary syntax.
For example, if some_type is a gdb.Type instance holding
a structure type, you can access its foo field with:
bar will be a gdb.Field object; see below under the
description of the Type.fields method for a description of the
gdb.Field class.
An instance of Type has the following attributes:
- Variable: Type.alignof
-
The alignment of this type, in bytes. Type alignment comes from the
debugging information; if it was not specified, then GDB will
use the relevant ABI to try to determine the alignment. In some
cases, even this is not possible, and zero will be returned.
- Variable: Type.code
-
The type code for this type. The type code will be one of the
TYPE_CODE_constants defined below.
- Variable: Type.dynamic
-
A boolean indicating whether this type is dynamic. In some
situations, such as Rustenumtypes or Ada variant records, the
concrete type of a value may vary depending on its contents. That is,
the declared type of a variable, or the type returned by
gdb.lookup_typemay be dynamic; while the type of the
variable’s value will be a concrete instance of that dynamic type.For example, consider this code:
Here, at least conceptually (whether your compiler actually does this
is a separate issue), examininggdb.lookup_symbol("array", ...).type
could yield agdb.Typewhich reports a size ofNone.
This is the dynamic type.However, examining
gdb.parse_and_eval("array").typewould yield
a concrete type, whose length would be known.
- Variable: Type.name
-
The name of this type. If this type has no name, then
None
is returned.
- Variable: Type.sizeof
-
The size of this type, in target
charunits. Usually, a
target’schartype will be an 8-bit byte. However, on some
unusual platforms, this type may have a different size. A dynamic
type may not have a fixed size; in this case, this attribute’s value
will beNone.
- Variable: Type.tag
-
The tag name for this type. The tag name is the name after
struct,union, orenumin C and C++; not all
languages have this concept. If this type has no tag name, then
Noneis returned.
- Variable: Type.objfile
-
The
gdb.Objfilethat this type was defined in, orNoneif
there is no associated objfile.
- Variable: Type.is_scalar
-
This property is
Trueif the type is a scalar type, otherwise,
this property isFalse. Examples of non-scalar types include
structures, unions, and classes.
- Variable: Type.is_signed
-
For scalar types (those for which
Type.is_scalaris
True), this property isTrueif the type is signed,
otherwise this property isFalse.Attempting to read this property for a non-scalar type (a type for
whichType.is_scalarisFalse), will raise a
ValueError.
The following methods are provided:
- Function: Type.fields ()
-
Return the fields of this type. The behavior depends on the type code:
- For structure and union types, this method returns the fields.
- Range types have two fields, the minimum and maximum values.
- Enum types have one field per enum constant.
- Function and method types have one field per parameter. The base types of
C++ classes are also represented as fields. - Array types have one field representing the array’s range.
- If the type does not fit into one of these categories, a
TypeError
is raised.
Each field is a
gdb.Fieldobject, with some pre-defined attributes:bitpos-
This attribute is not available for
enumorstatic
(as in C++) fields. The value is the position, counting
in bits, from the start of the containing type. Note that, in a
dynamic type, the position of a field may not be constant. In this
case, the value will beNone. Also, a dynamic type may have
fields that do not appear in a corresponding concrete type. enumval-
This attribute is only available for
enumfields, and its value
is the enumeration member’s integer representation. name-
The name of the field, or
Nonefor anonymous fields. artificial-
This is
Trueif the field is artificial, usually meaning that
it was provided by the compiler and not the user. This attribute is
always provided, and isFalseif the field is not artificial. is_base_class-
This is
Trueif the field represents a base class of a C++
structure. This attribute is always provided, and isFalse
if the field is not a base class of the type that is the argument of
fields, or if that type was not a C++ class. bitsize-
If the field is packed, or is a bitfield, then this will have a
non-zero value, which is the size of the field in bits. Otherwise,
this will be zero; in this case the field’s size is given by its type. type-
The type of the field. This is usually an instance of
Type,
but it can beNonein some situations. parent_type-
The type which contains this field. This is an instance of
gdb.Type.
- Function: Type.array (n1 [, n2])
-
Return a new
gdb.Typeobject which represents an array of this
type. If one argument is given, it is the inclusive upper bound of
the array; in this case the lower bound is zero. If two arguments are
given, the first argument is the lower bound of the array, and the
second argument is the upper bound of the array. An array’s length
must not be negative, but the bounds can be.
- Function: Type.vector (n1 [, n2])
-
Return a new
gdb.Typeobject which represents a vector of this
type. If one argument is given, it is the inclusive upper bound of
the vector; in this case the lower bound is zero. If two arguments are
given, the first argument is the lower bound of the vector, and the
second argument is the upper bound of the vector. A vector’s length
must not be negative, but the bounds can be.The difference between an
arrayand avectoris that
arrays behave like in C: when used in expressions they decay to a pointer
to the first element whereas vectors are treated as first class values.
- Function: Type.const ()
-
Return a new
gdb.Typeobject which represents a
const-qualified variant of this type.
- Function: Type.volatile ()
-
Return a new
gdb.Typeobject which represents a
volatile-qualified variant of this type.
- Function: Type.unqualified ()
-
Return a new
gdb.Typeobject which represents an unqualified
variant of this type. That is, the result is neitherconstnor
volatile.
- Function: Type.range ()
-
Return a Python
Tupleobject that contains two elements: the
low bound of the argument type and the high bound of that type. If
the type does not have a range, GDB will raise a
gdb.errorexception (see Exception Handling).
- Function: Type.reference ()
-
Return a new
gdb.Typeobject which represents a reference to this
type.
- Function: Type.pointer ()
-
Return a new
gdb.Typeobject which represents a pointer to this
type.
- Function: Type.strip_typedefs ()
-
Return a new
gdb.Typethat represents the real type,
after removing all layers of typedefs.
- Function: Type.target ()
-
Return a new
gdb.Typeobject which represents the target type
of this type.For a pointer type, the target type is the type of the pointed-to
object. For an array type (meaning C-like arrays), the target type is
the type of the elements of the array. For a function or method type,
the target type is the type of the return value. For a complex type,
the target type is the type of the elements. For a typedef, the
target type is the aliased type.If the type does not have a target, this method will throw an
exception.
- Function: Type.template_argument (n [, block])
-
If this
gdb.Typeis an instantiation of a template, this will
return a newgdb.Valueorgdb.Typewhich represents the
value of the nth template argument (indexed starting at 0).If this
gdb.Typeis not a template type, or if the type has fewer
than n template arguments, this will throw an exception.
Ordinarily, only C++ code will have template types.If block is given, then name is looked up in that scope.
Otherwise, it is searched for globally.
- Function: Type.optimized_out ()
-
Return
gdb.Valueinstance of this type whose value is optimized
out. This allows a frame decorator to indicate that the value of an
argument or a local variable is not known.
Each type has a code, which indicates what category this type falls
into. The available type categories are represented by constants
defined in the gdb module:
gdb.TYPE_CODE_PTR-
The type is a pointer.
gdb.TYPE_CODE_ARRAY-
The type is an array.
gdb.TYPE_CODE_STRUCT-
The type is a structure.
gdb.TYPE_CODE_UNION-
The type is a union.
gdb.TYPE_CODE_ENUM-
The type is an enum.
gdb.TYPE_CODE_FLAGS-
A bit flags type, used for things such as status registers.
gdb.TYPE_CODE_FUNC-
The type is a function.
gdb.TYPE_CODE_INT-
The type is an integer type.
gdb.TYPE_CODE_FLT-
A floating point type.
gdb.TYPE_CODE_VOID-
The special type
void. gdb.TYPE_CODE_SET-
A Pascal set type.
gdb.TYPE_CODE_RANGE-
A range type, that is, an integer type with bounds.
gdb.TYPE_CODE_STRING-
A string type. Note that this is only used for certain languages with
language-defined string types; C strings are not represented this way. gdb.TYPE_CODE_BITSTRING-
A string of bits. It is deprecated.
gdb.TYPE_CODE_ERROR-
An unknown or erroneous type.
gdb.TYPE_CODE_METHOD-
A method type, as found in C++.
gdb.TYPE_CODE_METHODPTR-
A pointer-to-member-function.
gdb.TYPE_CODE_MEMBERPTR-
A pointer-to-member.
gdb.TYPE_CODE_REF-
A reference type.
gdb.TYPE_CODE_RVALUE_REF-
A C++11 rvalue reference type.
gdb.TYPE_CODE_CHAR-
A character type.
gdb.TYPE_CODE_BOOL-
A boolean type.
gdb.TYPE_CODE_COMPLEX-
A complex float type.
gdb.TYPE_CODE_TYPEDEF-
A typedef to some other type.
gdb.TYPE_CODE_NAMESPACE-
A C++ namespace.
gdb.TYPE_CODE_DECFLOAT-
A decimal floating point type.
gdb.TYPE_CODE_INTERNAL_FUNCTION-
A function internal to GDB. This is the type used to represent
convenience functions. gdb.TYPE_CODE_XMETHOD-
A method internal to GDB. This is the type used to represent
xmethods (see Writing an Xmethod). gdb.TYPE_CODE_FIXED_POINT-
A fixed-point number.
gdb.TYPE_CODE_NAMESPACE-
A Fortran namelist.
Further support for types is provided in the gdb.types
Python module (see gdb.types).
23.3.2.5 Pretty Printing API
A pretty-printer is just an object that holds a value and implements a
specific interface, defined here. An example output is provided
(see Pretty Printing).
- Function: pretty_printer.children (self)
-
GDB will call this method on a pretty-printer to compute the
children of the pretty-printer’s value.This method must return an object conforming to the Python iterator
protocol. Each item returned by the iterator must be a tuple holding
two elements. The first element is the “name” of the child; the
second element is the child’s value. The value can be any Python
object which is convertible to a GDB value.This method is optional. If it does not exist, GDB will act
as though the value has no children.For efficiency, the
childrenmethod should lazily compute its
results. This will let GDB read as few elements as
necessary, for example when various print settings (see Print Settings) or-var-list-children(see GDB/MI Variable Objects) limit the number of elements to be displayed.Children may be hidden from display based on the value of ‘set
print max-depth’ (see Print Settings).
- Function: pretty_printer.display_hint (self)
-
The CLI may call this method and use its result to change the
formatting of a value. The result will also be supplied to an MI
consumer as a ‘displayhint’ attribute of the variable being
printed.This method is optional. If it does exist, this method must return a
string or the special valueNone.Some display hints are predefined by GDB:
- ‘array’
-
Indicate that the object being printed is “array-like”. The CLI
uses this to respect parameters such asset print elementsand
set print array. - ‘map’
-
Indicate that the object being printed is “map-like”, and that the
children of this value can be assumed to alternate between keys and
values. - ‘string’
-
Indicate that the object being printed is “string-like”. If the
printer’sto_stringmethod returns a Python string of some
kind, then GDB will call its internal language-specific
string-printing function to format the string. For the CLI this means
adding quotation marks, possibly escaping some characters, respecting
set print elements, and the like.
The special value
Nonecauses GDB to apply the default
display rules.
- Function: pretty_printer.to_string (self)
-
GDB will call this method to display the string
representation of the value passed to the object’s constructor.When printing from the CLI, if the
to_stringmethod exists,
then GDB will prepend its result to the values returned by
children. Exactly how this formatting is done is dependent on
the display hint, and may change as more hints are added. Also,
depending on the print settings (see Print Settings), the CLI may
print just the result ofto_stringin a stack trace, omitting
the result ofchildren.If this method returns a string, it is printed verbatim.
Otherwise, if this method returns an instance of
gdb.Value,
then GDB prints this value. This may result in a call to
another pretty-printer.If instead the method returns a Python value which is convertible to a
gdb.Value, then GDB performs the conversion and prints
the resulting value. Again, this may result in a call to another
pretty-printer. Python scalars (integers, floats, and booleans) and
strings are convertible togdb.Value; other types are not.Finally, if this method returns
Nonethen no further operations
are peformed in this method and nothing is printed.If the result is not one of these types, an exception is raised.
GDB provides a function which can be used to look up the
default pretty-printer for a gdb.Value:
- Function: gdb.default_visualizer (value)
-
This function takes a
gdb.Valueobject as an argument. If a
pretty-printer for this value exists, then it is returned. If no such
printer exists, then this returnsNone.
Normally, a pretty-printer can respect the user’s print settings
(including temporarily applied settings, such as ‘/x’) simply by
calling Value.format_string (see Values From Inferior).
However, these settings can also be queried directly:
- Function: gdb.print_options ()
-
Return a dictionary whose keys are the valid keywords that can be
given toValue.format_string, and whose values are the user’s
settings. During aprintor other operation, the values will
reflect any flags that are temporarily in effect.(gdb) python print (gdb.print_options ()['max_elements']) 200
23.3.2.6 Selecting Pretty-Printers
GDB provides several ways to register a pretty-printer:
globally, per program space, and per objfile. When choosing how to
register your pretty-printer, a good rule is to register it with the
smallest scope possible: that is prefer a specific objfile first, then
a program space, and only register a printer globally as a last
resort.
- Variable: gdb.pretty_printers
-
The Python list
gdb.pretty_printerscontains an array of
functions or callable objects that have been registered via addition
as a pretty-printer. Printers in this list are calledglobal
printers, they’re available when debugging all inferiors.
Each gdb.Progspace contains a pretty_printers attribute.
Each gdb.Objfile also contains a pretty_printers
attribute.
Each function on these lists is passed a single gdb.Value
argument and should return a pretty-printer object conforming to the
interface definition above (see Pretty Printing API). If a function
cannot create a pretty-printer for the value, it should return
None.
GDB first checks the pretty_printers attribute of each
gdb.Objfile in the current program space and iteratively calls
each enabled lookup routine in the list for that gdb.Objfile
until it receives a pretty-printer object.
If no pretty-printer is found in the objfile lists, GDB then
searches the pretty-printer list of the current program space,
calling each enabled function until an object is returned.
After these lists have been exhausted, it tries the global
gdb.pretty_printers list, again calling each enabled function until an
object is returned.
The order in which the objfiles are searched is not specified. For a
given list, functions are always invoked from the head of the list,
and iterated over sequentially until the end of the list, or a printer
object is returned.
For various reasons a pretty-printer may not work.
For example, the underlying data structure may have changed and
the pretty-printer is out of date.
The consequences of a broken pretty-printer are severe enough that
GDB provides support for enabling and disabling individual
printers. For example, if print frame-arguments is on,
a backtrace can become highly illegible if any argument is printed
with a broken printer.
Pretty-printers are enabled and disabled by attaching an enabled
attribute to the registered function or callable object. If this attribute
is present and its value is False, the printer is disabled, otherwise
the printer is enabled.
23.3.2.7 Writing a Pretty-Printer
A pretty-printer consists of two parts: a lookup function to detect
if the type is supported, and the printer itself.
Here is an example showing how a std::string printer might be
written. See Pretty Printing API, for details on the API this class
must provide.
class StdStringPrinter(object):
"Print a std::string"
def __init__(self, val):
self.val = val
def to_string(self):
return self.val['_M_dataplus']['_M_p']
def display_hint(self):
return 'string'
And here is an example showing how a lookup function for the printer
example above might be written.
def str_lookup_function(val):
lookup_tag = val.type.tag
if lookup_tag is None:
return None
regex = re.compile("^std::basic_string<char,.*>$")
if regex.match(lookup_tag):
return StdStringPrinter(val)
return None
The example lookup function extracts the value’s type, and attempts to
match it to a type that it can pretty-print. If it is a type the
printer can pretty-print, it will return a printer object. If not, it
returns None.
We recommend that you put your core pretty-printers into a Python
package. If your pretty-printers are for use with a library, we
further recommend embedding a version number into the package name.
This practice will enable GDB to load multiple versions of
your pretty-printers at the same time, because they will have
different names.
You should write auto-loaded code (see Python Auto-loading) such that it
can be evaluated multiple times without changing its meaning. An
ideal auto-load file will consist solely of imports of your
printer modules, followed by a call to a register pretty-printers with
the current objfile.
Taken as a whole, this approach will scale nicely to multiple
inferiors, each potentially using a different library version.
Embedding a version number in the Python package name will ensure that
GDB is able to load both sets of printers simultaneously.
Then, because the search for pretty-printers is done by objfile, and
because your auto-loaded code took care to register your library’s
printers with a specific objfile, GDB will find the correct
printers for the specific version of the library used by each
inferior.
To continue the std::string example (see Pretty Printing API),
this code might appear in gdb.libstdcxx.v6:
def register_printers(objfile):
objfile.pretty_printers.append(str_lookup_function)
And then the corresponding contents of the auto-load file would be:
import gdb.libstdcxx.v6 gdb.libstdcxx.v6.register_printers(gdb.current_objfile())
The previous example illustrates a basic pretty-printer.
There are a few things that can be improved on.
The printer doesn’t have a name, making it hard to identify in a
list of installed printers. The lookup function has a name, but
lookup functions can have arbitrary, even identical, names.
Second, the printer only handles one type, whereas a library typically has
several types. One could install a lookup function for each desired type
in the library, but one could also have a single lookup function recognize
several types. The latter is the conventional way this is handled.
If a pretty-printer can handle multiple data types, then its
subprinters are the printers for the individual data types.
The gdb.printing module provides a formal way of solving these
problems (see gdb.printing).
Here is another example that handles multiple types.
These are the types we are going to pretty-print:
struct foo { int a, b; };
struct bar { struct foo x, y; };
Here are the printers:
class fooPrinter:
"""Print a foo object."""
def __init__(self, val):
self.val = val
def to_string(self):
return ("a=<" + str(self.val["a"]) +
"> b=<" + str(self.val["b"]) + ">")
class barPrinter:
"""Print a bar object."""
def __init__(self, val):
self.val = val
def to_string(self):
return ("x=<" + str(self.val["x"]) +
"> y=<" + str(self.val["y"]) + ">")
This example doesn’t need a lookup function, that is handled by the
gdb.printing module. Instead a function is provided to build up
the object that handles the lookup.
import gdb.printing
def build_pretty_printer():
pp = gdb.printing.RegexpCollectionPrettyPrinter(
"my_library")
pp.add_printer('foo', '^foo$', fooPrinter)
pp.add_printer('bar', '^bar$', barPrinter)
return pp
And here is the autoload support:
import gdb.printing
import my_library
gdb.printing.register_pretty_printer(
gdb.current_objfile(),
my_library.build_pretty_printer())
Finally, when this printer is loaded into GDB, here is the
corresponding output of ‘info pretty-printer’:
(gdb) info pretty-printer
my_library.so:
my_library
foo
bar
23.3.2.8 Type Printing API
GDB provides a way for Python code to customize type display.
This is mainly useful for substituting canonical typedef names for
types.
A type printer is just a Python object conforming to a certain
protocol. A simple base class implementing the protocol is provided;
see gdb.types. A type printer must supply at least:
- Instance Variable of type_printer: enabled
-
A boolean which is True if the printer is enabled, and False
otherwise. This is manipulated by theenable type-printer
anddisable type-printercommands.
- Instance Variable of type_printer: name
-
The name of the type printer. This must be a string. This is used by
theenable type-printeranddisable type-printer
commands.
- Method on type_printer: instantiate (self)
-
This is called by GDB at the start of type-printing. It is
only called if the type printer is enabled. This method must return a
new object that supplies arecognizemethod, as described below.
When displaying a type, say via the ptype command, GDB
will compute a list of type recognizers. This is done by iterating
first over the per-objfile type printers (see Objfiles In Python),
followed by the per-progspace type printers (see Progspaces In Python), and finally the global type printers.
GDB will call the instantiate method of each enabled
type printer. If this method returns None, then the result is
ignored; otherwise, it is appended to the list of recognizers.
Then, when GDB is going to display a type name, it iterates
over the list of recognizers. For each one, it calls the recognition
function, stopping if the function returns a non-None value.
The recognition function is defined as:
- Method on type_recognizer: recognize (self, type)
-
If type is not recognized, return
None. Otherwise,
return a string which is to be printed as the name of type.
The type argument will be an instance ofgdb.Type
(see Types In Python).
GDB uses this two-pass approach so that type printers can
efficiently cache information without holding on to it too long. For
example, it can be convenient to look up type information in a type
printer and hold it for a recognizer’s lifetime; if a single pass were
done then type printers would have to make use of the event system in
order to avoid holding information that could become stale as the
inferior changed.
23.3.2.9 Filtering Frames
Frame filters are Python objects that manipulate the visibility of a
frame or frames when a backtrace (see Backtrace) is printed by
GDB.
Only commands that print a backtrace, or, in the case of GDB/MI
commands (see GDB/MI), those that return a collection of frames
are affected. The commands that work with frame filters are:
backtrace (see The backtrace command),
-stack-list-frames
(see The -stack-list-frames command),
-stack-list-variables (see The
-stack-list-variables command), -stack-list-arguments
see The -stack-list-arguments command) and
-stack-list-locals (see The
-stack-list-locals command).
A frame filter works by taking an iterator as an argument, applying
actions to the contents of that iterator, and returning another
iterator (or, possibly, the same iterator it was provided in the case
where the filter does not perform any operations). Typically, frame
filters utilize tools such as the Python’s itertools module to
work with and create new iterators from the source iterator.
Regardless of how a filter chooses to apply actions, it must not alter
the underlying GDB frame or frames, or attempt to alter the
call-stack within GDB. This preserves data integrity within
GDB. Frame filters are executed on a priority basis and care
should be taken that some frame filters may have been executed before,
and that some frame filters will be executed after.
An important consideration when designing frame filters, and well
worth reflecting upon, is that frame filters should avoid unwinding
the call stack if possible. Some stacks can run very deep, into the
tens of thousands in some cases. To search every frame when a frame
filter executes may be too expensive at that step. The frame filter
cannot know how many frames it has to iterate over, and it may have to
iterate through them all. This ends up duplicating effort as
GDB performs this iteration when it prints the frames. If
the filter can defer unwinding frames until frame decorators are
executed, after the last filter has executed, it should. See Frame Decorator API, for more information on decorators. Also, there are
examples for both frame decorators and filters in later chapters.
See Writing a Frame Filter, for more information.
The Python dictionary gdb.frame_filters contains key/object
pairings that comprise a frame filter. Frame filters in this
dictionary are called global frame filters, and they are
available when debugging all inferiors. These frame filters must
register with the dictionary directly. In addition to the
global dictionary, there are other dictionaries that are loaded
with different inferiors via auto-loading (see Python Auto-loading). The two other areas where frame filter dictionaries
can be found are: gdb.Progspace which contains a
frame_filters dictionary attribute, and each gdb.Objfile
object which also contains a frame_filters dictionary
attribute.
When a command is executed from GDB that is compatible with
frame filters, GDB combines the global,
gdb.Progspace and all gdb.Objfile dictionaries currently
loaded. All of the gdb.Objfile dictionaries are combined, as
several frames, and thus several object files, might be in use.
GDB then prunes any frame filter whose enabled
attribute is False. This pruned list is then sorted according
to the priority attribute in each filter.
Once the dictionaries are combined, pruned and sorted, GDB
creates an iterator which wraps each frame in the call stack in a
FrameDecorator object, and calls each filter in order. The
output from the previous filter will always be the input to the next
filter, and so on.
Frame filters have a mandatory interface which each frame filter must
implement, defined here:
- Function: FrameFilter.filter (iterator)
-
GDB will call this method on a frame filter when it has
reached the order in the priority list for that filter.For example, if there are four frame filters:
Name Priority Filter1 5 Filter2 10 Filter3 100 Filter4 1
The order that the frame filters will be called is:
Filter3 -> Filter2 -> Filter1 -> Filter4
Note that the output from
Filter3is passed to the input of
Filter2, and so on.This
filtermethod is passed a Python iterator. This iterator
contains a sequence of frame decorators that wrap each
gdb.Frame, or a frame decorator that wraps another frame
decorator. The first filter that is executed in the sequence of frame
filters will receive an iterator entirely comprised of default
FrameDecoratorobjects. However, after each frame filter is
executed, the previous frame filter may have wrapped some or all of
the frame decorators with their own frame decorator. As frame
decorators must also conform to a mandatory interface, these
decorators can be assumed to act in a uniform manner (see Frame Decorator API).This method must return an object conforming to the Python iterator
protocol. Each item in the iterator must be an object conforming to
the frame decorator interface. If a frame filter does not wish to
perform any operations on this iterator, it should return that
iterator untouched.This method is not optional. If it does not exist, GDB will
raise and print an error.
- Variable: FrameFilter.name
-
The
nameattribute must be Python string which contains the
name of the filter displayed by GDB (see Frame Filter Management). This attribute may contain any combination of letters
or numbers. Care should be taken to ensure that it is unique. This
attribute is mandatory.
- Variable: FrameFilter.enabled
-
The
enabledattribute must be Python boolean. This attribute
indicates to GDB whether the frame filter is enabled, and
should be considered when frame filters are executed. If
enabledisTrue, then the frame filter will be executed
when any of the backtrace commands detailed earlier in this chapter
are executed. IfenabledisFalse, then the frame
filter will not be executed. This attribute is mandatory.
- Variable: FrameFilter.priority
-
The
priorityattribute must be Python integer. This attribute
controls the order of execution in relation to other frame filters.
There are no imposed limits on the range ofpriorityother than
it must be a valid integer. The higher thepriorityattribute,
the sooner the frame filter will be executed in relation to other
frame filters. Althoughprioritycan be negative, it is
recommended practice to assume zero is the lowest priority that a
frame filter can be assigned. Frame filters that have the same
priority are executed in unsorted order in that priority slot. This
attribute is mandatory. 100 is a good default priority.
23.3.2.10 Decorating Frames
Frame decorators are sister objects to frame filters (see Frame Filter API). Frame decorators are applied by a frame filter and can
only be used in conjunction with frame filters.
The purpose of a frame decorator is to customize the printed content
of each gdb.Frame in commands where frame filters are executed.
This concept is called decorating a frame. Frame decorators decorate
a gdb.Frame with Python code contained within each API call.
This separates the actual data contained in a gdb.Frame from
the decorated data produced by a frame decorator. This abstraction is
necessary to maintain integrity of the data contained in each
gdb.Frame.
Frame decorators have a mandatory interface, defined below.
GDB already contains a frame decorator called
FrameDecorator. This contains substantial amounts of
boilerplate code to decorate the content of a gdb.Frame. It is
recommended that other frame decorators inherit and extend this
object, and only to override the methods needed.
FrameDecorator is defined in the Python module
gdb.FrameDecorator, so your code can import it like:
from gdb.FrameDecorator import FrameDecorator
- Function: FrameDecorator.elided (self)
-
The
elidedmethod groups frames together in a hierarchical
system. An example would be an interpreter, where multiple low-level
frames make up a single call in the interpreted language. In this
example, the frame filter would elide the low-level frames and present
a single high-level frame, representing the call in the interpreted
language, to the user.The
elidedfunction must return an iterable and this iterable
must contain the frames that are being elided wrapped in a suitable
frame decorator. If no frames are being elided this function may
return an empty iterable, orNone. Elided frames are indented
from normal frames in aCLIbacktrace, or in the case of
GDB/MI, are placed in thechildrenfield of the eliding
frame.It is the frame filter’s task to also filter out the elided frames from
the source iterator. This will avoid printing the frame twice.
- Function: FrameDecorator.function (self)
-
This method returns the name of the function in the frame that is to
be printed.This method must return a Python string describing the function, or
None.If this function returns
None, GDB will not print any
data for this field.
- Function: FrameDecorator.address (self)
-
This method returns the address of the frame that is to be printed.
This method must return a Python numeric integer type of sufficient
size to describe the address of the frame, orNone.If this function returns a
None, GDB will not print
any data for this field.
- Function: FrameDecorator.filename (self)
-
This method returns the filename and path associated with this frame.
This method must return a Python string containing the filename and
the path to the object file backing the frame, orNone.If this function returns a
None, GDB will not print
any data for this field.
- Function: FrameDecorator.line (self):
-
This method returns the line number associated with the current
position within the function addressed by this frame.This method must return a Python integer type, or
None.If this function returns a
None, GDB will not print
any data for this field.
- Function: FrameDecorator.frame_args (self)
-
This method must return an iterable, or
None. Returning an
empty iterable, orNonemeans frame arguments will not be
printed for this frame. This iterable must contain objects that
implement two methods, described here.This object must implement a
symbolmethod which takes a
singleselfparameter and must return agdb.Symbol
(see Symbols In Python), or a Python string. The object must also
implement avaluemethod which takes a singleself
parameter and must return agdb.Value(see Values From Inferior), a Python value, orNone. If thevalue
method returnsNone, and theargumentmethod returns a
gdb.Symbol, GDB will look-up and print the value of
thegdb.Symbolautomatically.A brief example:
class SymValueWrapper(): def __init__(self, symbol, value): self.sym = symbol self.val = value def value(self): return self.val def symbol(self): return self.sym class SomeFrameDecorator() ... ... def frame_args(self): args = [] try: block = self.inferior_frame.block() except: return None # Iterate over all symbols in a block. Only add # symbols that are arguments. for sym in block: if not sym.is_argument: continue args.append(SymValueWrapper(sym,None)) # Add example synthetic argument. args.append(SymValueWrapper(``foo'', 42)) return args
- Function: FrameDecorator.frame_locals (self)
-
This method must return an iterable or
None. Returning an
empty iterable, orNonemeans frame local arguments will not be
printed for this frame.The object interface, the description of the various strategies for
reading frame locals, and the example are largely similar to those
described in theframe_argsfunction, (see The
frame filter frame_args function). Below is a modified example:class SomeFrameDecorator() ... ... def frame_locals(self): vars = [] try: block = self.inferior_frame.block() except: return None # Iterate over all symbols in a block. Add all # symbols, except arguments. for sym in block: if sym.is_argument: continue vars.append(SymValueWrapper(sym,None)) # Add an example of a synthetic local variable. vars.append(SymValueWrapper(``bar'', 99)) return vars
- Function: FrameDecorator.inferior_frame (self):
-
This method must return the underlying
gdb.Framethat this
frame decorator is decorating. GDB requires the underlying
frame for internal frame information to determine how to print certain
values when printing a frame.
23.3.2.11 Writing a Frame Filter
There are three basic elements that a frame filter must implement: it
must correctly implement the documented interface (see Frame Filter API), it must register itself with GDB, and finally, it must
decide if it is to work on the data provided by GDB. In all
cases, whether it works on the iterator or not, each frame filter must
return an iterator. A bare-bones frame filter follows the pattern in
the following example.
import gdb
class FrameFilter():
def __init__(self):
# Frame filter attribute creation.
#
# 'name' is the name of the filter that GDB will display.
#
# 'priority' is the priority of the filter relative to other
# filters.
#
# 'enabled' is a boolean that indicates whether this filter is
# enabled and should be executed.
self.name = "Foo"
self.priority = 100
self.enabled = True
# Register this frame filter with the global frame_filters
# dictionary.
gdb.frame_filters[self.name] = self
def filter(self, frame_iter):
# Just return the iterator.
return frame_iter
The frame filter in the example above implements the three
requirements for all frame filters. It implements the API, self
registers, and makes a decision on the iterator (in this case, it just
returns the iterator untouched).
The first step is attribute creation and assignment, and as shown in
the comments the filter assigns the following attributes: name,
priority and whether the filter should be enabled with the
enabled attribute.
The second step is registering the frame filter with the dictionary or
dictionaries that the frame filter has interest in. As shown in the
comments, this filter just registers itself with the global dictionary
gdb.frame_filters. As noted earlier, gdb.frame_filters
is a dictionary that is initialized in the gdb module when
GDB starts. What dictionary a filter registers with is an
important consideration. Generally, if a filter is specific to a set
of code, it should be registered either in the objfile or
progspace dictionaries as they are specific to the program
currently loaded in GDB. The global dictionary is always
present in GDB and is never unloaded. Any filters registered
with the global dictionary will exist until GDB exits. To
avoid filters that may conflict, it is generally better to register
frame filters against the dictionaries that more closely align with
the usage of the filter currently in question. See Python Auto-loading, for further information on auto-loading Python scripts.
GDB takes a hands-off approach to frame filter registration,
therefore it is the frame filter’s responsibility to ensure
registration has occurred, and that any exceptions are handled
appropriately. In particular, you may wish to handle exceptions
relating to Python dictionary key uniqueness. It is mandatory that
the dictionary key is the same as frame filter’s name
attribute. When a user manages frame filters (see Frame Filter Management), the names GDB will display are those contained
in the name attribute.
The final step of this example is the implementation of the
filter method. As shown in the example comments, we define the
filter method and note that the method must take an iterator,
and also must return an iterator. In this bare-bones example, the
frame filter is not very useful as it just returns the iterator
untouched. However this is a valid operation for frame filters that
have the enabled attribute set, but decide not to operate on
any frames.
In the next example, the frame filter operates on all frames and
utilizes a frame decorator to perform some work on the frames.
See Frame Decorator API, for further information on the frame
decorator interface.
This example works on inlined frames. It highlights frames which are
inlined by tagging them with an “[inlined]” tag. By applying a
frame decorator to all frames with the Python itertools imap
method, the example defers actions to the frame decorator. Frame
decorators are only processed when GDB prints the backtrace.
This introduces a new decision making topic: whether to perform
decision making operations at the filtering step, or at the printing
step. In this example’s approach, it does not perform any filtering
decisions at the filtering step beyond mapping a frame decorator to
each frame. This allows the actual decision making to be performed
when each frame is printed. This is an important consideration, and
well worth reflecting upon when designing a frame filter. An issue
that frame filters should avoid is unwinding the stack if possible.
Some stacks can run very deep, into the tens of thousands in some
cases. To search every frame to determine if it is inlined ahead of
time may be too expensive at the filtering step. The frame filter
cannot know how many frames it has to iterate over, and it would have
to iterate through them all. This ends up duplicating effort as
GDB performs this iteration when it prints the frames.
In this example decision making can be deferred to the printing step.
As each frame is printed, the frame decorator can examine each frame
in turn when GDB iterates. From a performance viewpoint,
this is the most appropriate decision to make as it avoids duplicating
the effort that the printing step would undertake anyway. Also, if
there are many frame filters unwinding the stack during filtering, it
can substantially delay the printing of the backtrace which will
result in large memory usage, and a poor user experience.
class InlineFilter():
def __init__(self):
self.name = "InlinedFrameFilter"
self.priority = 100
self.enabled = True
gdb.frame_filters[self.name] = self
def filter(self, frame_iter):
frame_iter = itertools.imap(InlinedFrameDecorator,
frame_iter)
return frame_iter
This frame filter is somewhat similar to the earlier example, except
that the filter method applies a frame decorator object called
InlinedFrameDecorator to each element in the iterator. The
imap Python method is light-weight. It does not proactively
iterate over the iterator, but rather creates a new iterator which
wraps the existing one.
Below is the frame decorator for this example.
class InlinedFrameDecorator(FrameDecorator):
def __init__(self, fobj):
super(InlinedFrameDecorator, self).__init__(fobj)
def function(self):
frame = self.inferior_frame()
name = str(frame.name())
if frame.type() == gdb.INLINE_FRAME:
name = name + " [inlined]"
return name
This frame decorator only defines and overrides the function
method. It lets the supplied FrameDecorator, which is shipped
with GDB, perform the other work associated with printing
this frame.
The combination of these two objects create this output from a
backtrace:
#0 0x004004e0 in bar () at inline.c:11 #1 0x00400566 in max [inlined] (b=6, a=12) at inline.c:21 #2 0x00400566 in main () at inline.c:31
So in the case of this example, a frame decorator is applied to all
frames, regardless of whether they may be inlined or not. As
GDB iterates over the iterator produced by the frame filters,
GDB executes each frame decorator which then makes a decision
on what to print in the function callback. Using a strategy
like this is a way to defer decisions on the frame content to printing
time.
Eliding Frames
It might be that the above example is not desirable for representing
inlined frames, and a hierarchical approach may be preferred. If we
want to hierarchically represent frames, the elided frame
decorator interface might be preferable.
This example approaches the issue with the elided method. This
example is quite long, but very simplistic. It is out-of-scope for
this section to write a complete example that comprehensively covers
all approaches of finding and printing inlined frames. However, this
example illustrates the approach an author might use.
This example comprises of three sections.
class InlineFrameFilter():
def __init__(self):
self.name = "InlinedFrameFilter"
self.priority = 100
self.enabled = True
gdb.frame_filters[self.name] = self
def filter(self, frame_iter):
return ElidingInlineIterator(frame_iter)
This frame filter is very similar to the other examples. The only
difference is this frame filter is wrapping the iterator provided to
it (frame_iter) with a custom iterator called
ElidingInlineIterator. This again defers actions to when
GDB prints the backtrace, as the iterator is not traversed
until printing.
The iterator for this example is as follows. It is in this section of
the example where decisions are made on the content of the backtrace.
class ElidingInlineIterator:
def __init__(self, ii):
self.input_iterator = ii
def __iter__(self):
return self
def next(self):
frame = next(self.input_iterator)
if frame.inferior_frame().type() != gdb.INLINE_FRAME:
return frame
try:
eliding_frame = next(self.input_iterator)
except StopIteration:
return frame
return ElidingFrameDecorator(eliding_frame, [frame])
This iterator implements the Python iterator protocol. When the
next function is called (when GDB prints each frame),
the iterator checks if this frame decorator, frame, is wrapping
an inlined frame. If it is not, it returns the existing frame decorator
untouched. If it is wrapping an inlined frame, it assumes that the
inlined frame was contained within the next oldest frame,
eliding_frame, which it fetches. It then creates and returns a
frame decorator, ElidingFrameDecorator, which contains both the
elided frame, and the eliding frame.
class ElidingInlineDecorator(FrameDecorator):
def __init__(self, frame, elided_frames):
super(ElidingInlineDecorator, self).__init__(frame)
self.frame = frame
self.elided_frames = elided_frames
def elided(self):
return iter(self.elided_frames)
This frame decorator overrides one function and returns the inlined
frame in the elided method. As before it lets
FrameDecorator do the rest of the work involved in printing
this frame. This produces the following output.
#0 0x004004e0 in bar () at inline.c:11
#2 0x00400529 in main () at inline.c:25
#1 0x00400529 in max (b=6, a=12) at inline.c:15
In that output, max which has been inlined into main is
printed hierarchically. Another approach would be to combine the
function method, and the elided method to both print a
marker in the inlined frame, and also show the hierarchical
relationship.
23.3.2.12 Unwinding Frames in Python
In GDB terminology “unwinding” is the process of finding
the previous frame (that is, caller’s) from the current one. An
unwinder has three methods. The first one checks if it can handle
given frame (“sniff” it). For the frames it can sniff an unwinder
provides two additional methods: it can return frame’s ID, and it can
fetch registers from the previous frame. A running GDB
mantains a list of the unwinders and calls each unwinder’s sniffer in
turn until it finds the one that recognizes the current frame. There
is an API to register an unwinder.
The unwinders that come with GDB handle standard frames.
However, mixed language applications (for example, an application
running Java Virtual Machine) sometimes use frame layouts that cannot
be handled by the GDB unwinders. You can write Python code
that can handle such custom frames.
You implement a frame unwinder in Python as a class with which has two
attributes, name and enabled, with obvious meanings, and
a single method __call__, which examines a given frame and
returns an object (an instance of gdb.UnwindInfo class)
describing it. If an unwinder does not recognize a frame, it should
return None. The code in GDB that enables writing
unwinders in Python uses this object to return frame’s ID and previous
frame registers when GDB core asks for them.
An unwinder should do as little work as possible. Some otherwise
innocuous operations can cause problems (even crashes, as this code is
not not well-hardened yet). For example, making an inferior call from
an unwinder is unadvisable, as an inferior call will reset
GDB’s stack unwinding process, potentially causing re-entrant
unwinding.
Unwinder Input
An object passed to an unwinder (a gdb.PendingFrame instance)
provides a method to read frame’s registers:
- Function: PendingFrame.read_register (reg)
-
This method returns the contents of the register reg in the
frame as agdb.Valueobject. For a description of the
acceptable values of reg see
Frame.read_register. If reg
does not name a register for the current architecture, this method
will throw an exception.Note that this method will always return a
gdb.Valuefor a
valid register name. This does not mean that the value will be valid.
For example, you may request a register that an earlier unwinder could
not unwind—the value will be unavailable. Instead, the
gdb.Valuereturned from this method will be lazy; that is, its
underlying bits will not be fetched until it is first used. So,
attempting to use such a value will cause an exception at the point of
use.The type of the returned
gdb.Valuedepends on the register and
the architecture. It is common for registers to have a scalar type,
likelong long; but many other types are possible, such as
pointer, pointer-to-function, floating point or vector types.
It also provides a factory method to create a gdb.UnwindInfo
instance to be returned to GDB:
- Function: PendingFrame.create_unwind_info (frame_id)
-
Returns a new
gdb.UnwindInfoinstance identified by given
frame_id. The argument is used to build GDB’s frame ID
using one of functions provided by GDB. frame_id’s attributes
determine which function will be used, as follows:sp, pc-
The frame is identified by the given stack address and PC. The stack
address must be chosen so that it is constant throughout the lifetime
of the frame, so a typical choice is the value of the stack pointer at
the start of the function—in the DWARF standard, this would be the
“Call Frame Address”.This is the most common case by far. The other cases are documented
for completeness but are only useful in specialized situations. sp, pc, special-
The frame is identified by the stack address, the PC, and a
“special” address. The special address is used on architectures
that can have frames that do not change the stack, but which are still
distinct, for example the IA-64, which has a second stack for
registers. Both sp and special must be constant
throughout the lifetime of the frame. sp-
The frame is identified by the stack address only. Any other stack
frame with a matching sp will be considered to match this frame.
Inside gdb, this is called a “wild frame”. You will never need
this.
Each attribute value should be an instance of
gdb.Value.
- Function: PendingFrame.architecture ()
-
Return the
gdb.Architecture(see Architectures In Python)
for thisgdb.PendingFrame. This represents the architecture of
the particular frame being unwound.
- Function: PendingFrame.level ()
-
Return an integer, the stack frame level for this frame.
See Stack Frames.
Unwinder Output: UnwindInfo
Use PendingFrame.create_unwind_info method described above to
create a gdb.UnwindInfo instance. Use the following method to
specify caller registers that have been saved in this frame:
- Function: gdb.UnwindInfo.add_saved_register (reg, value)
-
reg identifies the register, for a description of the acceptable
values see Frame.read_register.
value is a register value (agdb.Valueobject).
Unwinder Skeleton Code
GDB comes with the module containing the base Unwinder
class. Derive your unwinder class from it and structure the code as
follows:
from gdb.unwinders import Unwinder
class FrameId(object):
def __init__(self, sp, pc):
self.sp = sp
self.pc = pc
class MyUnwinder(Unwinder):
def __init__(....):
super(MyUnwinder, self).__init___(<expects unwinder name argument>)
def __call__(pending_frame):
if not <we recognize frame>:
return None
# Create UnwindInfo. Usually the frame is identified by the stack
# pointer and the program counter.
sp = pending_frame.read_register(<SP number>)
pc = pending_frame.read_register(<PC number>)
unwind_info = pending_frame.create_unwind_info(FrameId(sp, pc))
# Find the values of the registers in the caller's frame and
# save them in the result:
unwind_info.add_saved_register(<register>, <value>)
....
# Return the result:
return unwind_info
Registering an Unwinder
Object files and program spaces can have unwinders registered with
them. In addition, you can also register unwinders globally.
The gdb.unwinders module provides the function to register an
unwinder:
- Function: gdb.unwinder.register_unwinder (locus, unwinder, replace=False)
-
locus specifies to which unwinder list to prepend the
unwinder. It can be either an object file, a program space, or
None, in which case the unwinder is registered globally. The
newly added unwinder will be called before any other unwinder from the
same locus. Two unwinders in the same locus cannot have the same
name. An attempt to add an unwinder with an already existing name raises
an exception unless replace isTrue, in which case the
old unwinder is deleted.
Unwinder Precedence
GDB first calls the unwinders from all the object files in no
particular order, then the unwinders from the current program space,
and finally the unwinders from GDB.
23.3.2.13 Xmethods In Python
Xmethods are additional methods or replacements for existing
methods of a C++ class. This feature is useful for those cases
where a method defined in C++ source code could be inlined or
optimized out by the compiler, making it unavailable to GDB.
For such cases, one can define an xmethod to serve as a replacement
for the method defined in the C++ source code. GDB will
then invoke the xmethod, instead of the C++ method, to
evaluate expressions. One can also use xmethods when debugging
with core files. Moreover, when debugging live programs, invoking an
xmethod need not involve running the inferior (which can potentially
perturb its state). Hence, even if the C++ method is available, it
is better to use its replacement xmethod if one is defined.
The xmethods feature in Python is available via the concepts of an
xmethod matcher and an xmethod worker. To
implement an xmethod, one has to implement a matcher and a
corresponding worker for it (more than one worker can be
implemented, each catering to a different overloaded instance of the
method). Internally, GDB invokes the match method of a
matcher to match the class type and method name. On a match, the
match method returns a list of matching worker objects.
Each worker object typically corresponds to an overloaded instance of
the xmethod. They implement a get_arg_types method which
returns a sequence of types corresponding to the arguments the xmethod
requires. GDB uses this sequence of types to perform
overload resolution and picks a winning xmethod worker. A winner
is also selected from among the methods GDB finds in the
C++ source code. Next, the winning xmethod worker and the
winning C++ method are compared to select an overall winner. In
case of a tie between a xmethod worker and a C++ method, the
xmethod worker is selected as the winner. That is, if a winning
xmethod worker is found to be equivalent to the winning C++
method, then the xmethod worker is treated as a replacement for
the C++ method. GDB uses the overall winner to invoke the
method. If the winning xmethod worker is the overall winner, then
the corresponding xmethod is invoked via the __call__ method
of the worker object.
If one wants to implement an xmethod as a replacement for an
existing C++ method, then they have to implement an equivalent
xmethod which has exactly the same name and takes arguments of
exactly the same type as the C++ method. If the user wants to
invoke the C++ method even though a replacement xmethod is
available for that method, then they can disable the xmethod.
See Xmethod API, for API to implement xmethods in Python.
See Writing an Xmethod, for implementing xmethods in Python.
23.3.2.14 Xmethod API
The GDB Python API provides classes, interfaces and functions
to implement, register and manipulate xmethods.
See Xmethods In Python.
An xmethod matcher should be an instance of a class derived from
XMethodMatcher defined in the module gdb.xmethod, or an
object with similar interface and attributes. An instance of
XMethodMatcher has the following attributes:
- Variable: name
-
The name of the matcher.
- Variable: enabled
-
A boolean value indicating whether the matcher is enabled or disabled.
- Variable: methods
-
A list of named methods managed by the matcher. Each object in the list
is an instance of the classXMethoddefined in the module
gdb.xmethod, or any object with the following attributes:name-
Name of the xmethod which should be unique for each xmethod
managed by the matcher. enabled-
A boolean value indicating whether the xmethod is enabled or
disabled.
The class
XMethodis a convenience class with same
attributes as above along with the following constructor:- Function: XMethod.__init__ (self, name)
-
Constructs an enabled xmethod with name name.
The XMethodMatcher class has the following methods:
- Function: XMethodMatcher.__init__ (self, name)
-
Constructs an enabled xmethod matcher with name name. The
methodsattribute is initialized toNone.
- Function: XMethodMatcher.match (self, class_type, method_name)
-
Derived classes should override this method. It should return a
xmethod worker object (or a sequence of xmethod worker
objects) matching the class_type and method_name.
class_type is agdb.Typeobject, and method_name
is a string value. If the matcher manages named methods as listed in
itsmethodsattribute, then only those worker objects whose
corresponding entries in themethodslist are enabled should be
returned.
An xmethod worker should be an instance of a class derived from
XMethodWorker defined in the module gdb.xmethod,
or support the following interface:
- Function: XMethodWorker.get_arg_types (self)
-
This method returns a sequence of
gdb.Typeobjects corresponding
to the arguments that the xmethod takes. It can return an empty
sequence orNoneif the xmethod does not take any arguments.
If the xmethod takes a single argument, then a single
gdb.Typeobject corresponding to it can be returned.
- Function: XMethodWorker.get_result_type (self, *args)
-
This method returns a
gdb.Typeobject representing the type
of the result of invoking this xmethod.
The args argument is the same tuple of arguments that would be
passed to the__call__method of this worker.
- Function: XMethodWorker.__call__ (self, *args)
-
This is the method which does the work of the xmethod. The
args arguments is the tuple of arguments to the xmethod. Each
element in this tuple is a gdb.Value object. The first element is
always thethispointer value.
For GDB to lookup xmethods, the xmethod matchers
should be registered using the following function defined in the module
gdb.xmethod:
- Function: register_xmethod_matcher (locus, matcher, replace=False)
-
The
matcheris registered withlocus, replacing an
existing matcher with the same name asmatcherif
replaceisTrue.locuscan be a
gdb.Objfileobject (see Objfiles In Python), or a
gdb.Progspaceobject (see Progspaces In Python), or
None. If it isNone, thenmatcheris registered
globally.
23.3.2.15 Writing an Xmethod
Implementing xmethods in Python will require implementing xmethod
matchers and xmethod workers (see Xmethods In Python). Consider
the following C++ class:
class MyClass
{
public:
MyClass (int a) : a_(a) { }
int geta (void) { return a_; }
int operator+ (int b);
private:
int a_;
};
int
MyClass::operator+ (int b)
{
return a_ + b;
}
Let us define two xmethods for the class MyClass, one
replacing the method geta, and another adding an overloaded
flavor of operator+ which takes a MyClass argument (the
C++ code above already has an overloaded operator+
which takes an int argument). The xmethod matcher can be
defined as follows:
class MyClass_geta(gdb.xmethod.XMethod):
def __init__(self):
gdb.xmethod.XMethod.__init__(self, 'geta')
def get_worker(self, method_name):
if method_name == 'geta':
return MyClassWorker_geta()
class MyClass_sum(gdb.xmethod.XMethod):
def __init__(self):
gdb.xmethod.XMethod.__init__(self, 'sum')
def get_worker(self, method_name):
if method_name == 'operator+':
return MyClassWorker_plus()
class MyClassMatcher(gdb.xmethod.XMethodMatcher):
def __init__(self):
gdb.xmethod.XMethodMatcher.__init__(self, 'MyClassMatcher')
# List of methods 'managed' by this matcher
self.methods = [MyClass_geta(), MyClass_sum()]
def match(self, class_type, method_name):
if class_type.tag != 'MyClass':
return None
workers = []
for method in self.methods:
if method.enabled:
worker = method.get_worker(method_name)
if worker:
workers.append(worker)
return workers
Notice that the match method of MyClassMatcher returns
a worker object of type MyClassWorker_geta for the geta
method, and a worker object of type MyClassWorker_plus for the
operator+ method. This is done indirectly via helper classes
derived from gdb.xmethod.XMethod. One does not need to use the
methods attribute in a matcher as it is optional. However, if a
matcher manages more than one xmethod, it is a good practice to list the
xmethods in the methods attribute of the matcher. This will then
facilitate enabling and disabling individual xmethods via the
enable/disable commands. Notice also that a worker object is
returned only if the corresponding entry in the methods attribute
of the matcher is enabled.
The implementation of the worker classes returned by the matcher setup
above is as follows:
class MyClassWorker_geta(gdb.xmethod.XMethodWorker):
def get_arg_types(self):
return None
def get_result_type(self, obj):
return gdb.lookup_type('int')
def __call__(self, obj):
return obj['a_']
class MyClassWorker_plus(gdb.xmethod.XMethodWorker):
def get_arg_types(self):
return gdb.lookup_type('MyClass')
def get_result_type(self, obj):
return gdb.lookup_type('int')
def __call__(self, obj, other):
return obj['a_'] + other['a_']
For GDB to actually lookup a xmethod, it has to be
registered with it. The matcher defined above is registered with
GDB globally as follows:
gdb.xmethod.register_xmethod_matcher(None, MyClassMatcher())
If an object obj of type MyClass is initialized in C++
code as follows:
then, after loading the Python script defining the xmethod matchers
and workers into GDBN, invoking the method geta or using
the operator + on obj will invoke the xmethods
defined above:
(gdb) p obj.geta() $1 = 5 (gdb) p obj + obj $2 = 10
Consider another example with a C++ template class:
template <class T>
class MyTemplate
{
public:
MyTemplate () : dsize_(10), data_ (new T [10]) { }
~MyTemplate () { delete [] data_; }
int footprint (void)
{
return sizeof (T) * dsize_ + sizeof (MyTemplate<T>);
}
private:
int dsize_;
T *data_;
};
Let us implement an xmethod for the above class which serves as a
replacement for the footprint method. The full code listing
of the xmethod workers and xmethod matchers is as follows:
class MyTemplateWorker_footprint(gdb.xmethod.XMethodWorker):
def __init__(self, class_type):
self.class_type = class_type
def get_arg_types(self):
return None
def get_result_type(self):
return gdb.lookup_type('int')
def __call__(self, obj):
return (self.class_type.sizeof +
obj['dsize_'] *
self.class_type.template_argument(0).sizeof)
class MyTemplateMatcher_footprint(gdb.xmethod.XMethodMatcher):
def __init__(self):
gdb.xmethod.XMethodMatcher.__init__(self, 'MyTemplateMatcher')
def match(self, class_type, method_name):
if (re.match('MyTemplate<[ tn]*[_a-zA-Z][ _a-zA-Z0-9]*>',
class_type.tag) and
method_name == 'footprint'):
return MyTemplateWorker_footprint(class_type)
Notice that, in this example, we have not used the methods
attribute of the matcher as the matcher manages only one xmethod. The
user can enable/disable this xmethod by enabling/disabling the matcher
itself.
23.3.2.16 Inferiors In Python
Programs which are being run under GDB are called inferiors
(see Inferiors Connections and Programs). Python scripts can access
information about and manipulate inferiors controlled by GDB
via objects of the gdb.Inferior class.
The following inferior-related functions are available in the gdb
module:
- Function: gdb.inferiors ()
-
Return a tuple containing all inferior objects.
- Function: gdb.selected_inferior ()
-
Return an object representing the current inferior.
A gdb.Inferior object has the following attributes:
- Variable: Inferior.num
-
ID of inferior, as assigned by GDB.
- Variable: Inferior.connection
-
The
gdb.TargetConnectionfor this inferior (see Connections In Python), orNoneif this inferior has no connection.
- Variable: Inferior.connection_num
-
ID of inferior’s connection as assigned by GDB, or None if
the inferior is not connected to a target. See Inferiors Connections and Programs. This is equivalent to
gdb.Inferior.connection.numin the case where
gdb.Inferior.connectionis notNone.
- Variable: Inferior.pid
-
Process ID of the inferior, as assigned by the underlying operating
system.
- Variable: Inferior.was_attached
-
Boolean signaling whether the inferior was created using ‘attach’, or
started by GDB itself.
- Variable: Inferior.progspace
-
The inferior’s program space. See Progspaces In Python.
A gdb.Inferior object has the following methods:
- Function: Inferior.is_valid ()
-
Returns
Trueif thegdb.Inferiorobject is valid,
Falseif not. Agdb.Inferiorobject will become invalid
if the inferior no longer exists within GDB. All other
gdb.Inferiormethods will throw an exception if it is invalid
at the time the method is called.
- Function: Inferior.threads ()
-
This method returns a tuple holding all the threads which are valid
when it is called. If there are no valid threads, the method will
return an empty tuple.
- Function: Inferior.architecture ()
-
Return the
gdb.Architecture(see Architectures In Python)
for this inferior. This represents the architecture of the inferior
as a whole. Some platforms can have multiple architectures in a
single address space, so this may not match the architecture of a
particular frame (see Frames In Python).
- Function: Inferior.read_memory (address, length)
-
Read length addressable memory units from the inferior, starting at
address. Returns a buffer object, which behaves much like an array
or a string. It can be modified and given to the
Inferior.write_memoryfunction. In Python 3, the return
value is amemoryviewobject.
- Function: Inferior.write_memory (address, buffer [, length])
-
Write the contents of buffer to the inferior, starting at
address. The buffer parameter must be a Python object
which supports the buffer protocol, i.e., a string, an array or the
object returned fromInferior.read_memory. If given, length
determines the number of addressable memory units from buffer to be
written.
- Function: Inferior.search_memory (address, length, pattern)
-
Search a region of the inferior memory starting at address with
the given length using the search pattern supplied in
pattern. The pattern parameter must be a Python object
which supports the buffer protocol, i.e., a string, an array or the
object returned fromgdb.read_memory. Returns a PythonLong
containing the address where the pattern was found, orNoneif
the pattern could not be found.
- Function: Inferior.thread_from_handle (handle)
-
Return the thread object corresponding to handle, a thread
library specific data structure such aspthread_tfor pthreads
library implementations.The function
Inferior.thread_from_thread_handleprovides
the same functionality, but use ofInferior.thread_from_thread_handle
is deprecated.
23.3.2.17 Events In Python
GDB provides a general event facility so that Python code can be
notified of various state changes, particularly changes that occur in
the inferior.
An event is just an object that describes some state change. The
type of the object and its attributes will vary depending on the details
of the change. All the existing events are described below.
In order to be notified of an event, you must register an event handler
with an event registry. An event registry is an object in the
gdb.events module which dispatches particular events. A registry
provides methods to register and unregister event handlers:
- Function: EventRegistry.connect (object)
-
Add the given callable object to the registry. This object will be
called when an event corresponding to this registry occurs.
- Function: EventRegistry.disconnect (object)
-
Remove the given object from the registry. Once removed, the object
will no longer receive notifications of events.
Here is an example:
def exit_handler (event):
print ("event type: exit")
if hasattr (event, 'exit_code'):
print ("exit code: %d" % (event.exit_code))
else:
print ("exit code not available")
gdb.events.exited.connect (exit_handler)
In the above example we connect our handler exit_handler to the
registry events.exited. Once connected, exit_handler gets
called when the inferior exits. The argument event in this example is
of type gdb.ExitedEvent. As you can see in the example the
ExitedEvent object has an attribute which indicates the exit code of
the inferior.
Some events can be thread specific when GDB is running in
non-stop mode. When represented in Python, these events all extend
gdb.ThreadEvent. This event is a base class and is never
emitted directly; instead, events which are emitted by this or other
modules might extend this event. Examples of these events are
gdb.BreakpointEvent and gdb.ContinueEvent.
gdb.ThreadEvent holds the following attributes:
- Variable: ThreadEvent.inferior_thread
-
In non-stop mode this attribute will be set to the specific thread which was
involved in the emitted event. Otherwise, it will be set toNone.
The following is a listing of the event registries that are available and
details of the events they emit:
events.cont-
Emits
gdb.ContinueEvent, which extendsgdb.ThreadEvent.
This event indicates that the inferior has been continued after a
stop. For inherited attribute refer togdb.ThreadEventabove. events.exited-
Emits
events.ExitedEvent, which indicates that the inferior has
exited.events.ExitedEventhas two attributes:- Variable: ExitedEvent.exit_code
-
An integer representing the exit code, if available, which the inferior
has returned. (The exit code could be unavailable if, for example,
GDB detaches from the inferior.) If the exit code is unavailable,
the attribute does not exist.
- Variable: ExitedEvent.inferior
-
A reference to the inferior which triggered the
exitedevent.
events.stop-
Emits
gdb.StopEvent, which extendsgdb.ThreadEvent.Indicates that the inferior has stopped. All events emitted by this
registry extendgdb.StopEvent. As a child of
gdb.ThreadEvent,gdb.StopEventwill indicate the stopped
thread when GDB is running in non-stop mode. Refer to
gdb.ThreadEventabove for more details.Emits
gdb.SignalEvent, which extendsgdb.StopEvent.This event indicates that the inferior or one of its threads has
received a signal.gdb.SignalEventhas the following
attributes:- Variable: SignalEvent.stop_signal
-
A string representing the signal received by the inferior. A list of possible
signal values can be obtained by running the commandinfo signalsin
the GDB command prompt.
Also emits
gdb.BreakpointEvent, which extends
gdb.StopEvent.gdb.BreakpointEventevent indicates that one or more breakpoints have
been hit, and has the following attributes:- Variable: BreakpointEvent.breakpoints
-
A sequence containing references to all the breakpoints (type
gdb.Breakpoint) that were hit.
See Breakpoints In Python, for details of thegdb.Breakpointobject.
- Variable: BreakpointEvent.breakpoint
-
A reference to the first breakpoint that was hit. This attribute is
maintained for backward compatibility and is now deprecated in favor
of thegdb.BreakpointEvent.breakpointsattribute.
events.new_objfile-
Emits
gdb.NewObjFileEventwhich indicates that a new object file has
been loaded by GDB.gdb.NewObjFileEventhas one attribute:- Variable: NewObjFileEvent.new_objfile
-
A reference to the object file (
gdb.Objfile) which has been loaded.
See Objfiles In Python, for details of thegdb.Objfileobject.
events.free_objfile-
Emits
gdb.FreeObjFileEventwhich indicates that an object file
is about to be removed from GDB. One reason this can happen
is when the inferior callsdlclose.
gdb.FreeObjFileEventhas one attribute:- Variable: NewObjFileEvent.objfile
-
A reference to the object file (
gdb.Objfile) which will be unloaded.
See Objfiles In Python, for details of thegdb.Objfileobject.
events.clear_objfiles-
Emits
gdb.ClearObjFilesEventwhich indicates that the list of object
files for a program space has been reset.
gdb.ClearObjFilesEventhas one attribute:- Variable: ClearObjFilesEvent.progspace
-
A reference to the program space (
gdb.Progspace) whose objfile list has
been cleared. See Progspaces In Python.
events.inferior_call-
Emits events just before and after a function in the inferior is
called by GDB. Before an inferior call, this emits an event
of typegdb.InferiorCallPreEvent, and after an inferior call,
this emits an event of typegdb.InferiorCallPostEvent.gdb.InferiorCallPreEvent-
Indicates that a function in the inferior is about to be called.
- Variable: InferiorCallPreEvent.ptid
-
The thread in which the call will be run.
- Variable: InferiorCallPreEvent.address
-
The location of the function to be called.
gdb.InferiorCallPostEvent-
Indicates that a function in the inferior has just been called.
- Variable: InferiorCallPostEvent.ptid
-
The thread in which the call was run.
- Variable: InferiorCallPostEvent.address
-
The location of the function that was called.
events.memory_changed-
Emits
gdb.MemoryChangedEventwhich indicates that the memory of the
inferior has been modified by the GDB user, for instance via a
command likeset *addr = value. The event has the following
attributes:- Variable: MemoryChangedEvent.address
-
The start address of the changed region.
- Variable: MemoryChangedEvent.length
-
Length in bytes of the changed region.
events.register_changed-
Emits
gdb.RegisterChangedEventwhich indicates that a register in the
inferior has been modified by the GDB user.- Variable: RegisterChangedEvent.frame
-
A gdb.Frame object representing the frame in which the register was modified.
- Variable: RegisterChangedEvent.regnum
-
Denotes which register was modified.
events.breakpoint_created-
This is emitted when a new breakpoint has been created. The argument
that is passed is the newgdb.Breakpointobject. events.breakpoint_modified-
This is emitted when a breakpoint has been modified in some way. The
argument that is passed is the newgdb.Breakpointobject. events.breakpoint_deleted-
This is emitted when a breakpoint has been deleted. The argument that
is passed is thegdb.Breakpointobject. When this event is
emitted, thegdb.Breakpointobject will already be in its
invalid state; that is, theis_validmethod will return
False. events.before_prompt-
This event carries no payload. It is emitted each time GDB
presents a prompt to the user. events.new_inferior-
This is emitted when a new inferior is created. Note that the
inferior is not necessarily running; in fact, it may not even have an
associated executable.The event is of type
gdb.NewInferiorEvent. This has a single
attribute:- Variable: NewInferiorEvent.inferior
-
The new inferior, a
gdb.Inferiorobject.
events.inferior_deleted-
This is emitted when an inferior has been deleted. Note that this is
not the same as process exit; it is notified when the inferior itself
is removed, say viaremove-inferiors.The event is of type
gdb.InferiorDeletedEvent. This has a single
attribute:- Variable: InferiorDeletedEvent.inferior
-
The inferior that is being removed, a
gdb.Inferiorobject.
events.new_thread-
This is emitted when GDB notices a new thread. The event is of
typegdb.NewThreadEvent, which extendsgdb.ThreadEvent.
This has a single attribute:- Variable: NewThreadEvent.inferior_thread
-
The new thread.
events.gdb_exiting-
This is emitted when GDB exits. This event is not emitted if
GDB exits as a result of an internal error, or after an
unexpected signal. The event is of typegdb.GdbExitingEvent,
which has a single attribute:- Variable: GdbExitingEvent.exit_code
-
An integer, the value of the exit code GDB will return.
events.connection_removed-
This is emitted when GDB removes a connection
(see Connections In Python). The event is of type
gdb.ConnectionEvent. This has a single read-only attribute:- Variable: ConnectionEvent.connection
-
The
gdb.TargetConnectionthat is being removed.
23.3.2.18 Threads In Python
Python scripts can access information about, and manipulate inferior threads
controlled by GDB, via objects of the gdb.InferiorThread class.
The following thread-related functions are available in the gdb
module:
- Function: gdb.selected_thread ()
-
This function returns the thread object for the selected thread. If there
is no selected thread, this will returnNone.
To get the list of threads for an inferior, use the Inferior.threads()
method. See Inferiors In Python.
A gdb.InferiorThread object has the following attributes:
- Variable: InferiorThread.name
-
The name of the thread. If the user specified a name using
thread name, then this returns that name. Otherwise, if an
OS-supplied name is available, then it is returned. Otherwise, this
returnsNone.This attribute can be assigned to. The new value must be a string
object, which sets the new name, orNone, which removes any
user-specified thread name.
- Variable: InferiorThread.num
-
The per-inferior number of the thread, as assigned by GDB.
- Variable: InferiorThread.global_num
-
The global ID of the thread, as assigned by GDB. You can use this to
make Python breakpoints thread-specific, for example
(see The Breakpoint.thread attribute).
- Variable: InferiorThread.ptid
-
ID of the thread, as assigned by the operating system. This attribute is a
tuple containing three integers. The first is the Process ID (PID); the second
is the Lightweight Process ID (LWPID), and the third is the Thread ID (TID).
Either the LWPID or TID may be 0, which indicates that the operating system
does not use that identifier.
- Variable: InferiorThread.inferior
-
The inferior this thread belongs to. This attribute is represented as
agdb.Inferiorobject. This attribute is not writable.
- Variable: InferiorThread.details
-
A string containing target specific thread state information. The
format of this string varies by target. If there is no additional
state information for this thread, then this attribute contains
None.For example, on a GNU/Linux system, a thread that is in the
process of exiting will return the string ‘Exiting’. For remote
targets thedetailsstring will be obtained with the
‘qThreadExtraInfo’ remote packet, if the target supports it
(see ‘qThreadExtraInfo’).GDB displays the
detailsstring as part of the
‘Target Id’ column, in theinfo threadsoutput
(see ‘info threads’).
A gdb.InferiorThread object has the following methods:
- Function: InferiorThread.is_valid ()
-
Returns
Trueif thegdb.InferiorThreadobject is valid,
Falseif not. Agdb.InferiorThreadobject will become
invalid if the thread exits, or the inferior that the thread belongs
is deleted. All othergdb.InferiorThreadmethods will throw an
exception if it is invalid at the time the method is called.
- Function: InferiorThread.switch ()
-
This changes GDB’s currently selected thread to the one represented
by this object.
- Function: InferiorThread.is_stopped ()
-
Return a Boolean indicating whether the thread is stopped.
- Function: InferiorThread.is_running ()
-
Return a Boolean indicating whether the thread is running.
- Function: InferiorThread.is_exited ()
-
Return a Boolean indicating whether the thread is exited.
- Function: InferiorThread.handle ()
-
Return the thread object’s handle, represented as a Python
bytes
object. Agdb.Valuerepresentation of the handle may be
constructed viagdb.Value(bufobj, type)where bufobj is
the Pythonbytesrepresentation of the handle and type is
agdb.Typefor the handle type.
23.3.2.19 Recordings In Python
The following recordings-related functions
(see Process Record and Replay) are available in the gdb
module:
- Function: gdb.start_recording ([method], [format])
-
Start a recording using the given method and format. If
no format is given, the default format for the recording method
is used. If no method is given, the default method will be used.
Returns agdb.Recordobject on success. Throw an exception on
failure.The following strings can be passed as method:
-
"full" -
"btrace": Possible values for format:"pt",
"bts"or leave out for default format.
-
- Function: gdb.current_recording ()
-
Access a currently running recording. Return a
gdb.Record
object on success. ReturnNoneif no recording is currently
active.
- Function: gdb.stop_recording ()
-
Stop the current recording. Throw an exception if no recording is
currently active. All record objects become invalid after this call.
A gdb.Record object has the following attributes:
- Variable: Record.method
-
A string with the current recording method, e.g.
fullor
btrace.
- Variable: Record.format
-
A string with the current recording format, e.g.
bt,ptsor
None.
- Variable: Record.begin
-
A method specific instruction object representing the first instruction
in this recording.
- Variable: Record.end
-
A method specific instruction object representing the current
instruction, that is not actually part of the recording.
- Variable: Record.replay_position
-
The instruction representing the current replay position. If there is
no replay active, this will beNone.
- Variable: Record.instruction_history
-
A list with all recorded instructions.
- Variable: Record.function_call_history
-
A list with all recorded function call segments.
A gdb.Record object has the following methods:
- Function: Record.goto (instruction)
-
Move the replay position to the given instruction.
The common gdb.Instruction class that recording method specific
instruction objects inherit from, has the following attributes:
- Variable: Instruction.pc
-
An integer representing this instruction’s address.
- Variable: Instruction.data
-
A buffer with the raw instruction data. In Python 3, the return value is a
memoryviewobject.
- Variable: Instruction.decoded
-
A human readable string with the disassembled instruction.
- Variable: Instruction.size
-
The size of the instruction in bytes.
Additionally gdb.RecordInstruction has the following attributes:
- Variable: RecordInstruction.number
-
An integer identifying this instruction.
numbercorresponds to
the numbers seen inrecord instruction-history
(see Process Record and Replay).
- Variable: RecordInstruction.sal
-
A
gdb.Symtab_and_lineobject representing the associated symtab
and line of this instruction. May beNoneif no debug information is
available.
- Variable: RecordInstruction.is_speculative
-
A boolean indicating whether the instruction was executed speculatively.
If an error occured during recording or decoding a recording, this error is
represented by a gdb.RecordGap object in the instruction list. It has
the following attributes:
- Variable: RecordGap.number
-
An integer identifying this gap.
numbercorresponds to the numbers seen
inrecord instruction-history(see Process Record and Replay).
- Variable: RecordGap.error_code
-
A numerical representation of the reason for the gap. The value is specific to
the current recording method.
- Variable: RecordGap.error_string
-
A human readable string with the reason for the gap.
A gdb.RecordFunctionSegment object has the following attributes:
- Variable: RecordFunctionSegment.number
-
An integer identifying this function segment.
numbercorresponds to
the numbers seen inrecord function-call-history
(see Process Record and Replay).
- Variable: RecordFunctionSegment.symbol
-
A
gdb.Symbolobject representing the associated symbol. May be
Noneif no debug information is available.
- Variable: RecordFunctionSegment.level
-
An integer representing the function call’s stack level. May be
Noneif the function call is a gap.
- Variable: RecordFunctionSegment.instructions
-
A list of
gdb.RecordInstructionorgdb.RecordGapobjects
associated with this function call.
- Variable: RecordFunctionSegment.up
-
A
gdb.RecordFunctionSegmentobject representing the caller’s
function segment. If the call has not been recorded, this will be the
function segment to which control returns. If neither the call nor the
return have been recorded, this will beNone.
- Variable: RecordFunctionSegment.prev
-
A
gdb.RecordFunctionSegmentobject representing the previous
segment of this function call. May beNone.
- Variable: RecordFunctionSegment.next
-
A
gdb.RecordFunctionSegmentobject representing the next segment of
this function call. May beNone.
The following example demonstrates the usage of these objects and
functions to create a function that will rewind a record to the last
time a function in a different file was executed. This would typically
be used to track the execution of user provided callback functions in a
library which typically are not visible in a back trace.
def bringback ():
rec = gdb.current_recording ()
if not rec:
return
insn = rec.instruction_history
if len (insn) == 0:
return
try:
position = insn.index (rec.replay_position)
except:
position = -1
try:
filename = insn[position].sal.symtab.fullname ()
except:
filename = None
for i in reversed (insn[:position]):
try:
current = i.sal.symtab.fullname ()
except:
current = None
if filename == current:
continue
rec.goto (i)
return
Another possible application is to write a function that counts the
number of code executions in a given line range. This line range can
contain parts of functions or span across several functions and is not
limited to be contiguous.
def countrange (filename, linerange):
count = 0
def filter_only (file_name):
for call in gdb.current_recording ().function_call_history:
try:
if file_name in call.symbol.symtab.fullname ():
yield call
except:
pass
for c in filter_only (filename):
for i in c.instructions:
try:
if i.sal.line in linerange:
count += 1
break;
except:
pass
return count
23.3.2.20 CLI Commands In Python
You can implement new GDB CLI commands in Python. A CLI
command is implemented using an instance of the gdb.Command
class, most commonly using a subclass.
- Function: Command.__init__ (name, command_class [, completer_class [, prefix]])
-
The object initializer for
Commandregisters the new command
with GDB. This initializer is normally invoked from the
subclass’ own__init__method.name is the name of the command. If name consists of
multiple words, then the initial words are looked for as prefix
commands. In this case, if one of the prefix commands does not exist,
an exception is raised.There is no support for multi-line commands.
command_class should be one of the ‘COMMAND_’ constants
defined below. This argument tells GDB how to categorize the
new command in the help system.completer_class is an optional argument. If given, it should be
one of the ‘COMPLETE_’ constants defined below. This argument
tells GDB how to perform completion for this command. If not
given, GDB will attempt to complete using the object’s
completemethod (see below); if no such method is found, an
error will occur when completion is attempted.prefix is an optional argument. If
True, then the new
command is a prefix command; sub-commands of this command may be
registered.The help text for the new command is taken from the Python
documentation string for the command’s class, if there is one. If no
documentation string is provided, the default value “This command is
not documented.” is used.
- Function: Command.dont_repeat ()
-
By default, a GDB command is repeated when the user enters a
blank line at the command prompt. A command can suppress this
behavior by invoking thedont_repeatmethod at some point in
itsinvokemethod (normally this is done early in case of
exception). This is similar to the user commanddont-repeat,
see dont-repeat.
- Function: Command.invoke (argument, from_tty)
-
This method is called by GDB when this command is invoked.
argument is a string. It is the argument to the command, after
leading and trailing whitespace has been stripped.from_tty is a boolean argument. When true, this means that the
command was entered by the user at the terminal; when false it means
that the command came from elsewhere.If this method throws an exception, it is turned into a GDB
errorcall. Otherwise, the return value is ignored.To break argument up into an argv-like string use
gdb.string_to_argv. This function behaves identically to
GDB’s internal argument lexerbuildargv.
It is recommended to use this for consistency.
Arguments are separated by spaces and may be quoted.
Example:print gdb.string_to_argv ("1 2 \"3 '4 "5' "6 '7"") ['1', '2 "3', '4 "5', "6 '7"]
- Function: Command.complete (text, word)
-
This method is called by GDB when the user attempts
completion on this command. All forms of completion are handled by
this method, that is, the TAB and M-? key bindings
(see Completion), and thecompletecommand (see complete).The arguments text and word are both strings; text
holds the complete command line up to the cursor’s location, while
word holds the last word of the command line; this is computed
using a word-breaking heuristic.The
completemethod can return several values:- If the return value is a sequence, the contents of the sequence are
used as the completions. It is up tocompleteto ensure that the
contents actually do complete the word. A zero-length sequence is
allowed, it means that there were no completions available. Only
string elements of the sequence are used; other elements in the
sequence are ignored. - If the return value is one of the ‘COMPLETE_’ constants defined
below, then the corresponding GDB-internal completion
function is invoked, and its result is used. - All other results are treated as though there were no available
completions.
- If the return value is a sequence, the contents of the sequence are
When a new command is registered, it must be declared as a member of
some general class of commands. This is used to classify top-level
commands in the on-line help system; note that prefix commands are not
listed under their own category but rather that of their top-level
command. The available classifications are represented by constants
defined in the gdb module:
gdb.COMMAND_NONE-
The command does not belong to any particular class. A command in
this category will not be displayed in any of the help categories. gdb.COMMAND_RUNNING-
The command is related to running the inferior. For example,
start,step, andcontinueare in this category.
Type help running at the GDB prompt to see a list of
commands in this category. gdb.COMMAND_DATA-
The command is related to data or variables. For example,
call,find, andprintare in this category. Type
help data at the GDB prompt to see a list of commands
in this category. gdb.COMMAND_STACK-
The command has to do with manipulation of the stack. For example,
backtrace,frame, andreturnare in this
category. Type help stack at the GDB prompt to see a
list of commands in this category. gdb.COMMAND_FILES-
This class is used for file-related commands. For example,
file,listandsectionare in this category.
Type help files at the GDB prompt to see a list of
commands in this category. gdb.COMMAND_SUPPORT-
This should be used for “support facilities”, generally meaning
things that are useful to the user when interacting with GDB,
but not related to the state of the inferior. For example,
help,make, andshellare in this category. Type
help support at the GDB prompt to see a list of
commands in this category. gdb.COMMAND_STATUS-
The command is an ‘info’-related command, that is, related to the
state of GDB itself. For example,info,macro,
andshoware in this category. Type help status at the
GDB prompt to see a list of commands in this category. gdb.COMMAND_BREAKPOINTS-
The command has to do with breakpoints. For example,
break,
clear, anddeleteare in this category. Type help
breakpoints at the GDB prompt to see a list of commands in
this category. gdb.COMMAND_TRACEPOINTS-
The command has to do with tracepoints. For example,
trace,
actions, andtfindare in this category. Type
help tracepoints at the GDB prompt to see a list of
commands in this category. gdb.COMMAND_TUI-
The command has to do with the text user interface (see TUI).
Type help tui at the GDB prompt to see a list of
commands in this category. gdb.COMMAND_USER-
The command is a general purpose command for the user, and typically
does not fit in one of the other categories.
Type help user-defined at the GDB prompt to see
a list of commands in this category, as well as the list of gdb macros
(see Sequences). gdb.COMMAND_OBSCURE-
The command is only used in unusual circumstances, or is not of
general interest to users. For example,checkpoint,
fork, andstopare in this category. Type help
obscure at the GDB prompt to see a list of commands in this
category. gdb.COMMAND_MAINTENANCE-
The command is only useful to GDB maintainers. The
maintenanceandflushregscommands are in this category.
Type help internals at the GDB prompt to see a list of
commands in this category.
A new command can use a predefined completion function, either by
specifying it via an argument at initialization, or by returning it
from the complete method. These predefined completion
constants are all defined in the gdb module:
gdb.COMPLETE_NONE-
This constant means that no completion should be done.
gdb.COMPLETE_FILENAME-
This constant means that filename completion should be performed.
gdb.COMPLETE_LOCATION-
This constant means that location completion should be done.
See Location Specifications. gdb.COMPLETE_COMMAND-
This constant means that completion should examine GDB
command names. gdb.COMPLETE_SYMBOL-
This constant means that completion should be done using symbol names
as the source. gdb.COMPLETE_EXPRESSION-
This constant means that completion should be done on expressions.
Often this means completing on symbol names, but some language
parsers also have support for completing on field names.
The following code snippet shows how a trivial CLI command can be
implemented in Python:
class HelloWorld (gdb.Command):
"""Greet the whole world."""
def __init__ (self):
super (HelloWorld, self).__init__ ("hello-world", gdb.COMMAND_USER)
def invoke (self, arg, from_tty):
print ("Hello, World!")
HelloWorld ()
The last line instantiates the class, and is necessary to trigger the
registration of the command with GDB. Depending on how the
Python code is read into GDB, you may need to import the
gdb module explicitly.
23.3.2.21 GDB/MI Commands In Python
It is possible to add GDB/MI (see GDB/MI) commands
implemented in Python. A GDB/MI command is implemented using an
instance of the gdb.MICommand class, most commonly using a
subclass.
- Function: MICommand.__init__ (name)
-
The object initializer for
MICommandregisters the new command
with GDB. This initializer is normally invoked from the
subclass’ own__init__method.name is the name of the command. It must be a valid name of a
GDB/MI command, and in particular must start with a hyphen
(-). Reusing the name of a built-in GDB/MI is not
allowed, and aRuntimeErrorwill be raised. Using the name
of an GDB/MI command previously defined in Python is allowed, the
previous command will be replaced with the new command.
- Function: MICommand.invoke (arguments)
-
This method is called by GDB when the new MI command is
invoked.arguments is a list of strings. Note, that
--thread
and--framearguments are handled by GDB itself therefore
they do not show up inarguments.If this method raises an exception, then it is turned into a
GDB/MI^errorresponse. Onlygdb.GdbError
exceptions (or its sub-classes) should be used for reporting errors to
users, any other exception type is treated as a failure of the
invokemethod, and the exception will be printed to the error
stream according to the set python print-stack setting
(see set python print-stack).If this method returns
None, then the GDB/MI command will
return a^doneresponse with no additional values.Otherwise, the return value must be a dictionary, which is converted
to a GDB/MI result-record (see GDB/MI Output Syntax).
The keys of this dictionary must be strings, and are used as
variable names in the result-record, these strings must
comply with the naming rules detailed below. The values of this
dictionary are recursively handled as follows:- If the value is Python sequence or iterator, it is converted to
GDB/MI list with elements converted recursively. - If the value is Python dictionary, it is converted to
GDB/MI tuple. Keys in that dictionary must be strings,
which comply with the variable naming rules detailed below.
Values are converted recursively. - Otherwise, value is first converted to a Python string using
str ()and then converted to GDB/MI const.
The strings used for variable names in the GDB/MI output
must follow the following rules; the string must be at least one
character long, the first character must be in the set
[a-zA-Z], while every subsequent character must be in the set
[-_a-zA-Z0-9]. - If the value is Python sequence or iterator, it is converted to
An instance of MICommand has the following attributes:
- Variable: MICommand.name
-
A string, the name of this GDB/MI command, as was passed to the
__init__method. This attribute is read-only.
- Variable: MICommand.installed
-
A boolean value indicating if this command is installed ready for a
user to call from the command line. Commands are automatically
installed when they are instantiated, after which this attribute will
beTrue.If later, a new command is created with the same name, then the
original command will become uninstalled, and this attribute will be
False.This attribute is read-write, setting this attribute to
False
will uninstall the command, removing it from the set of available
commands. Setting this attribute toTruewill install the
command for use. If there is already a Python command with this name
installed, the currently installed command will be uninstalled, and
this command installed in its place.
The following code snippet shows how a two trivial MI command can be
implemented in Python:
class MIEcho(gdb.MICommand):
"""Echo arguments passed to the command."""
def __init__(self, name, mode):
self._mode = mode
super(MIEcho, self).__init__(name)
def invoke(self, argv):
if self._mode == 'dict':
return { 'dict': { 'argv' : argv } }
elif self._mode == 'list':
return { 'list': argv }
else:
return { 'string': ", ".join(argv) }
MIEcho("-echo-dict", "dict")
MIEcho("-echo-list", "list")
MIEcho("-echo-string", "string")
The last three lines instantiate the class three times, creating three
new GDB/MI commands -echo-dict, -echo-list, and
-echo-string. Each time a subclass of gdb.MICommand is
instantiated, the new command is automatically registered with
GDB.
Depending on how the Python code is read into GDB, you may
need to import the gdb module explicitly.
The following example shows a GDB session in which the above
commands have been added:
(gdb)
-echo-dict abc def ghi
^done,dict={argv=["abc","def","ghi"]}
(gdb)
-echo-list abc def ghi
^done,list=["abc","def","ghi"]
(gdb)
-echo-string abc def ghi
^done,string="abc, def, ghi"
(gdb)
23.3.2.22 Parameters In Python
You can implement new GDB parameters using Python. A new
parameter is implemented as an instance of the gdb.Parameter
class.
Parameters are exposed to the user via the set and
show commands. See Help.
There are many parameters that already exist and can be set in
GDB. Two examples are: set follow fork and
set charset. Setting these parameters influences certain
behavior in GDB. Similarly, you can define parameters that
can be used to influence behavior in custom Python scripts and commands.
- Function: Parameter.__init__ (name, command-class, parameter-class [, enum-sequence])
-
The object initializer for
Parameterregisters the new
parameter with GDB. This initializer is normally invoked
from the subclass’ own__init__method.name is the name of the new parameter. If name consists
of multiple words, then the initial words are looked for as prefix
parameters. An example of this can be illustrated with the
set printset of parameters. If name is
print foo, thenprintwill be searched as the prefix
parameter. In this case the parameter can subsequently be accessed in
GDB asset print foo.If name consists of multiple words, and no prefix parameter group
can be found, an exception is raised.command-class should be one of the ‘COMMAND_’ constants
(see CLI Commands In Python). This argument tells GDB how to
categorize the new parameter in the help system.parameter-class should be one of the ‘PARAM_’ constants
defined below. This argument tells GDB the type of the new
parameter; this information is used for input validation and
completion.If parameter-class is
PARAM_ENUM, then
enum-sequence must be a sequence of strings. These strings
represent the possible values for the parameter.If parameter-class is not
PARAM_ENUM, then the presence
of a fourth argument will cause an exception to be thrown.The help text for the new parameter includes the Python documentation
string from the parameter’s class, if there is one. If there is no
documentation string, a default value is used. The documentation
string is included in the output of the parametershelp setand
help showcommands, and should be written taking this into
account.
- Variable: Parameter.set_doc
-
If this attribute exists, and is a string, then its value is used as
the first part of the help text for this parameter’sset
command. The second part of the help text is taken from the
documentation string for the parameter’s class, if there is one.The value of
set_docshould give a brief summary specific to
the set action, this text is only displayed when the user runs the
help setcommand for this parameter. The class documentation
should be used to give a fuller description of what the parameter
does, this text is displayed for both thehelp setand
help showcommands.The
set_docvalue is examined whenParameter.__init__is
invoked; subsequent changes have no effect.
- Variable: Parameter.show_doc
-
If this attribute exists, and is a string, then its value is used as
the first part of the help text for this parameter’sshow
command. The second part of the help text is taken from the
documentation string for the parameter’s class, if there is one.The value of
show_docshould give a brief summary specific to
the show action, this text is only displayed when the user runs the
help showcommand for this parameter. The class documentation
should be used to give a fuller description of what the parameter
does, this text is displayed for both thehelp setand
help showcommands.The
show_docvalue is examined whenParameter.__init__
is invoked; subsequent changes have no effect.
- Variable: Parameter.value
-
The
valueattribute holds the underlying value of the
parameter. It can be read and assigned to just as any other
attribute. GDB does validation when assignments are made.
There are two methods that may be implemented in any Parameter
class. These are:
- Function: Parameter.get_set_string (self)
-
If this method exists, GDB will call it when a
parameter’s value has been changed via thesetAPI (for
example, set foo off). Thevalueattribute has already
been populated with the new value and may be used in output. This
method must return a string. If the returned string is not empty,
GDB will present it to the user.If this method raises the
gdb.GdbErrorexception
(see Exception Handling), then GDB will print the
exception’s string and thesetcommand will fail. Note,
however, that thevalueattribute will not be reset in this
case. So, if your parameter must validate values, it should store the
old value internally and reset the exposed value, like so:class ExampleParam (gdb.Parameter): def __init__ (self, name): super (ExampleParam, self).__init__ (name, gdb.COMMAND_DATA, gdb.PARAM_BOOLEAN) self.value = True self.saved_value = True def validate(self): return False def get_set_string (self): if not self.validate(): self.value = self.saved_value raise gdb.GdbError('Failed to validate') self.saved_value = self.value return ""
- Function: Parameter.get_show_string (self, svalue)
-
GDB will call this method when a parameter’s
showAPI has been invoked (for example, show foo). The
argumentsvaluereceives the string representation of the
current value. This method must return a string.
When a new parameter is defined, its type must be specified. The
available types are represented by constants defined in the gdb
module:
gdb.PARAM_BOOLEAN-
The value is a plain boolean. The Python boolean values,
True
andFalseare the only valid values. gdb.PARAM_AUTO_BOOLEAN-
The value has three possible states: true, false, and ‘auto’. In
Python, true and false are represented using boolean constants, and
‘auto’ is represented usingNone. gdb.PARAM_UINTEGER-
The value is an unsigned integer. The value of 0 should be
interpreted to mean “unlimited”. gdb.PARAM_INTEGER-
The value is a signed integer. The value of 0 should be interpreted
to mean “unlimited”. gdb.PARAM_STRING-
The value is a string. When the user modifies the string, any escape
sequences, such as ‘t’, ‘f’, and octal escapes, are
translated into corresponding characters and encoded into the current
host charset. gdb.PARAM_STRING_NOESCAPE-
The value is a string. When the user modifies the string, escapes are
passed through untranslated. gdb.PARAM_OPTIONAL_FILENAME-
The value is a either a filename (a string), or
None. gdb.PARAM_FILENAME-
The value is a filename. This is just like
PARAM_STRING_NOESCAPE, but uses file names for completion. gdb.PARAM_ZINTEGER-
The value is an integer. This is like
PARAM_INTEGER, except 0
is interpreted as itself. gdb.PARAM_ZUINTEGER-
The value is an unsigned integer. This is like
PARAM_INTEGER,
except 0 is interpreted as itself, and the value cannot be negative. gdb.PARAM_ZUINTEGER_UNLIMITED-
The value is a signed integer. This is like
PARAM_ZUINTEGER,
except the special value -1 should be interpreted to mean
“unlimited”. Other negative values are not allowed. gdb.PARAM_ENUM-
The value is a string, which must be one of a collection string
constants provided when the parameter is created.
23.3.2.23 Writing new convenience functions
You can implement new convenience functions (see Convenience Vars)
in Python. A convenience function is an instance of a subclass of the
class gdb.Function.
- Function: Function.__init__ (name)
-
The initializer for
Functionregisters the new function with
GDB. The argument name is the name of the function,
a string. The function will be visible to the user as a convenience
variable of typeinternal function, whose name is the same as
the given name.The documentation for the new function is taken from the documentation
string for the new class.
- Function: Function.invoke (*args)
-
When a convenience function is evaluated, its arguments are converted
to instances ofgdb.Value, and then the function’s
invokemethod is called. Note that GDB does not
predetermine the arity of convenience functions. Instead, all
available arguments are passed toinvoke, following the
standard Python calling convention. In particular, a convenience
function can have default values for parameters without ill effect.The return value of this method is used as its value in the enclosing
expression. If an ordinary Python value is returned, it is converted
to agdb.Valuefollowing the usual rules.
The following code snippet shows how a trivial convenience function can
be implemented in Python:
class Greet (gdb.Function):
"""Return string to greet someone.
Takes a name as argument."""
def __init__ (self):
super (Greet, self).__init__ ("greet")
def invoke (self, name):
return "Hello, %s!" % name.string ()
Greet ()
The last line instantiates the class, and is necessary to trigger the
registration of the function with GDB. Depending on how the
Python code is read into GDB, you may need to import the
gdb module explicitly.
Now you can use the function in an expression:
(gdb) print $greet("Bob")
$1 = "Hello, Bob!"
23.3.2.24 Program Spaces In Python
A program space, or progspace, represents a symbolic view
of an address space.
It consists of all of the objfiles of the program.
See Objfiles In Python.
See program spaces, for more details
about program spaces.
The following progspace-related functions are available in the
gdb module:
- Function: gdb.current_progspace ()
-
This function returns the program space of the currently selected inferior.
See Inferiors Connections and Programs. This is identical to
gdb.selected_inferior().progspace(see Inferiors In Python) and is
included for historical compatibility.
- Function: gdb.progspaces ()
-
Return a sequence of all the progspaces currently known to GDB.
Each progspace is represented by an instance of the gdb.Progspace
class.
- Variable: Progspace.filename
-
The file name of the progspace as a string.
- Variable: Progspace.pretty_printers
-
The
pretty_printersattribute is a list of functions. It is
used to look up pretty-printers. AValueis passed to each
function in order; if the function returnsNone, then the
search continues. Otherwise, the return value should be an object
which is used to format the value. See Pretty Printing API, for more
information.
- Variable: Progspace.type_printers
-
The
type_printersattribute is a list of type printer objects.
See Type Printing API, for more information.
- Variable: Progspace.frame_filters
-
The
frame_filtersattribute is a dictionary of frame filter
objects. See Frame Filter API, for more information.
A program space has the following methods:
- Function: Progspace.block_for_pc (pc)
-
Return the innermost
gdb.Blockcontaining the given pc
value. If the block cannot be found for the pc value specified,
the function will returnNone.
- Function: Progspace.find_pc_line (pc)
-
Return the
gdb.Symtab_and_lineobject corresponding to the
pc value. See Symbol Tables In Python. If an invalid value
of pc is passed as an argument, then thesymtaband
lineattributes of the returnedgdb.Symtab_and_line
object will beNoneand 0 respectively.
- Function: Progspace.is_valid ()
-
Returns
Trueif thegdb.Progspaceobject is valid,
Falseif not. Agdb.Progspaceobject can become invalid
if the program space file it refers to is not referenced by any
inferior. All othergdb.Progspacemethods will throw an
exception if it is invalid at the time the method is called.
- Function: Progspace.objfiles ()
-
Return a sequence of all the objfiles referenced by this program
space. See Objfiles In Python.
- Function: Progspace.solib_name (address)
-
Return the name of the shared library holding the given address
as a string, orNone.
One may add arbitrary attributes to gdb.Progspace objects
in the usual Python way.
This is useful if, for example, one needs to do some extra record keeping
associated with the program space.
In this contrived example, we want to perform some processing when
an objfile with a certain symbol is loaded, but we only want to do
this once because it is expensive. To achieve this we record the results
with the program space because we can’t predict when the desired objfile
will be loaded.
(gdb) python
def clear_objfiles_handler(event):
event.progspace.expensive_computation = None
def expensive(symbol):
"""A mock routine to perform an "expensive" computation on symbol."""
print ("Computing the answer to the ultimate question ...")
return 42
def new_objfile_handler(event):
objfile = event.new_objfile
progspace = objfile.progspace
if not hasattr(progspace, 'expensive_computation') or
progspace.expensive_computation is None:
# We use 'main' for the symbol to keep the example simple.
# Note: There's no current way to constrain the lookup
# to one objfile.
symbol = gdb.lookup_global_symbol('main')
if symbol is not None:
progspace.expensive_computation = expensive(symbol)
gdb.events.clear_objfiles.connect(clear_objfiles_handler)
gdb.events.new_objfile.connect(new_objfile_handler)
end
(gdb) file /tmp/hello
Reading symbols from /tmp/hello...
Computing the answer to the ultimate question ...
(gdb) python print gdb.current_progspace().expensive_computation
42
(gdb) run
Starting program: /tmp/hello
Hello.
[Inferior 1 (process 4242) exited normally]
23.3.2.25 Objfiles In Python
GDB loads symbols for an inferior from various
symbol-containing files (see Files). These include the primary
executable file, any shared libraries used by the inferior, and any
separate debug info files (see Separate Debug Files).
GDB calls these symbol-containing files objfiles.
The following objfile-related functions are available in the
gdb module:
- Function: gdb.current_objfile ()
-
When auto-loading a Python script (see Python Auto-loading), GDB
sets the “current objfile” to the corresponding objfile. This
function returns the current objfile. If there is no current objfile,
this function returnsNone.
- Function: gdb.objfiles ()
-
Return a sequence of objfiles referenced by the current program space.
See Objfiles In Python, and Progspaces In Python. This is identical
togdb.selected_inferior().progspace.objfiles()and is included for
historical compatibility.
- Function: gdb.lookup_objfile (name [, by_build_id])
-
Look up name, a file name or build ID, in the list of objfiles
for the current program space (see Progspaces In Python).
If the objfile is not found throw the PythonValueErrorexception.If name is a relative file name, then it will match any
source file name with the same trailing components. For example, if
name is ‘gcc/expr.c’, then it will match source file
name of /build/trunk/gcc/expr.c, but not
/build/trunk/libcpp/expr.c or /build/trunk/gcc/x-expr.c.If by_build_id is provided and is
Truethen name
is the build ID of the objfile. Otherwise, name is a file name.
This is supported only on some operating systems, notably those which use
the ELF format for binary files and the GNU Binutils. For more details
about this feature, see the description of the —build-id
command-line option in Command Line Options in The GNU Linker.
Each objfile is represented by an instance of the gdb.Objfile
class.
- Variable: Objfile.filename
-
The file name of the objfile as a string, with symbolic links resolved.
The value is
Noneif the objfile is no longer valid.
See thegdb.Objfile.is_validmethod, described below.
- Variable: Objfile.username
-
The file name of the objfile as specified by the user as a string.
The value is
Noneif the objfile is no longer valid.
See thegdb.Objfile.is_validmethod, described below.
- Variable: Objfile.is_file
-
An objfile often comes from an ordinary file, but in some cases it may
be constructed from the contents of memory. This attribute is
Truefor file-backed objfiles, andFalsefor other
kinds.
- Variable: Objfile.owner
-
For separate debug info objfiles this is the corresponding
gdb.Objfile
object that debug info is being provided for.
Otherwise this isNone.
Separate debug info objfiles are added with the
gdb.Objfile.add_separate_debug_filemethod, described below.
- Variable: Objfile.build_id
-
The build ID of the objfile as a string.
If the objfile does not have a build ID then the value isNone.This is supported only on some operating systems, notably those which use
the ELF format for binary files and the GNU Binutils. For more details
about this feature, see the description of the —build-id
command-line option in Command Line Options in The GNU Linker.
- Variable: Objfile.progspace
-
The containing program space of the objfile as a
gdb.Progspace
object. See Progspaces In Python.
- Variable: Objfile.pretty_printers
-
The
pretty_printersattribute is a list of functions. It is
used to look up pretty-printers. AValueis passed to each
function in order; if the function returnsNone, then the
search continues. Otherwise, the return value should be an object
which is used to format the value. See Pretty Printing API, for more
information.
- Variable: Objfile.type_printers
-
The
type_printersattribute is a list of type printer objects.
See Type Printing API, for more information.
- Variable: Objfile.frame_filters
-
The
frame_filtersattribute is a dictionary of frame filter
objects. See Frame Filter API, for more information.
One may add arbitrary attributes to gdb.Objfile objects
in the usual Python way.
This is useful if, for example, one needs to do some extra record keeping
associated with the objfile.
In this contrived example we record the time when GDB
loaded the objfile.
(gdb) python
import datetime
def new_objfile_handler(event):
# Set the time_loaded attribute of the new objfile.
event.new_objfile.time_loaded = datetime.datetime.today()
gdb.events.new_objfile.connect(new_objfile_handler)
end
(gdb) file ./hello
Reading symbols from ./hello...
(gdb) python print gdb.objfiles()[0].time_loaded
2014-10-09 11:41:36.770345
A gdb.Objfile object has the following methods:
- Function: Objfile.is_valid ()
-
Returns
Trueif thegdb.Objfileobject is valid,
Falseif not. Agdb.Objfileobject can become invalid
if the object file it refers to is not loaded in GDB any
longer. All othergdb.Objfilemethods will throw an exception
if it is invalid at the time the method is called.
- Function: Objfile.add_separate_debug_file (file)
-
Add file to the list of files that GDB will search for
debug information for the objfile.
This is useful when the debug info has been removed from the program
and stored in a separate file. GDB has built-in support for
finding separate debug info files (see Separate Debug Files), but if
the file doesn’t live in one of the standard places that GDB
searches then this function can be used to add a debug info file
from a different place.
- Function: Objfile.lookup_global_symbol (name [, domain])
-
Search for a global symbol named name in this objfile. Optionally, the
search scope can be restricted with the domain argument.
The domain argument must be a domain constant defined in thegdb
module and described in Symbols In Python. This function is similar to
gdb.lookup_global_symbol, except that the search is limited to this
objfile.The result is a
gdb.Symbolobject orNoneif the symbol
is not found.
- Function: Objfile.lookup_static_symbol (name [, domain])
-
Like
Objfile.lookup_global_symbol, but searches for a global
symbol with static linkage named name in this objfile.
23.3.2.26 Accessing inferior stack frames from Python
When the debugged program stops, GDB is able to analyze its call
stack (see Stack frames). The gdb.Frame class
represents a frame in the stack. A gdb.Frame object is only valid
while its corresponding frame exists in the inferior’s stack. If you try
to use an invalid frame object, GDB will throw a gdb.error
exception (see Exception Handling).
Two gdb.Frame objects can be compared for equality with the ==
operator, like:
(gdb) python print gdb.newest_frame() == gdb.selected_frame () True
The following frame-related functions are available in the gdb module:
- Function: gdb.selected_frame ()
-
Return the selected frame object. (see Selecting a Frame).
- Function: gdb.newest_frame ()
-
Return the newest frame object for the selected thread.
- Function: gdb.frame_stop_reason_string (reason)
-
Return a string explaining the reason why GDB stopped unwinding
frames, as expressed by the given reason code (an integer, see the
unwind_stop_reasonmethod further down in this section).
- Function: gdb.invalidate_cached_frames
-
GDB internally keeps a cache of the frames that have been
unwound. This function invalidates this cache.This function should not generally be called by ordinary Python code.
It is documented for the sake of completeness.
A gdb.Frame object has the following methods:
- Function: Frame.is_valid ()
-
Returns true if the
gdb.Frameobject is valid, false if not.
A frame object can become invalid if the frame it refers to doesn’t
exist anymore in the inferior. Allgdb.Framemethods will throw
an exception if it is invalid at the time the method is called.
- Function: Frame.name ()
-
Returns the function name of the frame, or
Noneif it can’t be
obtained.
- Function: Frame.architecture ()
-
Returns the
gdb.Architectureobject corresponding to the frame’s
architecture. See Architectures In Python.
- Function: Frame.type ()
-
Returns the type of the frame. The value can be one of:
gdb.NORMAL_FRAME-
An ordinary stack frame.
gdb.DUMMY_FRAME-
A fake stack frame that was created by GDB when performing an
inferior function call. gdb.INLINE_FRAME-
A frame representing an inlined function. The function was inlined
into agdb.NORMAL_FRAMEthat is older than this one. gdb.TAILCALL_FRAME-
A frame representing a tail call. See Tail Call Frames.
gdb.SIGTRAMP_FRAME-
A signal trampoline frame. This is the frame created by the OS when
it calls into a signal handler. gdb.ARCH_FRAME-
A fake stack frame representing a cross-architecture call.
gdb.SENTINEL_FRAME-
This is like
gdb.NORMAL_FRAME, but it is only used for the
newest frame.
- Function: Frame.unwind_stop_reason ()
-
Return an integer representing the reason why it’s not possible to find
more frames toward the outermost frame. Use
gdb.frame_stop_reason_stringto convert the value returned by this
function to a string. The value can be one of:gdb.FRAME_UNWIND_NO_REASON-
No particular reason (older frames should be available).
gdb.FRAME_UNWIND_NULL_ID-
The previous frame’s analyzer returns an invalid result. This is no
longer used by GDB, and is kept only for backward
compatibility. gdb.FRAME_UNWIND_OUTERMOST-
This frame is the outermost.
gdb.FRAME_UNWIND_UNAVAILABLE-
Cannot unwind further, because that would require knowing the
values of registers or memory that have not been collected. gdb.FRAME_UNWIND_INNER_ID-
This frame ID looks like it ought to belong to a NEXT frame,
but we got it for a PREV frame. Normally, this is a sign of
unwinder failure. It could also indicate stack corruption. gdb.FRAME_UNWIND_SAME_ID-
This frame has the same ID as the previous one. That means
that unwinding further would almost certainly give us another
frame with exactly the same ID, so break the chain. Normally,
this is a sign of unwinder failure. It could also indicate
stack corruption. gdb.FRAME_UNWIND_NO_SAVED_PC-
The frame unwinder did not find any saved PC, but we needed
one to unwind further. gdb.FRAME_UNWIND_MEMORY_ERROR-
The frame unwinder caused an error while trying to access memory.
gdb.FRAME_UNWIND_FIRST_ERROR-
Any stop reason greater or equal to this value indicates some kind
of error. This special value facilitates writing code that tests
for errors in unwinding in a way that will work correctly even if
the list of the other values is modified in future GDB
versions. Using it, you could write:reason = gdb.selected_frame().unwind_stop_reason () reason_str = gdb.frame_stop_reason_string (reason) if reason >= gdb.FRAME_UNWIND_FIRST_ERROR: print ("An error occured: %s" % reason_str)
- Function: Frame.pc ()
-
Returns the frame’s resume address.
- Function: Frame.block ()
-
Return the frame’s code block. See Blocks In Python. If the frame
does not have a block – for example, if there is no debugging
information for the code in question – then this will throw an
exception.
- Function: Frame.function ()
-
Return the symbol for the function corresponding to this frame.
See Symbols In Python.
- Function: Frame.older ()
-
Return the frame that called this frame.
- Function: Frame.newer ()
-
Return the frame called by this frame.
- Function: Frame.find_sal ()
-
Return the frame’s symtab and line object.
See Symbol Tables In Python.
- Function: Frame.read_register (register)
-
Return the value of register in this frame. Returns a
Gdb.Valueobject. Throws an exception if register does
not exist. The register argument must be one of the following:- A string that is the name of a valid register (e.g.,
'sp'or
'rax'). - A
gdb.RegisterDescriptorobject (see Registers In Python). - A GDB internal, platform specific number. Using these
numbers is supported for historic reasons, but is not recommended as
future changes to GDB could change the mapping between
numbers and the registers they represent, breaking any Python code
that uses the platform-specific numbers. The numbers are usually
found in the corresponding platform-tdep.h file in the
GDB source tree.
Using a string to access registers will be slightly slower than the
other two methods as GDB must look up the mapping between
name and internal register number. If performance is critical
consider looking up and caching agdb.RegisterDescriptor
object. - A string that is the name of a valid register (e.g.,
- Function: Frame.read_var (variable [, block])
-
Return the value of variable in this frame. If the optional
argument block is provided, search for the variable from that
block; otherwise start at the frame’s current block (which is
determined by the frame’s current program counter). The variable
argument must be a string or agdb.Symbolobject; block must be a
gdb.Blockobject.
- Function: Frame.select ()
-
Set this frame to be the selected frame. See Examining the
Stack.
- Function: Frame.level ()
-
Return an integer, the stack frame level for this frame. See Stack Frames.
- Function: Frame.language ()
-
Return a string, the source language for this frame.
23.3.2.27 Accessing blocks from Python
In GDB, symbols are stored in blocks. A block corresponds
roughly to a scope in the source code. Blocks are organized
hierarchically, and are represented individually in Python as a
gdb.Block. Blocks rely on debugging information being
available.
A frame has a block. Please see Frames In Python, for a more
in-depth discussion of frames.
The outermost block is known as the global block. The global
block typically holds public global variables and functions.
The block nested just inside the global block is the static
block. The static block typically holds file-scoped variables and
functions.
GDB provides a method to get a block’s superblock, but there
is currently no way to examine the sub-blocks of a block, or to
iterate over all the blocks in a symbol table (see Symbol Tables In Python).
Here is a short example that should help explain blocks:
/* This is in the global block. */
int global;
/* This is in the static block. */
static int file_scope;
/* 'function' is in the global block, and 'argument' is
in a block nested inside of 'function'. */
int function (int argument)
{
/* 'local' is in a block inside 'function'. It may or may
not be in the same block as 'argument'. */
int local;
{
/* 'inner' is in a block whose superblock is the one holding
'local'. */
int inner;
/* If this call is expanded by the compiler, you may see
a nested block here whose function is 'inline_function'
and whose superblock is the one holding 'inner'. */
inline_function ();
}
}
A gdb.Block is iterable. The iterator returns the symbols
(see Symbols In Python) local to the block. Python programs
should not assume that a specific block object will always contain a
given symbol, since changes in GDB features and
infrastructure may cause symbols move across blocks in a symbol
table. You can also use Python’s dictionary syntax to access
variables in this block, e.g.:
symbol = some_block['variable'] # symbol is of type gdb.Symbol
The following block-related functions are available in the gdb
module:
- Function: gdb.block_for_pc (pc)
-
Return the innermost
gdb.Blockcontaining the given pc
value. If the block cannot be found for the pc value specified,
the function will returnNone. This is identical to
gdb.current_progspace().block_for_pc(pc)and is included for
historical compatibility.
A gdb.Block object has the following methods:
- Function: Block.is_valid ()
-
Returns
Trueif thegdb.Blockobject is valid,
Falseif not. A block object can become invalid if the block it
refers to doesn’t exist anymore in the inferior. All other
gdb.Blockmethods will throw an exception if it is invalid at
the time the method is called. The block’s validity is also checked
during iteration over symbols of the block.
A gdb.Block object has the following attributes:
- Variable: Block.start
-
The start address of the block. This attribute is not writable.
- Variable: Block.end
-
One past the last address that appears in the block. This attribute
is not writable.
- Variable: Block.function
-
The name of the block represented as a
gdb.Symbol. If the
block is not named, then this attribute holdsNone. This
attribute is not writable.For ordinary function blocks, the superblock is the static block.
However, you should note that it is possible for a function block to
have a superblock that is not the static block – for instance this
happens for an inlined function.
- Variable: Block.superblock
-
The block containing this block. If this parent block does not exist,
this attribute holdsNone. This attribute is not writable.
- Variable: Block.global_block
-
The global block associated with this block. This attribute is not
writable.
- Variable: Block.static_block
-
The static block associated with this block. This attribute is not
writable.
- Variable: Block.is_global
-
Trueif thegdb.Blockobject is a global block,
Falseif not. This attribute is not
writable.
- Variable: Block.is_static
-
Trueif thegdb.Blockobject is a static block,
Falseif not. This attribute is not writable.
23.3.2.28 Python representation of Symbols
GDB represents every variable, function and type as an
entry in a symbol table. See Examining the Symbol Table.
Similarly, Python represents these symbols in GDB with the
gdb.Symbol object.
The following symbol-related functions are available in the gdb
module:
- Function: gdb.lookup_symbol (name [, block [, domain]])
-
This function searches for a symbol by name. The search scope can be
restricted to the parameters defined in the optional domain and block
arguments.name is the name of the symbol. It must be a string. The
optional block argument restricts the search to symbols visible
in that block. The block argument must be a
gdb.Blockobject. If omitted, the block for the current frame
is used. The optional domain argument restricts
the search to the domain type. The domain argument must be a
domain constant defined in thegdbmodule and described later
in this chapter.The result is a tuple of two elements.
The first element is agdb.Symbolobject orNoneif the symbol
is not found.
If the symbol is found, the second element isTrueif the symbol
is a field of a method’s object (e.g.,thisin C++),
otherwise it isFalse.
If the symbol is not found, the second element isFalse.
- Function: gdb.lookup_global_symbol (name [, domain])
-
This function searches for a global symbol by name.
The search scope can be restricted to by the domain argument.name is the name of the symbol. It must be a string.
The optional domain argument restricts the search to the domain type.
The domain argument must be a domain constant defined in thegdb
module and described later in this chapter.The result is a
gdb.Symbolobject orNoneif the symbol
is not found.
- Function: gdb.lookup_static_symbol (name [, domain])
-
This function searches for a global symbol with static linkage by name.
The search scope can be restricted to by the domain argument.name is the name of the symbol. It must be a string.
The optional domain argument restricts the search to the domain type.
The domain argument must be a domain constant defined in thegdb
module and described later in this chapter.The result is a
gdb.Symbolobject orNoneif the symbol
is not found.Note that this function will not find function-scoped static variables. To look
up such variables, iterate over the variables of the function’s
gdb.Blockand check thatblock.addr_classis
gdb.SYMBOL_LOC_STATIC.There can be multiple global symbols with static linkage with the same
name. This function will only return the first matching symbol that
it finds. Which symbol is found depends on where GDB is
currently stopped, as GDB will first search for matching
symbols in the current object file, and then search all other object
files. If the application is not yet running then GDB will
search all object files in the order they appear in the debug
information.
- Function: gdb.lookup_static_symbols (name [, domain])
-
Similar to
gdb.lookup_static_symbol, this function searches for
global symbols with static linkage by name, and optionally restricted
by the domain argument. However, this function returns a list of all
matching symbols found, not just the first one.name is the name of the symbol. It must be a string.
The optional domain argument restricts the search to the domain type.
The domain argument must be a domain constant defined in thegdb
module and described later in this chapter.The result is a list of
gdb.Symbolobjects which could be empty
if no matching symbols were found.Note that this function will not find function-scoped static variables. To look
up such variables, iterate over the variables of the function’s
gdb.Blockand check thatblock.addr_classis
gdb.SYMBOL_LOC_STATIC.
A gdb.Symbol object has the following attributes:
- Variable: Symbol.type
-
The type of the symbol or
Noneif no type is recorded.
This attribute is represented as agdb.Typeobject.
See Types In Python. This attribute is not writable.
- Variable: Symbol.symtab
-
The symbol table in which the symbol appears. This attribute is
represented as agdb.Symtabobject. See Symbol Tables In Python. This attribute is not writable.
- Variable: Symbol.line
-
The line number in the source code at which the symbol was defined.
This is an integer.
- Variable: Symbol.name
-
The name of the symbol as a string. This attribute is not writable.
- Variable: Symbol.linkage_name
-
The name of the symbol, as used by the linker (i.e., may be mangled).
This attribute is not writable.
- Variable: Symbol.print_name
-
The name of the symbol in a form suitable for output. This is either
nameorlinkage_name, depending on whether the user
asked GDB to display demangled or mangled names.
- Variable: Symbol.addr_class
-
The address class of the symbol. This classifies how to find the value
of a symbol. Each address class is a constant defined in the
gdbmodule and described later in this chapter.
- Variable: Symbol.needs_frame
-
This is
Trueif evaluating this symbol’s value requires a frame
(see Frames In Python) andFalseotherwise. Typically,
local variables will require a frame, but other symbols will not.
- Variable: Symbol.is_argument
-
Trueif the symbol is an argument of a function.
- Variable: Symbol.is_constant
-
Trueif the symbol is a constant.
- Variable: Symbol.is_function
-
Trueif the symbol is a function or a method.
- Variable: Symbol.is_variable
-
Trueif the symbol is a variable.
A gdb.Symbol object has the following methods:
- Function: Symbol.is_valid ()
-
Returns
Trueif thegdb.Symbolobject is valid,
Falseif not. Agdb.Symbolobject can become invalid if
the symbol it refers to does not exist in GDB any longer.
All othergdb.Symbolmethods will throw an exception if it is
invalid at the time the method is called.
- Function: Symbol.value ([frame])
-
Compute the value of the symbol, as a
gdb.Value. For
functions, this computes the address of the function, cast to the
appropriate type. If the symbol requires a frame in order to compute
its value, then frame must be given. If frame is not
given, or if frame is invalid, then this method will throw an
exception.
The available domain categories in gdb.Symbol are represented
as constants in the gdb module:
gdb.SYMBOL_UNDEF_DOMAIN-
This is used when a domain has not been discovered or none of the
following domains apply. This usually indicates an error either
in the symbol information or in GDB’s handling of symbols. gdb.SYMBOL_VAR_DOMAIN-
This domain contains variables, function names, typedef names and enum
type values. gdb.SYMBOL_STRUCT_DOMAIN-
This domain holds struct, union and enum type names.
gdb.SYMBOL_LABEL_DOMAIN-
This domain contains names of labels (for gotos).
gdb.SYMBOL_MODULE_DOMAIN-
This domain contains names of Fortran module types.
gdb.SYMBOL_COMMON_BLOCK_DOMAIN-
This domain contains names of Fortran common blocks.
The available address class categories in gdb.Symbol are represented
as constants in the gdb module:
gdb.SYMBOL_LOC_UNDEF-
If this is returned by address class, it indicates an error either in
the symbol information or in GDB’s handling of symbols. gdb.SYMBOL_LOC_CONST-
Value is constant int.
gdb.SYMBOL_LOC_STATIC-
Value is at a fixed address.
gdb.SYMBOL_LOC_REGISTER-
Value is in a register.
gdb.SYMBOL_LOC_ARG-
Value is an argument. This value is at the offset stored within the
symbol inside the frame’s argument list. gdb.SYMBOL_LOC_REF_ARG-
Value address is stored in the frame’s argument list. Just like
LOC_ARGexcept that the value’s address is stored at the
offset, not the value itself. gdb.SYMBOL_LOC_REGPARM_ADDR-
Value is a specified register. Just like
LOC_REGISTERexcept
the register holds the address of the argument instead of the argument
itself. gdb.SYMBOL_LOC_LOCAL-
Value is a local variable.
gdb.SYMBOL_LOC_TYPEDEF-
Value not used. Symbols in the domain
SYMBOL_STRUCT_DOMAINall
have this class. gdb.SYMBOL_LOC_LABEL-
Value is a label.
gdb.SYMBOL_LOC_BLOCK-
Value is a block.
gdb.SYMBOL_LOC_CONST_BYTES-
Value is a byte-sequence.
gdb.SYMBOL_LOC_UNRESOLVED-
Value is at a fixed address, but the address of the variable has to be
determined from the minimal symbol table whenever the variable is
referenced. gdb.SYMBOL_LOC_OPTIMIZED_OUT-
The value does not actually exist in the program.
gdb.SYMBOL_LOC_COMPUTED-
The value’s address is a computed location.
gdb.SYMBOL_LOC_COMMON_BLOCK-
The value’s address is a symbol. This is only used for Fortran common
blocks.
23.3.2.29 Symbol table representation in Python
Access to symbol table data maintained by GDB on the inferior
is exposed to Python via two objects: gdb.Symtab_and_line and
gdb.Symtab. Symbol table and line data for a frame is returned
from the find_sal method in gdb.Frame object.
See Frames In Python.
For more information on GDB’s symbol table management, see
Examining the Symbol Table, for more information.
A gdb.Symtab_and_line object has the following attributes:
- Variable: Symtab_and_line.symtab
-
The symbol table object (
gdb.Symtab) for this frame.
This attribute is not writable.
- Variable: Symtab_and_line.pc
-
Indicates the start of the address range occupied by code for the
current source line. This attribute is not writable.
- Variable: Symtab_and_line.last
-
Indicates the end of the address range occupied by code for the current
source line. This attribute is not writable.
- Variable: Symtab_and_line.line
-
Indicates the current line number for this object. This
attribute is not writable.
A gdb.Symtab_and_line object has the following methods:
- Function: Symtab_and_line.is_valid ()
-
Returns
Trueif thegdb.Symtab_and_lineobject is valid,
Falseif not. Agdb.Symtab_and_lineobject can become
invalid if the Symbol table and line object it refers to does not
exist in GDB any longer. All other
gdb.Symtab_and_linemethods will throw an exception if it is
invalid at the time the method is called.
A gdb.Symtab object has the following attributes:
- Variable: Symtab.filename
-
The symbol table’s source filename. This attribute is not writable.
- Variable: Symtab.objfile
-
The symbol table’s backing object file. See Objfiles In Python.
This attribute is not writable.
- Variable: Symtab.producer
-
The name and possibly version number of the program that
compiled the code in the symbol table.
The contents of this string is up to the compiler.
If no producer information is available thenNoneis returned.
This attribute is not writable.
A gdb.Symtab object has the following methods:
- Function: Symtab.is_valid ()
-
Returns
Trueif thegdb.Symtabobject is valid,
Falseif not. Agdb.Symtabobject can become invalid if
the symbol table it refers to does not exist in GDB any
longer. All othergdb.Symtabmethods will throw an exception
if it is invalid at the time the method is called.
- Function: Symtab.fullname ()
-
Return the symbol table’s source absolute file name.
- Function: Symtab.global_block ()
-
Return the global block of the underlying symbol table.
See Blocks In Python.
- Function: Symtab.static_block ()
-
Return the static block of the underlying symbol table.
See Blocks In Python.
- Function: Symtab.linetable ()
-
Return the line table associated with the symbol table.
See Line Tables In Python.
23.3.2.30 Manipulating line tables using Python
Python code can request and inspect line table information from a
symbol table that is loaded in GDB. A line table is a
mapping of source lines to their executable locations in memory. To
acquire the line table information for a particular symbol table, use
the linetable function (see Symbol Tables In Python).
A gdb.LineTable is iterable. The iterator returns
LineTableEntry objects that correspond to the source line and
address for each line table entry. LineTableEntry objects have
the following attributes:
- Variable: LineTableEntry.line
-
The source line number for this line table entry. This number
corresponds to the actual line of source. This attribute is not
writable.
- Variable: LineTableEntry.pc
-
The address that is associated with the line table entry where the
executable code for that source line resides in memory. This
attribute is not writable.
As there can be multiple addresses for a single source line, you may
receive multiple LineTableEntry objects with matching
line attributes, but with different pc attributes. The
iterator is sorted in ascending pc order. Here is a small
example illustrating iterating over a line table.
symtab = gdb.selected_frame().find_sal().symtab
linetable = symtab.linetable()
for line in linetable:
print ("Line: "+str(line.line)+" Address: "+hex(line.pc))
This will have the following output:
Line: 33 Address: 0x4005c8L Line: 37 Address: 0x4005caL Line: 39 Address: 0x4005d2L Line: 40 Address: 0x4005f8L Line: 42 Address: 0x4005ffL Line: 44 Address: 0x400608L Line: 42 Address: 0x40060cL Line: 45 Address: 0x400615L
In addition to being able to iterate over a LineTable, it also
has the following direct access methods:
- Function: LineTable.line (line)
-
Return a Python
TupleofLineTableEntryobjects for any
entries in the line table for the given line, which specifies
the source code line. If there are no entries for that source code
line, the PythonNoneis returned.
- Function: LineTable.has_line (line)
-
Return a Python
Booleanindicating whether there is an entry in
the line table for this source line. ReturnTrueif an entry
is found, orFalseif not.
- Function: LineTable.source_lines ()
-
Return a Python
Listof the source line numbers in the symbol
table. Only lines with executable code locations are returned. The
contents of theListwill just be the source line entries
represented as PythonLongvalues.
23.3.2.31 Manipulating breakpoints using Python
Python code can manipulate breakpoints via the gdb.Breakpoint
class.
A breakpoint can be created using one of the two forms of the
gdb.Breakpoint constructor. The first one accepts a string
like one would pass to the break
(see Setting Breakpoints) and watch
(see Setting Watchpoints) commands, and can be used to
create both breakpoints and watchpoints. The second accepts separate Python
arguments similar to Explicit Locations, and can only be used to create
breakpoints.
- Function: Breakpoint.__init__ (spec [, type ][, wp_class ][, internal ][, temporary ][, qualified ])
-
Create a new breakpoint according to spec, which is a string naming the
location of a breakpoint, or an expression that defines a watchpoint. The
string should describe a location in a format recognized by thebreak
command (see Setting Breakpoints) or, in the case of a
watchpoint, by thewatchcommand
(see Setting Watchpoints).The optional type argument specifies the type of the breakpoint to create,
as defined below.The optional wp_class argument defines the class of watchpoint to create,
if type isgdb.BP_WATCHPOINT. If wp_class is omitted, it
defaults togdb.WP_WRITE.The optional internal argument allows the breakpoint to become invisible
to the user. The breakpoint will neither be reported when created, nor will it
be listed in the output frominfo breakpoints(but will be listed with
themaint info breakpointscommand).The optional temporary argument makes the breakpoint a temporary
breakpoint. Temporary breakpoints are deleted after they have been hit. Any
further access to the Python breakpoint after it has been hit will result in a
runtime error (as that breakpoint has now been automatically deleted).The optional qualified argument is a boolean that allows interpreting
the function passed inspecas a fully-qualified name. It is equivalent
tobreak’s-qualifiedflag (see Linespec Locations and
Explicit Locations).
- Function: Breakpoint.__init__ ([ source ][, function ][, label ][, line ], ][ internal ][, temporary ][, qualified ])
-
This second form of creating a new breakpoint specifies the explicit
location (see Explicit Locations) using keywords. The new breakpoint will
be created in the specified source file source, at the specified
function, label and line.internal, temporary and qualified have the same usage as
explained previously.
The available types are represented by constants defined in the gdb
module:
gdb.BP_BREAKPOINT-
Normal code breakpoint.
gdb.BP_HARDWARE_BREAKPOINT-
Hardware assisted code breakpoint.
gdb.BP_WATCHPOINT-
Watchpoint breakpoint.
gdb.BP_HARDWARE_WATCHPOINT-
Hardware assisted watchpoint.
gdb.BP_READ_WATCHPOINT-
Hardware assisted read watchpoint.
gdb.BP_ACCESS_WATCHPOINT-
Hardware assisted access watchpoint.
gdb.BP_CATCHPOINT-
Catchpoint. Currently, this type can’t be used when creating
gdb.Breakpointobjects, but will be present in
gdb.Breakpointobjects reported from
gdb.BreakpointEvents (see Events In Python).
The available watchpoint types are represented by constants defined in the
gdb module:
gdb.WP_READ-
Read only watchpoint.
gdb.WP_WRITE-
Write only watchpoint.
gdb.WP_ACCESS-
Read/Write watchpoint.
- Function: Breakpoint.stop (self)
-
The
gdb.Breakpointclass can be sub-classed and, in
particular, you may choose to implement thestopmethod.
If this method is defined in a sub-class ofgdb.Breakpoint,
it will be called when the inferior reaches any location of a
breakpoint which instantiates that sub-class. If the method returns
True, the inferior will be stopped at the location of the
breakpoint, otherwise the inferior will continue.If there are multiple breakpoints at the same location with a
stopmethod, each one will be called regardless of the
return status of the previous. This ensures that allstop
methods have a chance to execute at that location. In this scenario
if one of the methods returnsTruebut the others return
False, the inferior will still be stopped.You should not alter the execution state of the inferior (i.e., step,
next, etc.), alter the current frame context (i.e., change the current
active frame), or alter, add or delete any breakpoint. As a general
rule, you should not alter any data within GDB or the inferior
at this time.Example
stopimplementation:class MyBreakpoint (gdb.Breakpoint): def stop (self): inf_val = gdb.parse_and_eval("foo") if inf_val == 3: return True return False
- Function: Breakpoint.is_valid ()
-
Return
Trueif thisBreakpointobject is valid,
Falseotherwise. ABreakpointobject can become invalid
if the user deletes the breakpoint. In this case, the object still
exists, but the underlying breakpoint does not. In the cases of
watchpoint scope, the watchpoint remains valid even if execution of the
inferior leaves the scope of that watchpoint.
- Function: Breakpoint.delete ()
-
Permanently deletes the GDB breakpoint. This also
invalidates the PythonBreakpointobject. Any further access
to this object’s attributes or methods will raise an error.
- Variable: Breakpoint.enabled
-
This attribute is
Trueif the breakpoint is enabled, and
Falseotherwise. This attribute is writable. You can use it to enable
or disable the breakpoint.
- Variable: Breakpoint.silent
-
This attribute is
Trueif the breakpoint is silent, and
Falseotherwise. This attribute is writable.Note that a breakpoint can also be silent if it has commands and the
first command issilent. This is not reported by the
silentattribute.
- Variable: Breakpoint.pending
-
This attribute is
Trueif the breakpoint is pending, and
Falseotherwise. See Set Breaks. This attribute is
read-only.
- Variable: Breakpoint.thread
-
If the breakpoint is thread-specific, this attribute holds the
thread’s global id. If the breakpoint is not thread-specific, this
attribute isNone. This attribute is writable.
- Variable: Breakpoint.task
-
If the breakpoint is Ada task-specific, this attribute holds the Ada task
id. If the breakpoint is not task-specific (or the underlying
language is not Ada), this attribute isNone. This attribute
is writable.
- Variable: Breakpoint.ignore_count
-
This attribute holds the ignore count for the breakpoint, an integer.
This attribute is writable.
- Variable: Breakpoint.number
-
This attribute holds the breakpoint’s number — the identifier used by
the user to manipulate the breakpoint. This attribute is not writable.
- Variable: Breakpoint.type
-
This attribute holds the breakpoint’s type — the identifier used to
determine the actual breakpoint type or use-case. This attribute is not
writable.
- Variable: Breakpoint.visible
-
This attribute tells whether the breakpoint is visible to the user
when set, or when the ‘info breakpoints’ command is run. This
attribute is not writable.
- Variable: Breakpoint.temporary
-
This attribute indicates whether the breakpoint was created as a
temporary breakpoint. Temporary breakpoints are automatically deleted
after that breakpoint has been hit. Access to this attribute, and all
other attributes and functions other than theis_valid
function, will result in an error after the breakpoint has been hit
(as it has been automatically deleted). This attribute is not
writable.
- Variable: Breakpoint.hit_count
-
This attribute holds the hit count for the breakpoint, an integer.
This attribute is writable, but currently it can only be set to zero.
- Variable: Breakpoint.location
-
This attribute holds the location of the breakpoint, as specified by
the user. It is a string. If the breakpoint does not have a location
(that is, it is a watchpoint) the attribute’s value isNone. This
attribute is not writable.
- Variable: Breakpoint.locations
-
Get the most current list of breakpoint locations that are inserted for this
breakpoint, with elements of typegdb.BreakpointLocation
(described below). This functionality matches that of the
info breakpointcommand (see Set Breaks), in that it only retrieves
the most current list of locations, thus the list itself when returned is
not updated behind the scenes. This attribute is not writable.
- Variable: Breakpoint.expression
-
This attribute holds a breakpoint expression, as specified by
the user. It is a string. If the breakpoint does not have an
expression (the breakpoint is not a watchpoint) the attribute’s value
isNone. This attribute is not writable.
- Variable: Breakpoint.condition
-
This attribute holds the condition of the breakpoint, as specified by
the user. It is a string. If there is no condition, this attribute’s
value isNone. This attribute is writable.
- Variable: Breakpoint.commands
-
This attribute holds the commands attached to the breakpoint. If
there are commands, this attribute’s value is a string holding all the
commands, separated by newlines. If there are no commands, this
attribute isNone. This attribute is writable.
Breakpoint Locations
A breakpoint location is one of the actual places where a breakpoint has been
set, represented in the Python API by the gdb.BreakpointLocation
type. This type is never instantiated by the user directly, but is retrieved
from Breakpoint.locations which returns a list of breakpoint
locations where it is currently set. Breakpoint locations can become
invalid if new symbol files are loaded or dynamically loaded libraries are
closed. Accessing the attributes of an invalidated breakpoint location will
throw a RuntimeError exception. Access the Breakpoint.locations
attribute again to retrieve the new and valid breakpoints location list.
- Variable: BreakpointLocation.source
-
This attribute returns the source file path and line number where this location
was set. The type of the attribute is a tuple of string and
long. If the breakpoint location doesn’t have a source location,
it returns None, which is the case for watchpoints and catchpoints.
This will throw aRuntimeErrorexception if the location
has been invalidated. This attribute is not writable.
- Variable: BreakpointLocation.address
-
This attribute returns the address where this location was set.
This attribute is of type long. This will throw aRuntimeError
exception if the location has been invalidated. This attribute is
not writable.
- Variable: BreakpointLocation.enabled
-
This attribute holds the value for whether or not this location is enabled.
This attribute is writable (boolean). This will throw aRuntimeError
exception if the location has been invalidated.
- Variable: BreakpointLocation.owner
-
This attribute holds a reference to the
gdb.Breakpointowner object,
from which thisgdb.BreakpointLocationwas retrieved from.
This will throw aRuntimeErrorexception if the location has been
invalidated. This attribute is not writable.
- Variable: BreakpointLocation.function
-
This attribute gets the name of the function where this location was set.
If no function could be found this attribute returnsNone.
This will throw aRuntimeErrorexception if the location has
been invalidated. This attribute is not writable.
- Variable: BreakpointLocation.fullname
-
This attribute gets the full name of where this location was set. If no
full name could be found, this attribute returnsNone.
This will throw aRuntimeErrorexception if the location has
been invalidated. This attribute is not writable.
- Variable: BreakpointLocation.thread_groups
-
This attribute gets the thread groups it was set in. It returns a
List
of the thread group ID’s. This will throw aRuntimeError
exception if the location has been invalidated. This attribute
is not writable.
23.3.2.32 Finish Breakpoints
A finish breakpoint is a temporary breakpoint set at the return address of
a frame, based on the finish command. gdb.FinishBreakpoint
extends gdb.Breakpoint. The underlying breakpoint will be disabled
and deleted when the execution will run out of the breakpoint scope (i.e.
Breakpoint.stop or FinishBreakpoint.out_of_scope triggered).
Finish breakpoints are thread specific and must be create with the right
thread selected.
- Function: FinishBreakpoint.__init__ ([frame] [, internal])
-
Create a finish breakpoint at the return address of the
gdb.Frame
object frame. If frame is not provided, this defaults to the
newest frame. The optional internal argument allows the breakpoint to
become invisible to the user. See Breakpoints In Python, for further
details about this argument.
- Function: FinishBreakpoint.out_of_scope (self)
-
In some circumstances (e.g.
longjmp, C++ exceptions, GDB
returncommand, …), a function may not properly terminate, and
thus never hit the finish breakpoint. When GDB notices such a
situation, theout_of_scopecallback will be triggered.You may want to sub-class
gdb.FinishBreakpointand override this
method:class MyFinishBreakpoint (gdb.FinishBreakpoint) def stop (self): print ("normal finish") return True def out_of_scope (): print ("abnormal finish")
- Variable: FinishBreakpoint.return_value
-
When GDB is stopped at a finish breakpoint and the frame
used to build thegdb.FinishBreakpointobject had debug symbols, this
attribute will contain agdb.Valueobject corresponding to the return
value of the function. The value will beNoneif the function return
type isvoidor if the return value was not computable. This attribute
is not writable.
23.3.2.33 Python representation of lazy strings
A lazy string is a string whose contents is not retrieved or
encoded until it is needed.
A gdb.LazyString is represented in GDB as an
address that points to a region of memory, an encoding
that will be used to encode that region of memory, and a length
to delimit the region of memory that represents the string. The
difference between a gdb.LazyString and a string wrapped within
a gdb.Value is that a gdb.LazyString will be treated
differently by GDB when printing. A gdb.LazyString is
retrieved and encoded during printing, while a gdb.Value
wrapping a string is immediately retrieved and encoded on creation.
A gdb.LazyString object has the following functions:
- Function: LazyString.value ()
-
Convert the
gdb.LazyStringto agdb.Value. This value
will point to the string in memory, but will lose all the delayed
retrieval, encoding and handling that GDB applies to a
gdb.LazyString.
- Variable: LazyString.address
-
This attribute holds the address of the string. This attribute is not
writable.
- Variable: LazyString.length
-
This attribute holds the length of the string in characters. If the
length is -1, then the string will be fetched and encoded up to the
first null of appropriate width. This attribute is not writable.
- Variable: LazyString.encoding
-
This attribute holds the encoding that will be applied to the string
when the string is printed by GDB. If the encoding is not
set, or contains an empty string, then GDB will select the
most appropriate encoding when the string is printed. This attribute
is not writable.
- Variable: LazyString.type
-
This attribute holds the type that is represented by the lazy string’s
type. For a lazy string this is a pointer or array type. To
resolve this to the lazy string’s character type, use the type’s
targetmethod. See Types In Python. This attribute is not
writable.
23.3.2.34 Python representation of architectures
GDB uses architecture specific parameters and artifacts in a
number of its various computations. An architecture is represented
by an instance of the gdb.Architecture class.
A gdb.Architecture class has the following methods:
- Function: Architecture.name ()
-
Return the name (string value) of the architecture.
- Function: Architecture.disassemble (start_pc [, end_pc [, count]])
-
Return a list of disassembled instructions starting from the memory
address start_pc. The optional arguments end_pc and
count determine the number of instructions in the returned list.
If both the optional arguments end_pc and count are
specified, then a list of at most count disassembled instructions
whose start address falls in the closed memory address interval from
start_pc to end_pc are returned. If end_pc is not
specified, but count is specified, then count number of
instructions starting from the address start_pc are returned. If
count is not specified but end_pc is specified, then all
instructions whose start address falls in the closed memory address
interval from start_pc to end_pc are returned. If neither
end_pc nor count are specified, then a single instruction at
start_pc is returned. For all of these cases, each element of the
returned list is a Pythondictwith the following string keys:addr-
The value corresponding to this key is a Python long integer capturing
the memory address of the instruction. asm-
The value corresponding to this key is a string value which represents
the instruction with assembly language mnemonics. The assembly
language flavor used is the same as that specified by the current CLI
variabledisassembly-flavor. See Machine Code. length-
The value corresponding to this key is the length (integer value) of the
instruction in bytes.
- Function: Architecture.integer_type (size [, signed])
-
This function looks up an integer type by its size, and
optionally whether or not it is signed.size is the size, in bits, of the desired integer type. Only
certain sizes are currently supported: 0, 8, 16, 24, 32, 64, and 128.If signed is not specified, it defaults to
True. If
signed isFalse, the returned type will be unsigned.If the indicated type cannot be found, this function will throw a
ValueErrorexception.
- Function: Architecture.registers ([ reggroup ])
-
Return a
gdb.RegisterDescriptorIterator(see Registers In Python) for all of the registers in reggroup, a string that is
the name of a register group. If reggroup is omitted, or is the
empty string, then the register group ‘all’ is assumed.
- Function: Architecture.register_groups ()
-
Return a
gdb.RegisterGroupsIterator(see Registers In Python) for all of the register groups available for the
gdb.Architecture.
23.3.2.35 Registers In Python
Python code can request from a gdb.Architecture information
about the set of registers available
(see Architecture.registers).
The register information is returned as a
gdb.RegisterDescriptorIterator, which is an iterator that in
turn returns gdb.RegisterDescriptor objects.
A gdb.RegisterDescriptor does not provide the value of a
register (see Frame.read_register
for reading a register’s value), instead the RegisterDescriptor
is a way to discover which registers are available for a particular
architecture.
A gdb.RegisterDescriptor has the following read-only properties:
- Variable: RegisterDescriptor.name
-
The name of this register.
It is also possible to lookup a register descriptor based on its name
using the following gdb.RegisterDescriptorIterator function:
- Function: RegisterDescriptorIterator.find (name)
-
Takes name as an argument, which must be a string, and returns a
gdb.RegisterDescriptorfor the register with that name, or
Noneif there is no register with that name.
Python code can also request from a gdb.Architecture
information about the set of register groups available on a given
architecture
(see Architecture.register_groups).
Every register can be a member of zero or more register groups. Some
register groups are used internally within GDB to control
things like which registers must be saved when calling into the
program being debugged (see Calling Program Functions).
Other register groups exist to allow users to easily see related sets
of registers in commands like info registers
(see info registers).
reggroup
The register groups information is returned as a
gdb.RegisterGroupsIterator, which is an iterator that in turn
returns gdb.RegisterGroup objects.
A gdb.RegisterGroup object has the following read-only
properties:
- Variable: RegisterGroup.name
-
A string that is the name of this register group.
23.3.2.36 Connections In Python
GDB lets you run and debug multiple programs in a single
session. Each program being debugged has a connection, the connection
describes how GDB controls the program being debugged.
Examples of different connection types are ‘native’ and
‘remote’. See Inferiors Connections and Programs.
Connections in GDB are represented as instances of
gdb.TargetConnection, or as one of its sub-classes. To get a
list of all connections use gdb.connections
(see gdb.connections).
To get the connection for a single gdb.Inferior read its
gdb.Inferior.connection attribute
(see gdb.Inferior.connection).
Currently there is only a single sub-class of
gdb.TargetConnection, gdb.RemoteTargetConnection,
however, additional sub-classes may be added in future releases of
GDB. As a result you should avoid writing code like:
conn = gdb.selected_inferior().connection
if type(conn) is gdb.RemoteTargetConnection:
print("This is a remote target connection")
as this may fail when more connection types are added. Instead, you
should write:
conn = gdb.selected_inferior().connection
if isinstance(conn, gdb.RemoteTargetConnection):
print("This is a remote target connection")
A gdb.TargetConnection has the following method:
- Function: TargetConnection.is_valid ()
-
Return
Trueif thegdb.TargetConnectionobject is valid,
Falseif not. Agdb.TargetConnectionwill become
invalid if the connection no longer exists within GDB, this
might happen when no inferiors are using the connection, but could be
delayed until the user replaces the current target.Reading any of the
gdb.TargetConnectionproperties will throw
an exception if the connection is invalid.
A gdb.TargetConnection has the following read-only properties:
- Variable: TargetConnection.num
-
An integer assigned by GDB to uniquely identify this
connection. This is the same value as displayed in the ‘Num’
column of theinfo connectionscommand output (see info connections).
- Variable: TargetConnection.type
-
A string that describes what type of connection this is. This string
will be one of the valid names that can be passed to thetarget
command (see target command).
- Variable: TargetConnection.description
-
A string that gives a short description of this target type. This is
the same string that is displayed in the ‘Description’ column of
theinfo connectioncommand output (see info connections).
- Variable: TargetConnection.details
-
An optional string that gives additional information about this
connection. This attribute can beNoneif there are no
additional details for this connection.An example of a connection type that might have additional details is
the ‘remote’ connection, in this case the details string can
contain the ‘hostname:port’ that was used to connect
to the remote target.
The gdb.RemoteTargetConnection class is a sub-class of
gdb.TargetConnection, and is used to represent ‘remote’
and ‘extended-remote’ connections. In addition to the attributes
and methods available from the gdb.TargetConnection base class,
a gdb.RemoteTargetConnection has the following method:
- Function: RemoteTargetConnection.send_packet (packet)
-
This method sends packet to the remote target and returns the
response. The packet should either be abytesobject, or
aUnicodestring.If packet is a
Unicodestring, then the string is encoded
to abytesobject using the ASCII codec. If the string
can’t be encoded then anUnicodeErroris raised.If packet is not a
bytesobject, or aUnicode
string, then aTypeErroris raised. If packet is empty
then aValueErroris raised.The response is returned as a
bytesobject. For Python 3 if it
is known that the response can be represented as a string then this
can be decoded from the buffer. For example, if it is known that the
response is an ASCII string:remote_connection.send_packet("some_packet").decode("ascii")In Python 2
bytesandstrare aliases, so the result is
already a string, if the response includes non-printable characters,
or null characters, then these will be present in the result, care
should be taken when processing the result to handle this case.The prefix, suffix, and checksum (as required by the remote serial
protocol) are automatically added to the outgoing packet, and removed
from the incoming packet before the contents of the reply are
returned.This is equivalent to the
maintenance packetcommand
(see maint packet).
23.3.2.37 Implementing new TUI windows
New TUI (see TUI) windows can be implemented in Python.
- Function: gdb.register_window_type (name, factory)
-
Because TUI windows are created and destroyed depending on the layout
the user chooses, new window types are implemented by registering a
factory function with GDB.name is the name of the new window. It’s an error to try to
replace one of the built-in windows, but other window types can be
replaced. The name should match the regular expression
[a-zA-Z][-_.a-zA-Z0-9]*, it is an error to try and create a
window with an invalid name.function is a factory function that is called to create the TUI
window. This is called with a single argument of type
gdb.TuiWindow, described below. It should return an object
that implements the TUI window protocol, also described below.
As mentioned above, when a factory function is called, it is passed
an object of type gdb.TuiWindow. This object has these
methods and attributes:
- Function: TuiWindow.is_valid ()
-
This method returns
Truewhen this window is valid. When the
user changes the TUI layout, windows no longer visible in the new
layout will be destroyed. At this point, thegdb.TuiWindow
will no longer be valid, and methods (and attributes) other than
is_validwill throw an exception.When the TUI is disabled using
tui disable(see tui disable) the window is hidden rather than destroyed,
butis_validwill still returnFalseand other methods
(and attributes) will still throw an exception.
- Variable: TuiWindow.width
-
This attribute holds the width of the window. It is not writable.
- Variable: TuiWindow.height
-
This attribute holds the height of the window. It is not writable.
- Variable: TuiWindow.title
-
This attribute holds the window’s title, a string. This is normally
displayed above the window. This attribute can be modified.
- Function: TuiWindow.erase ()
-
Remove all the contents of the window.
- Function: TuiWindow.write (string [, full_window])
-
Write string to the window. string can contain ANSI
terminal escape styling sequences; GDB will translate these
as appropriate for the terminal.If the full_window parameter is
True, then string
contains the full contents of the window. This is similar to calling
erasebeforewrite, but avoids the flickering.
The factory function that you supply should return an object
conforming to the TUI window protocol. These are the method that can
be called on this object, which is referred to below as the “window
object”. The methods documented below are optional; if the object
does not implement one of these methods, GDB will not attempt
to call it. Additional new methods may be added to the window
protocol in the future. GDB guarantees that they will begin
with a lower-case letter, so you can start implementation methods with
upper-case letters or underscore to avoid any future conflicts.
- Function: Window.close ()
-
When the TUI window is closed, the
gdb.TuiWindowobject will be
put into an invalid state. At this time, GDB will call
closemethod on the window object.After this method is called, GDB will discard any references
it holds on this window object, and will no longer call methods on
this object.
- Function: Window.render ()
-
In some situations, a TUI window can change size. For example, this
can happen if the user resizes the terminal, or changes the layout.
When this happens, GDB will call therendermethod on
the window object.If your window is intended to update in response to changes in the
inferior, you will probably also want to register event listeners and
send output to thegdb.TuiWindow.
- Function: Window.hscroll (num)
-
This is a request to scroll the window horizontally. num is the
amount by which to scroll, with negative numbers meaning to scroll
right. In the TUI model, it is the viewport that moves, not the
contents. A positive argument should cause the viewport to move
right, and so the content should appear to move to the left.
- Function: Window.vscroll (num)
-
This is a request to scroll the window vertically. num is the
amount by which to scroll, with negative numbers meaning to scroll
backward. In the TUI model, it is the viewport that moves, not the
contents. A positive argument should cause the viewport to move down,
and so the content should appear to move up.
- Function: Window.click (x, y, button)
-
This is called on a mouse click in this window. x and y are
the mouse coordinates inside the window (0-based, from the top left
corner), and button specifies which mouse button was used, whose
values can be 1 (left), 2 (middle), or 3 (right).
23.3.2.38 Instruction Disassembly In Python
GDB’s builtin disassembler can be extended, or even replaced,
using the Python API. The disassembler related features are contained
within the gdb.disassembler module:
- class: gdb.disassembler.DisassembleInfo
-
Disassembly is driven by instances of this class. Each time
GDB needs to disassemble an instruction, an instance of this
class is created and passed to a registered disassembler. The
disassembler is then responsible for disassembling an instruction and
returning a result.Instances of this type are usually created within GDB,
however, it is possible to create a copy of an instance of this type,
see the description of__init__for more details.This class has the following properties and methods:
- Variable: DisassembleInfo.address
-
A read-only integer containing the address at which GDB
wishes to disassemble a single instruction.
- Variable: DisassembleInfo.architecture
-
The
gdb.Architecture(see Architectures In Python) for
which GDB is currently disassembling, this property is
read-only.
- Variable: DisassembleInfo.progspace
-
The
gdb.Progspace(see Program Spaces
In Python) for which GDB is currently disassembling, this
property is read-only.
- Function: DisassembleInfo.is_valid ()
-
Returns
Trueif theDisassembleInfoobject is valid,
Falseif not. ADisassembleInfoobject will become
invalid once the disassembly call for which theDisassembleInfo
was created, has returned. Calling otherDisassembleInfo
methods, or accessingDisassembleInfoproperties, will raise a
RuntimeErrorexception if it is invalid.
- Function: DisassembleInfo.__init__ (info)
-
This can be used to create a new
DisassembleInfoobject that is
a copy of info. The copy will have the sameaddress,
architecture, andprogspacevalues as info, and
will become invalid at the same time as info.This method exists so that sub-classes of
DisassembleInfocan
be created, these sub-classes must be initialized as copies of an
existingDisassembleInfoobject, but sub-classes might choose
to override theread_memorymethod, and so control what
GDB sees when reading from memory
(see builtin_disassemble).
- Function: DisassembleInfo.read_memory (length, offset)
-
This method allows the disassembler to read the bytes of the
instruction to be disassembled. The method reads length bytes,
starting at offset from
DisassembleInfo.address.It is important that the disassembler read the instruction bytes using
this method, rather than reading inferior memory directly, as in some
cases GDB disassembles from an internal buffer rather than
directly from inferior memory, calling this method handles this
detail.Returns a buffer object, which behaves much like an array or a string,
just asInferior.read_memorydoes
(see Inferior.read_memory). The
length of the returned buffer will always be exactly length.If GDB is unable to read the required memory then a
gdb.MemoryErrorexception is raised (see Exception Handling).This method can be overridden by a sub-class in order to control what
GDB sees when reading from memory
(see builtin_disassemble). When overriding this method it is
important to understand howbuiltin_disassemblemakes use of
this method.While disassembling a single instruction there could be multiple calls
to this method, and the same bytes might be read multiple times. Any
single call might only read a subset of the total instruction bytes.If an implementation of
read_memoryis unable to read the
requested memory contents, for example, if there’s a request to read
from an invalid memory address, then agdb.MemoryErrorshould
be raised.Raising a
MemoryErrorinsideread_memorydoes not
automatically mean aMemoryErrorwill be raised by
builtin_disassemble. It is possible the GDB’s builtin
disassembler is probing to see how many bytes are available. When
read_memoryraises theMemoryErrorthe builtin
disassembler might be able to perform a complete disassembly with the
bytes it has available, in this casebuiltin_disassemblewill
not itself raise aMemoryError.Any other exception type raised in
read_memorywill propagate
back and be re-raised bybuiltin_disassemble.
- class: Disassembler
-
This is a base class from which all user implemented disassemblers
must inherit.- Function: Disassembler.__init__ (name)
-
The constructor takes name, a string, which should be a short
name for this disassembler.
- Function: Disassembler.__call__ (info)
-
The
__call__method must be overridden by sub-classes to
perform disassembly. Calling__call__on this base class will
raise aNotImplementedErrorexception.The info argument is an instance of
DisassembleInfo, and
describes the instruction that GDB wants disassembling.If this function returns
None, this indicates to GDB
that this sub-class doesn’t wish to disassemble the requested
instruction. GDB will then use its builtin disassembler to
perform the disassembly.Alternatively, this function can return a
DisassemblerResult
that represents the disassembled instruction, this type is described
in more detail below.The
__call__method can raise agdb.MemoryError
exception (see Exception Handling) to indicate to GDB
that there was a problem accessing the required memory, this will then
be displayed by GDB within the disassembler output.Ideally, the only three outcomes from invoking
__call__would
be a return ofNone, a successful disassembly returned in a
DisassemblerResult, or aMemoryErrorindicating that
there was a problem reading memory.However, as an implementation of
__call__could fail due to
other reasons, e.g. some external resource required to perform
disassembly is temporarily unavailable, then, if__call__
raises aGdbError, the exception will be converted to a string
and printed at the end of the disassembly output, the disassembly
request will then stop.Any other exception type raised by the
__call__method is
considered an error in the user code, the exception will be printed to
the error stream according to the set python print-stack setting
(see set python print-stack).
- class: DisassemblerResult
-
This class is used to hold the result of calling
Disassembler.__call__, and represents a single disassembled
instruction. This class has the following properties and methods:- Function: DisassemblerResult.__init__ (length, string)
-
Initialize an instance of this class, length is the length of
the disassembled instruction in bytes, which must be greater than
zero, and string is a non-empty string that represents the
disassembled instruction.
- Variable: DisassemblerResult.length
-
A read-only property containing the length of the disassembled
instruction in bytes, this will always be greater than zero.
- Variable: DisassemblerResult.string
-
A read-only property containing a non-empty string representing the
disassembled instruction.
The following functions are also contained in the
gdb.disassembler module:
- Function: register_disassembler (disassembler, architecture)
-
The disassembler must be a sub-class of
gdb.disassembler.DisassemblerorNone.The optional architecture is either a string, or the value
None. If it is a string, then it should be the name of an
architecture known to GDB, as returned either from
gdb.Architecture.name
(see gdb.Architecture.name), or from
gdb.architecture_names
(see gdb.architecture_names).The disassembler will be installed for the architecture named by
architecture, or if architecture isNone, then
disassembler will be installed as a global disassembler for use
by all architectures.GDB only records a single disassembler for each architecture,
and a single global disassembler. Calling
register_disassemblerfor an architecture, or for the global
disassembler, will replace any existing disassembler registered for
that architecture value. The previous disassembler is returned.If disassembler is
Nonethen any disassembler currently
registered for architecture is deregistered and returned.When GDB is looking for a disassembler to use, GDB
first looks for an architecture specific disassembler. If none has
been registered then GDB looks for a global disassembler (one
registered with architecture set toNone). Only one
disassembler is called to perform disassembly, so, if there is both an
architecture specific disassembler, and a global disassembler
registered, it is the architecture specific disassembler that will be
used.GDB tracks the architecture specific, and global
disassemblers separately, so it doesn’t matter in which order
disassemblers are created or registered; an architecture specific
disassembler, if present, will always be used in preference to a
global disassembler.You can use the maint info python-disassemblers command
(see maint info python-disassemblers) to see which disassemblers
have been registered.
- Function: builtin_disassemble (info)
-
This function calls back into GDB’s builtin disassembler to
disassemble the instruction identified by info, an instance, or
sub-class, ofDisassembleInfo.When the builtin disassembler needs to read memory the
read_memorymethod on info will be called. By
sub-classingDisassembleInfoand overriding the
read_memorymethod, it is possible to intercept calls to
read_memoryfrom the builtin disassembler, and to modify the
values returned.It is important to understand that, even when
DisassembleInfo.read_memoryraises agdb.MemoryError, it
is the internal disassembler itself that reports the memory error to
GDB. The reason for this is that the disassembler might
probe memory to see if a byte is readable or not; if the byte can’t be
read then the disassembler may choose not to report an error, but
instead to disassemble the bytes that it does have available.If the builtin disassembler is successful then an instance of
DisassemblerResultis returned frombuiltin_disassemble,
alternatively, if something goes wrong, an exception will be raised.A
MemoryErrorwill be raised ifbuiltin_disassembleis
unable to read some memory that is required in order to perform
disassembly correctly.Any exception that is not a
MemoryError, that is raised in a
call toread_memory, will pass through
builtin_disassemble, and be visible to the caller.Finally, there are a few cases where GDB’s builtin
disassembler can fail for reasons that are not covered by
MemoryError. In these cases, aGdbErrorwill be raised.
The contents of the exception will be a string describing the problem
the disassembler encountered.
Here is an example that registers a global disassembler. The new
disassembler invokes the builtin disassembler, and then adds a
comment, ## Comment, to each line of disassembly output:
class ExampleDisassembler(gdb.disassembler.Disassembler):
def __init__(self):
super().__init__("ExampleDisassembler")
def __call__(self, info):
result = gdb.disassembler.builtin_disassemble(info)
length = result.length
text = result.string + "t## Comment"
return gdb.disassembler.DisassemblerResult(length, text)
gdb.disassembler.register_disassembler(ExampleDisassembler())
The following example creates a sub-class of DisassembleInfo in
order to intercept the read_memory calls, within
read_memory any bytes read from memory have the two 4-bit
nibbles swapped around. This isn’t a very useful adjustment, but
serves as an example.
class MyInfo(gdb.disassembler.DisassembleInfo):
def __init__(self, info):
super().__init__(info)
def read_memory(self, length, offset):
buffer = super().read_memory(length, offset)
result = bytearray()
for b in buffer:
v = int.from_bytes(b, 'little')
v = (v << 4) & 0xf0 | (v >> 4)
result.append(v)
return memoryview(result)
class NibbleSwapDisassembler(gdb.disassembler.Disassembler):
def __init__(self):
super().__init__("NibbleSwapDisassembler")
def __call__(self, info):
info = MyInfo(info)
return gdb.disassembler.builtin_disassemble(info)
gdb.disassembler.register_disassembler(NibbleSwapDisassembler())
23.3.3 Python Auto-loading
When a new object file is read (for example, due to the file
command, or because the inferior has loaded a shared library),
GDB will look for Python support scripts in several ways:
objfile-gdb.py and .debug_gdb_scripts section.
See Auto-loading extensions.
The auto-loading feature is useful for supplying application-specific
debugging commands and scripts.
Auto-loading can be enabled or disabled,
and the list of auto-loaded scripts can be printed.
set auto-load python-scripts [on|off]-
Enable or disable the auto-loading of Python scripts.
show auto-load python-scripts-
Show whether auto-loading of Python scripts is enabled or disabled.
info auto-load python-scripts [regexp]-
Print the list of all Python scripts that GDB auto-loaded.
Also printed is the list of Python scripts that were mentioned in
the.debug_gdb_scriptssection and were either not found
(see dotdebug_gdb_scripts section) or were not auto-loaded due to
auto-load safe-pathrejection (see Auto-loading).
This is useful because their names are not printed when GDB
tries to load them and fails. There may be many of them, and printing
an error message for each one is problematic.If regexp is supplied only Python scripts with matching names are printed.
Example:
(gdb) info auto-load python-scripts Loaded Script Yes py-section-script.py full name: /tmp/py-section-script.py No my-foo-pretty-printers.py
When reading an auto-loaded file or script, GDB sets the
current objfile. This is available via the gdb.current_objfile
function (see Objfiles In Python). This can be useful for
registering objfile-specific pretty-printers and frame-filters.
23.3.4 Python modules
GDB comes with several modules to assist writing Python code.
23.3.4.1 gdb.printing
This module provides a collection of utilities for working with
pretty-printers.
PrettyPrinter (name, subprinters=None)-
This class specifies the API that makes ‘info pretty-printer’,
‘enable pretty-printer’ and ‘disable pretty-printer’ work.
Pretty-printers should generally inherit from this class. SubPrettyPrinter (name)-
For printers that handle multiple types, this class specifies the
corresponding API for the subprinters. RegexpCollectionPrettyPrinter (name)-
Utility class for handling multiple printers, all recognized via
regular expressions.
See Writing a Pretty-Printer, for an example. FlagEnumerationPrinter (name)-
A pretty-printer which handles printing of
enumvalues. Unlike
GDB’s built-inenumprinting, this printer attempts to
work properly when there is some overlap between the enumeration
constants. The argument name is the name of the printer and
also the name of theenumtype to look up. register_pretty_printer (obj, printer, replace=False)-
Register printer with the pretty-printer list of obj.
If replace isTruethen any existing copy of the printer
is replaced. Otherwise aRuntimeErrorexception is raised
if a printer with the same name already exists.
23.3.4.2 gdb.types
This module provides a collection of utilities for working with
gdb.Type objects.
get_basic_type (type)-
Return type with const and volatile qualifiers stripped,
and with typedefs and C++ references converted to the underlying type.C++ example:
typedef const int const_int; const_int foo (3); const_int& foo_ref (foo); int main () { return 0; }Then in gdb:
(gdb) start (gdb) python import gdb.types (gdb) python foo_ref = gdb.parse_and_eval("foo_ref") (gdb) python print gdb.types.get_basic_type(foo_ref.type) int has_field (type, field)-
Return
Trueif type, assumed to be a type with fields
(e.g., a structure or union), has field field. make_enum_dict (enum_type)-
Return a Python
dictionarytype produced from enum_type. deep_items (type)-
Returns a Python iterator similar to the standard
gdb.Type.iteritemsmethod, except that the iterator returned
bydeep_itemswill recursively traverse anonymous struct or
union fields. For example:struct A { int a; union { int b0; int b1; }; };Then in GDB:
(gdb) python import gdb.types (gdb) python struct_a = gdb.lookup_type("struct A") (gdb) python print struct_a.keys () {['a', '']} (gdb) python print [k for k,v in gdb.types.deep_items(struct_a)] {['a', 'b0', 'b1']} get_type_recognizers ()-
Return a list of the enabled type recognizers for the current context.
This is called by GDB during the type-printing process
(see Type Printing API). apply_type_recognizers (recognizers, type_obj)-
Apply the type recognizers, recognizers, to the type object
type_obj. If any recognizer returns a string, return that
string. Otherwise, returnNone. This is called by
GDB during the type-printing process (see Type Printing API). register_type_printer (locus, printer)-
This is a convenience function to register a type printer
printer. The printer must implement the type printer protocol.
The locus argument is either agdb.Objfile, in which case
the printer is registered with that objfile; agdb.Progspace,
in which case the printer is registered with that progspace; or
None, in which case the printer is registered globally. TypePrinter-
This is a base class that implements the type printer protocol. Type
printers are encouraged, but not required, to derive from this class.
It defines a constructor:- Method on TypePrinter: __init__ (self, name)
-
Initialize the type printer with the given name. The new printer
starts in the enabled state.
23.3.4.3 gdb.prompt
This module provides a method for prompt value-substitution.
substitute_prompt (string)-
Return string with escape sequences substituted by values. Some
escape sequences take arguments. You can specify arguments inside
“{}” immediately following the escape sequence.The escape sequences you can pass to this function are:
\-
Substitute a backslash.
e-
Substitute an ESC character.
f-
Substitute the selected frame; an argument names a frame parameter.
n-
Substitute a newline.
p-
Substitute a parameter’s value; the argument names the parameter.
r-
Substitute a carriage return.
t-
Substitute the selected thread; an argument names a thread parameter.
v-
Substitute the version of GDB.
w-
Substitute the current working directory.
[-
Begin a sequence of non-printing characters. These sequences are
typically used with the ESC character, and are not counted in the string
length. Example: “[e[0;34m](gdb)[e[0m]” will return a
blue-colored “(gdb)” prompt where the length is five. ]-
End a sequence of non-printing characters.
For example:
substitute_prompt ("frame: f, args: p{print frame-arguments}")will return the string:
"frame: main, args: scalars"
23.4 Extending GDB using Guile
You can extend GDB using the Guile implementation of the Scheme programming language.
This feature is available only if GDB was configured using
—with-guile.
23.4.1 Guile Introduction
Guile is an implementation of the Scheme programming language
and is the GNU project’s official extension language.
Guile support in GDB follows the Python support in GDB
reasonably closely, so concepts there should carry over.
However, some things are done differently where it makes sense.
GDB requires Guile version 3.0, 2.2, or 2.0.
Guile scripts used by GDB should be installed in
data-directory/guile, where data-directory is
the data directory as determined at GDB startup (see Data Files).
This directory, known as the guile directory,
is automatically added to the Guile Search Path in order to allow
the Guile interpreter to locate all scripts installed at this location.
23.4.2 Guile Commands
GDB provides two commands for accessing the Guile interpreter:
guile-replgr-
The
guile-replcommand can be used to start an interactive
Guile prompt or repl. To return to GDB,
type ,q or theEOFcharacter (e.g., Ctrl-D on
an empty prompt). These commands do not take any arguments. guile [scheme-expression]gu [scheme-expression]-
The
guilecommand can be used to evaluate a Scheme expression.If given an argument, GDB will pass the argument to the Guile
interpreter for evaluation.(gdb) guile (display (+ 20 3)) (newline) 23
The result of the Scheme expression is displayed using normal Guile rules.
If you do not provide an argument to
guile, it will act as a
multi-line command, likedefine. In this case, the Guile
script is made up of subsequent command lines, given after the
guilecommand. This command list is terminated using a line
containingend. For example:(gdb) guile >(display 23) >(newline) >end 23
It is also possible to execute a Guile script from the GDB
interpreter:
source script-name-
The script name must end with ‘.scm’ and GDB must be configured
to recognize the script language based on filename extension using
thescript-extensionsetting. See Extending GDB. guile (load "script-name")-
This method uses the
loadGuile function.
It takes a string argument that is the name of the script to load.
See the Guile documentation for a description of this function.
(see Loading in GNU Guile Reference Manual).
23.4.3 Guile API
You can get quick online help for GDB’s Guile API by issuing
the command help guile, or by issuing the command ,help
from an interactive Guile session. Furthermore, most Guile procedures
provided by GDB have doc strings which can be obtained with
,describe procedure-name or ,d procedure-name
from the Guile interactive prompt.
23.4.3.1 Basic Guile
At startup, GDB overrides Guile’s current-output-port and
current-error-port to print using GDB’s output-paging streams.
A Guile program which outputs to one of these streams may have its
output interrupted by the user (see Screen Size). In this
situation, a Guile signal exception is thrown with value SIGINT.
Guile’s history mechanism uses the same naming as GDB’s,
namely the user of dollar-variables (e.g., $1, $2, etc.).
The results of evaluations in Guile and in GDB are counted separately,
$1 in Guile is not the same value as $1 in GDB.
GDB is not thread-safe. If your Guile program uses multiple
threads, you must be careful to only call GDB-specific
functions in the GDB thread.
Some care must be taken when writing Guile code to run in
GDB. Two things are worth noting in particular:
- GDB installs handlers for
SIGCHLDandSIGINT.
Guile code must not override these, or even change the options using
sigaction. If your program changes the handling of these
signals, GDB will most likely stop working correctly. Note
that it is unfortunately common for GUI toolkits to install a
SIGCHLDhandler. - GDB takes care to mark its internal file descriptors as
close-on-exec. However, this cannot be done in a thread-safe way on
all platforms. Your Guile programs should be aware of this and
should both create new file descriptors with the close-on-exec flag
set and arrange to close unneeded file descriptors before starting a
child process.
GDB introduces a new Guile module, named gdb. All
methods and classes added by GDB are placed in this module.
GDB does not automatically import the gdb module,
scripts must do this themselves. There are various options for how to
import a module, so GDB leaves the choice of how the gdb
module is imported to the user.
To simplify interactive use, it is recommended to add one of the following
to your ~/.gdbinit.
guile (use-modules (gdb))
guile (use-modules ((gdb) #:renamer (symbol-prefix-proc 'gdb:)))
Which one to choose depends on your preference.
The second one adds gdb: as a prefix to all module functions
and variables.
The rest of this manual assumes the gdb module has been imported
without any prefix. See the Guile documentation for use-modules
for more information
(see Using Guile Modules in GNU Guile Reference Manual).
Example:
(gdb) guile (value-type (make-value 1)) ERROR: Unbound variable: value-type Error while executing Scheme code. (gdb) guile (use-modules (gdb)) (gdb) guile (value-type (make-value 1)) int (gdb)
The (gdb) module provides these basic Guile functions.
- Scheme Procedure: execute command [#:from-tty boolean] [#:to-string boolean]
-
Evaluate command, a string, as a GDB CLI command.
If a GDB exception happens while command runs, it is
translated as described in
Guile Exception Handling.from-tty specifies whether GDB ought to consider this
command as having originated from the user invoking it interactively.
It must be a boolean value. If omitted, it defaults to#f.By default, any output produced by command is sent to
GDB’s standard output (and to the log output if logging is
turned on). If the to-string parameter is
#t, then output will be collected byexecuteand
returned as a string. The default is#f, in which case the
return value is unspecified. If to-string is#t, the
GDB virtual terminal will be temporarily set to unlimited width
and height, and its pagination will be disabled; see Screen Size.
- Scheme Procedure: history-ref number
-
Return a value from GDB’s value history (see Value History). The number argument indicates which history element to return.
If number is negative, then GDB will take its absolute value
and count backward from the last element (i.e., the most recent element) to
find the value to return. If number is zero, then GDB will
return the most recent element. If the element specified by number
doesn’t exist in the value history, agdb:errorexception will be
raised.If no exception is raised, the return value is always an instance of
<gdb:value>(see Values From Inferior In Guile).Note: GDB’s value history is independent of Guile’s.
$1in GDB’s value history contains the result of evaluating
an expression from GDB’s command line and$1from Guile’s
history contains the result of evaluating an expression from Guile’s
command line.
- Scheme Procedure: history-append! value
-
Append value, an instance of
<gdb:value>, to GDB’s
value history. Return its index in the history.Putting into history values returned by Guile extensions will allow
the user convenient access to those values via CLI history
facilities.
- Scheme Procedure: parse-and-eval expression
-
Parse expression as an expression in the current language,
evaluate it, and return the result as a<gdb:value>.
The expression must be a string.This function can be useful when implementing a new command
(see Commands In Guile), as it provides a way to parse the
command’s arguments as an expression.
It is also is useful when computing values.
For example, it is the only way to get the value of a
convenience variable (see Convenience Vars) as a<gdb:value>.
23.4.3.2 Guile Configuration
GDB provides these Scheme functions to access various configuration
parameters.
- Scheme Procedure: data-directory
-
Return a string containing GDB’s data directory.
This directory contains GDB’s ancillary files.
- Scheme Procedure: guile-data-directory
-
Return a string containing GDB’s Guile data directory.
This directory contains the Guile modules provided by GDB.
- Scheme Procedure: gdb-version
-
Return a string containing the GDB version.
- Scheme Procedure: host-config
-
Return a string containing the host configuration.
This is the string passed to--hostwhen GDB was configured.
- Scheme Procedure: target-config
-
Return a string containing the target configuration.
This is the string passed to--targetwhen GDB was configured.
23.4.3.3 GDB Scheme Data Types
The values exposed by GDB to Guile are known as
GDB objects. There are several kinds of GDB
object, and each is disjoint from all other types known to Guile.
- Scheme Procedure: gdb-object-kind object
-
Return the kind of the GDB object, e.g.,
<gdb:breakpoint>,
as a symbol.
GDB defines the following object types:
<gdb:arch>-
See Architectures In Guile.
<gdb:block>-
See Blocks In Guile.
<gdb:block-symbols-iterator>-
See Blocks In Guile.
<gdb:breakpoint>-
See Breakpoints In Guile.
<gdb:command>-
See Commands In Guile.
<gdb:exception>-
See Guile Exception Handling.
<gdb:frame>-
See Frames In Guile.
<gdb:iterator>-
See Iterators In Guile.
<gdb:lazy-string>-
See Lazy Strings In Guile.
<gdb:objfile>-
See Objfiles In Guile.
<gdb:parameter>-
See Parameters In Guile.
<gdb:pretty-printer>-
See Guile Pretty Printing API.
<gdb:pretty-printer-worker>-
See Guile Pretty Printing API.
<gdb:progspace>-
See Progspaces In Guile.
<gdb:symbol>-
See Symbols In Guile.
<gdb:symtab>-
See Symbol Tables In Guile.
<gdb:sal>-
See Symbol Tables In Guile.
<gdb:type>-
See Types In Guile.
<gdb:field>-
See Types In Guile.
<gdb:value>-
See Values From Inferior In Guile.
The following GDB objects are managed internally so that the
Scheme function eq? may be applied to them.
<gdb:arch><gdb:block><gdb:breakpoint><gdb:frame><gdb:objfile><gdb:progspace><gdb:symbol><gdb:symtab><gdb:type>
23.4.3.4 Guile Exception Handling
When executing the guile command, Guile exceptions
uncaught within the Guile code are translated to calls to the
GDB error-reporting mechanism. If the command that called
guile does not handle the error, GDB will
terminate it and report the error according to the setting of
the guile print-stack parameter.
The guile print-stack parameter has three settings:
none-
Nothing is printed.
message-
An error message is printed containing the Guile exception name,
the associated value, and the Guile call stack backtrace at the
point where the exception was raised. Example:(gdb) guile (display foo) ERROR: In procedure memoize-variable-access!: ERROR: Unbound variable: foo Error while executing Scheme code.
full-
In addition to an error message a full backtrace is printed.
(gdb) set guile print-stack full (gdb) guile (display foo) Guile Backtrace: In ice-9/boot-9.scm: 157: 10 [catch #t #<catch-closure 2c76e20> ...] In unknown file: ?: 9 [apply-smob/1 #<catch-closure 2c76e20>] In ice-9/boot-9.scm: 157: 8 [catch #t #<catch-closure 2c76d20> ...] In unknown file: ?: 7 [apply-smob/1 #<catch-closure 2c76d20>] ?: 6 [call-with-input-string "(display foo)" ...] In ice-9/boot-9.scm: 2320: 5 [save-module-excursion #<procedure 2c2dc30 ... ()>] In ice-9/eval-string.scm: 44: 4 [read-and-eval #<input: string 27cb410> #:lang ...] 37: 3 [lp (display foo)] In ice-9/eval.scm: 387: 2 [eval # ()] 393: 1 [eval #<memoized foo> ()] In unknown file: ?: 0 [memoize-variable-access! #<memoized foo> ...] ERROR: In procedure memoize-variable-access!: ERROR: Unbound variable: foo Error while executing Scheme code.
GDB errors that happen in GDB commands invoked by
Guile code are converted to Guile exceptions. The type of the
Guile exception depends on the error.
Guile procedures provided by GDB can throw the standard
Guile exceptions like wrong-type-arg and out-of-range.
User interrupt (via C-c or by typing q at a pagination
prompt) is translated to a Guile signal exception with value
SIGINT.
GDB Guile procedures can also throw these exceptions:
gdb:error-
This exception is a catch-all for errors generated from within GDB.
gdb:invalid-object-
This exception is thrown when accessing Guile objects that wrap underlying
GDB objects have become invalid. For example, a
<gdb:breakpoint>object becomes invalid if the user deletes it
from the command line. The object still exists in Guile, but the
object it represents is gone. Further operations on this breakpoint
will throw this exception. gdb:memory-error-
This exception is thrown when an operation tried to access invalid
memory in the inferior. gdb:pp-type-error-
This exception is thrown when a Guile pretty-printer passes a bad object
to GDB.
The following exception-related procedures are provided by the
(gdb) module.
- Scheme Procedure: make-exception key args
-
Return a
<gdb:exception>object given by its key and
args, which are the standard Guile parameters of an exception.
See the Guile documentation for more information (see Exceptions in GNU Guile Reference Manual).
- Scheme Procedure: exception? object
-
Return
#tif object is a<gdb:exception>object.
Otherwise return#f.
- Scheme Procedure: exception-key exception
-
Return the args field of a
<gdb:exception>object.
- Scheme Procedure: exception-args exception
-
Return the args field of a
<gdb:exception>object.
23.4.3.5 Values From Inferior In Guile
GDB provides values it obtains from the inferior program in
an object of type <gdb:value>. GDB uses this object
for its internal bookkeeping of the inferior’s values, and for
fetching values when necessary.
GDB does not memoize <gdb:value> objects.
make-value always returns a fresh object.
(gdb) guile (eq? (make-value 1) (make-value 1)) $1 = #f (gdb) guile (equal? (make-value 1) (make-value 1)) $1 = #t
A <gdb:value> that represents a function can be executed via
inferior function call with value-call.
Any arguments provided to the call must match the function’s prototype,
and must be provided in the order specified by that prototype.
For example, some-val is a <gdb:value> instance
representing a function that takes two integers as arguments. To
execute this function, call it like so:
(define result (value-call some-val 10 20))
Any values returned from a function call are <gdb:value> objects.
Note: Unlike Python scripting in GDB,
inferior values that are simple scalars cannot be used directly in
Scheme expressions that are valid for the value’s data type.
For example, (+ (parse-and-eval "int_variable") 2) does not work.
And inferior values that are structures or instances of some class cannot
be accessed using any special syntax, instead value-field must be used.
The following value-related procedures are provided by the
(gdb) module.
- Scheme Procedure: value? object
-
Return
#tif object is a<gdb:value>object.
Otherwise return#f.
- Scheme Procedure: make-value value [#:type type]
-
Many Scheme values can be converted directly to a
<gdb:value>
with this procedure. If type is specified, the result is a value
of this type, and if value can’t be represented with this type
an exception is thrown. Otherwise the type of the result is determined from
value as described below.See Architectures In Guile, for a list of the builtin
types for an architecture.Here’s how Scheme values are converted when type argument to
make-valueis not specified:- Scheme boolean
-
A Scheme boolean is converted the boolean type for the current language.
- Scheme integer
-
A Scheme integer is converted to the first of a C
int,
unsigned int,long,unsigned long,
long longorunsigned long longtype
for the current architecture that can represent the value.If the Scheme integer cannot be represented as a target integer
anout-of-rangeexception is thrown. - Scheme real
-
A Scheme real is converted to the C
doubletype for the
current architecture. - Scheme string
-
A Scheme string is converted to a string in the current target
language using the current target encoding.
Characters that cannot be represented in the current target encoding
are replaced with the corresponding escape sequence. This is Guile’s
SCM_FAILED_CONVERSION_ESCAPE_SEQUENCEconversion strategy
(see Strings in GNU Guile Reference Manual).Passing type is not supported in this case,
if it is provided awrong-type-argexception is thrown. <gdb:lazy-string>-
If value is a
<gdb:lazy-string>object (see Lazy Strings In Guile), then thelazy-string->valueprocedure is called, and
its result is used.Passing type is not supported in this case,
if it is provided awrong-type-argexception is thrown. - Scheme bytevector
-
If value is a Scheme bytevector and type is provided,
value must be the same size, in bytes, of values of type type,
and the result is essentially created by usingmemcpy.If value is a Scheme bytevector and type is not provided,
the result is an array of typeuint8of the same length.
- Scheme Procedure: value-optimized-out? value
-
Return
#tif the compiler optimized out value,
thus it is not available for fetching from the inferior.
Otherwise return#f.
- Scheme Procedure: value-address value
-
If value is addressable, returns a
<gdb:value>object representing the address.
Otherwise,#fis returned.
- Scheme Procedure: value-type value
-
Return the type of value as a
<gdb:type>object
(see Types In Guile).
- Scheme Procedure: value-dynamic-type value
-
Return the dynamic type of value. This uses C++ run-time
type information (RTTI) to determine the dynamic type of the
value. If the value is of class type, it will return the class in
which the value is embedded, if any. If the value is of pointer or
reference to a class type, it will compute the dynamic type of the
referenced object, and return a pointer or reference to that type,
respectively. In all other cases, it will return the value’s static
type.Note that this feature will only work when debugging a C++ program
that includes RTTI for the object in question. Otherwise,
it will just return the static type of the value as in ptype foo.
See ptype.
- Scheme Procedure: value-cast value type
-
Return a new instance of
<gdb:value>that is the result of
casting value to the type described by type, which must
be a<gdb:type>object. If the cast cannot be performed for some
reason, this method throws an exception.
- Scheme Procedure: value-dynamic-cast value type
-
Like
value-cast, but works as if the C++dynamic_cast
operator were used. Consult a C++ reference for details.
- Scheme Procedure: value-reinterpret-cast value type
-
Like
value-cast, but works as if the C++reinterpret_cast
operator were used. Consult a C++ reference for details.
- Scheme Procedure: value-dereference value
-
For pointer data types, this method returns a new
<gdb:value>object
whose contents is the object pointed to by value. For example, if
foois a C pointer to anint, declared in your C program asthen you can use the corresponding
<gdb:value>to access what
foopoints to like this:(define bar (value-dereference foo))
The result
barwill be a<gdb:value>object holding the
value pointed to byfoo.A similar function
value-referenced-valueexists which also
returns<gdb:value>objects corresponding to the values pointed to
by pointer values (and additionally, values referenced by reference
values). However, the behavior ofvalue-dereference
differs fromvalue-referenced-valueby the fact that the
behavior ofvalue-dereferenceis identical to applying the C
unary operator*on a given value. For example, consider a
reference to a pointerptrref, declared in your C++ program
astypedef int *intptr; ... int val = 10; intptr ptr = &val; intptr &ptrref = ptr;
Though
ptrrefis a reference value, one can apply the method
value-dereferenceto the<gdb:value>object corresponding
to it and obtain a<gdb:value>which is identical to that
corresponding toval. However, if you apply the method
value-referenced-value, the result would be a<gdb:value>
object identical to that corresponding toptr.(define scm-ptrref (parse-and-eval "ptrref")) (define scm-val (value-dereference scm-ptrref)) (define scm-ptr (value-referenced-value scm-ptrref))
The
<gdb:value>objectscm-valis identical to that
corresponding toval, andscm-ptris identical to that
corresponding toptr. In general,value-dereferencecan
be applied whenever the C unary operator*can be applied
to the corresponding C value. For those cases where applying both
value-dereferenceandvalue-referenced-valueis allowed,
the results obtained need not be identical (as we have seen in the above
example). The results are however identical when applied on
<gdb:value>objects corresponding to pointers (<gdb:value>
objects with type codeTYPE_CODE_PTR) in a C/C++ program.
- Scheme Procedure: value-referenced-value value
-
For pointer or reference data types, this method returns a new
<gdb:value>object corresponding to the value referenced by the
pointer/reference value. For pointer data types,
value-dereferenceandvalue-referenced-valueproduce
identical results. The difference between these methods is that
value-dereferencecannot get the values referenced by reference
values. For example, consider a reference to anint, declared
in your C++ program asint val = 10; int &ref = val;
then applying
value-dereferenceto the<gdb:value>object
corresponding torefwill result in an error, while applying
value-referenced-valuewill result in a<gdb:value>object
identical to that corresponding toval.(define scm-ref (parse-and-eval "ref")) (define err-ref (value-dereference scm-ref)) ;; error (define scm-val (value-referenced-value scm-ref)) ;; ok
The
<gdb:value>objectscm-valis identical to that
corresponding toval.
- Scheme Procedure: value-reference-value value
-
Return a new
<gdb:value>object which is a reference to the value
encapsulated by<gdb:value>object value.
- Scheme Procedure: value-rvalue-reference-value value
-
Return a new
<gdb:value>object which is an rvalue reference to
the value encapsulated by<gdb:value>object value.
- Scheme Procedure: value-const-value value
-
Return a new
<gdb:value>object which is a ‘const’ version
of<gdb:value>object value.
- Scheme Procedure: value-field value field-name
-
Return field field-name from
<gdb:value>object value.
- Scheme Procedure: value-subscript value index
-
Return the value of array value at index index.
The value argument must be a subscriptable<gdb:value>object.
- Scheme Procedure: value-call value arg-list
-
Perform an inferior function call, taking value as a pointer
to the function to call.
Each element of list arg-list must be a <gdb:value> object or an object
that can be converted to a value.
The result is the value returned by the function.
- Scheme Procedure: value->bool value
-
Return the Scheme boolean representing
<gdb:value>value.
The value must be “integer like”. Pointers are ok.
- Scheme Procedure: value->integer
-
Return the Scheme integer representing
<gdb:value>value.
The value must be “integer like”. Pointers are ok.
- Scheme Procedure: value->real
-
Return the Scheme real number representing
<gdb:value>value.
The value must be a number.
- Scheme Procedure: value->bytevector
-
Return a Scheme bytevector with the raw contents of
<gdb:value>
value. No transformation, endian or otherwise, is performed.
- Scheme Procedure: value->string value [#:encoding encoding] [#:errors errors] [#:length length]
-
If value> represents a string, then this method
converts the contents to a Guile string. Otherwise, this method will
throw an exception.Values are interpreted as strings according to the rules of the
current language. If the optional length argument is given, the
string will be converted to that length, and will include any embedded
zeroes that the string may contain. Otherwise, for languages
where the string is zero-terminated, the entire string will be
converted.For example, in C-like languages, a value is a string if it is a pointer
to or an array of characters or ints of typewchar_t,char16_t,
orchar32_t.If the optional encoding argument is given, it must be a string
naming the encoding of the string in the<gdb:value>, such as
"ascii","iso-8859-6"or"utf-8". It accepts
the same encodings as the corresponding argument to Guile’s
scm_from_stringnfunction, and the Guile codec machinery will be used
to convert the string. If encoding is not given, or if
encoding is the empty string, then either thetarget-charset
(see Character Sets) will be used, or a language-specific encoding
will be used, if the current language is able to supply one.The optional errors argument is one of
#f,erroror
substitute.errorandsubstitutemust be symbols.
If errors is not specified, or if its value is#f, then the
default conversion strategy is used, which is set with the Scheme function
set-port-conversion-strategy!.
If the value is'errorthen an exception is thrown if there is any
conversion error. If the value is'substitutethen any conversion
error is replaced with question marks.
See Strings in GNU Guile Reference Manual.If the optional length argument is given, the string will be
fetched and converted to the given length.
The length must be a Scheme integer and not a<gdb:value>integer.
- Scheme Procedure: value->lazy-string value [#:encoding encoding] [#:length length]
-
If this
<gdb:value>represents a string, then this method
converts value to a<gdb:lazy-string(see Lazy Strings In Guile). Otherwise, this method will throw an exception.If the optional encoding argument is given, it must be a string
naming the encoding of the<gdb:lazy-string. Some examples are:
"ascii","iso-8859-6"or"utf-8". If the
encoding argument is an encoding that GDB does not
recognize, GDB will raise an error.When a lazy string is printed, the GDB encoding machinery is
used to convert the string during printing. If the optional
encoding argument is not provided, or is an empty string,
GDB will automatically select the encoding most suitable for
the string type. For further information on encoding in GDB
please see Character Sets.If the optional length argument is given, the string will be
fetched and encoded to the length of characters specified. If
the length argument is not provided, the string will be fetched
and encoded until a null of appropriate width is found.
The length must be a Scheme integer and not a<gdb:value>integer.
- Scheme Procedure: value-lazy? value
-
Return
#tif value has not yet been fetched
from the inferior.
Otherwise return#f.
GDB does not fetch values until necessary, for efficiency.
For example:(define myval (parse-and-eval "somevar"))
The value of
somevaris not fetched at this time. It will be
fetched when the value is needed, or when thefetch-lazy
procedure is invoked.
- Scheme Procedure: make-lazy-value type address
-
Return a
<gdb:value>that will be lazily fetched from the
target. The object of type<gdb:type>whose value to fetch is
specified by its type and its target memory address, which
is a Scheme integer.
- Scheme Procedure: value-fetch-lazy! value
-
If value is a lazy value (
(value-lazy? value)is#t),
then the value is fetched from the inferior.
Any errors that occur in the process will produce a Guile exception.If value is not a lazy value, this method has no effect.
The result of this function is unspecified.
- Scheme Procedure: value-print value
-
Return the string representation (print form) of
<gdb:value>
value.
23.4.3.6 Arithmetic In Guile
The (gdb) module provides several functions for performing
arithmetic on <gdb:value> objects.
The arithmetic is performed as if it were done by the target,
and therefore has target semantics which are not necessarily
those of Scheme. For example operations work with a fixed precision,
not the arbitrary precision of Scheme.
Wherever a function takes an integer or pointer as an operand,
GDB will convert appropriate Scheme values to perform
the operation.
- Scheme Procedure: value-add a b
- Scheme Procedure: value-sub a b
- Scheme Procedure: value-mul a b
- Scheme Procedure: value-div a b
- Scheme Procedure: value-rem a b
- Scheme Procedure: value-mod a b
- Scheme Procedure: value-pow a b
- Scheme Procedure: value-not a
- Scheme Procedure: value-neg a
- Scheme Procedure: value-pos a
- Scheme Procedure: value-abs a
- Scheme Procedure: value-lsh a b
- Scheme Procedure: value-rsh a b
- Scheme Procedure: value-min a b
- Scheme Procedure: value-max a b
- Scheme Procedure: value-lognot a
- Scheme Procedure: value-logand a b
- Scheme Procedure: value-logior a b
- Scheme Procedure: value-logxor a b
- Scheme Procedure: value=? a b
- Scheme Procedure: value<? a b
- Scheme Procedure: value<=? a b
- Scheme Procedure: value>? a b
- Scheme Procedure: value>=? a b
Scheme does not provide a not-equal function,
and thus Guile support in GDB does not either.
23.4.3.7 Types In Guile
GDB represents types from the inferior in objects of type
<gdb:type>.
The following type-related procedures are provided by the
(gdb) module.
- Scheme Procedure: type? object
-
Return
#tif object is an object of type<gdb:type>.
Otherwise return#f.
- Scheme Procedure: lookup-type name [#:block block]
-
This function looks up a type by its name, which must be a string.
If block is given, it is an object of type
<gdb:block>,
and name is looked up in that scope.
Otherwise, it is searched for globally.Ordinarily, this function will return an instance of
<gdb:type>.
If the named type cannot be found, it will throw an exception.
- Scheme Procedure: type-code type
-
Return the type code of type. The type code will be one of the
TYPE_CODE_constants defined below.
- Scheme Procedure: type-tag type
-
Return the tag name of type. The tag name is the name after
struct,union, orenumin C and C++; not all
languages have this concept. If this type has no tag name, then
#fis returned.
- Scheme Procedure: type-name type
-
Return the name of type.
If this type has no name, then#fis returned.
- Scheme Procedure: type-print-name type
-
Return the print name of type.
This returns something even for anonymous types.
For example, for an anonymous C struct"struct {...}"is returned.
- Scheme Procedure: type-sizeof type
-
Return the size of this type, in target
charunits. Usually, a
target’schartype will be an 8-bit byte. However, on some
unusual platforms, this type may have a different size.
- Scheme Procedure: type-strip-typedefs type
-
Return a new
<gdb:type>that represents the real type of type,
after removing all layers of typedefs.
- Scheme Procedure: type-array type n1 [n2]
-
Return a new
<gdb:type>object which represents an array of this
type. If one argument is given, it is the inclusive upper bound of
the array; in this case the lower bound is zero. If two arguments are
given, the first argument is the lower bound of the array, and the
second argument is the upper bound of the array. An array’s length
must not be negative, but the bounds can be.
- Scheme Procedure: type-vector type n1 [n2]
-
Return a new
<gdb:type>object which represents a vector of this
type. If one argument is given, it is the inclusive upper bound of
the vector; in this case the lower bound is zero. If two arguments are
given, the first argument is the lower bound of the vector, and the
second argument is the upper bound of the vector. A vector’s length
must not be negative, but the bounds can be.The difference between an
arrayand avectoris that
arrays behave like in C: when used in expressions they decay to a pointer
to the first element whereas vectors are treated as first class values.
- Scheme Procedure: type-pointer type
-
Return a new
<gdb:type>object which represents a pointer to
type.
- Scheme Procedure: type-range type
-
Return a list of two elements: the low bound and high bound of type.
If type does not have a range, an exception is thrown.
- Scheme Procedure: type-reference type
-
Return a new
<gdb:type>object which represents a reference to
type.
- Scheme Procedure: type-target type
-
Return a new
<gdb:type>object which represents the target type
of type.For a pointer type, the target type is the type of the pointed-to
object. For an array type (meaning C-like arrays), the target type is
the type of the elements of the array. For a function or method type,
the target type is the type of the return value. For a complex type,
the target type is the type of the elements. For a typedef, the
target type is the aliased type.If the type does not have a target, this method will throw an
exception.
- Scheme Procedure: type-const type
-
Return a new
<gdb:type>object which represents a
const-qualified variant of type.
- Scheme Procedure: type-volatile type
-
Return a new
<gdb:type>object which represents a
volatile-qualified variant of type.
- Scheme Procedure: type-unqualified type
-
Return a new
<gdb:type>object which represents an unqualified
variant of type. That is, the result is neitherconstnor
volatile.
- Scheme Procedure: type-num-fields
-
Return the number of fields of
<gdb:type>type.
- Scheme Procedure: type-fields type
-
Return the fields of type as a list.
For structure and union types,fieldshas the usual meaning.
Range types have two fields, the minimum and maximum values. Enum types
have one field per enum constant. Function and method types have one
field per parameter. The base types of C++ classes are also
represented as fields. If the type has no fields, or does not fit
into one of these categories, an empty list will be returned.
See Fields of a type in Guile.
- Scheme Procedure: make-field-iterator type
-
Return the fields of type as a <gdb:iterator> object.
See Iterators In Guile.
- Scheme Procedure: type-field type field-name
-
Return field named field-name in type.
The result is an object of type<gdb:field>.
See Fields of a type in Guile.
If the type does not have fields, or field-name is not a field
of type, an exception is thrown.For example, if
some-typeis a<gdb:type>instance holding
a structure type, you can access itsfoofield with:(define bar (type-field some-type "foo"))
barwill be a<gdb:field>object.
- Scheme Procedure: type-has-field? type name
-
Return
#tif<gdb:type>type has field named name.
Otherwise return#f.
Each type has a code, which indicates what category this type falls
into. The available type categories are represented by constants
defined in the (gdb) module:
TYPE_CODE_PTR-
The type is a pointer.
TYPE_CODE_ARRAY-
The type is an array.
TYPE_CODE_STRUCT-
The type is a structure.
TYPE_CODE_UNION-
The type is a union.
TYPE_CODE_ENUM-
The type is an enum.
TYPE_CODE_FLAGS-
A bit flags type, used for things such as status registers.
TYPE_CODE_FUNC-
The type is a function.
TYPE_CODE_INT-
The type is an integer type.
TYPE_CODE_FLT-
A floating point type.
TYPE_CODE_VOID-
The special type
void. TYPE_CODE_SET-
A Pascal set type.
TYPE_CODE_RANGE-
A range type, that is, an integer type with bounds.
TYPE_CODE_STRING-
A string type. Note that this is only used for certain languages with
language-defined string types; C strings are not represented this way. TYPE_CODE_BITSTRING-
A string of bits. It is deprecated.
TYPE_CODE_ERROR-
An unknown or erroneous type.
TYPE_CODE_METHOD-
A method type, as found in C++.
TYPE_CODE_METHODPTR-
A pointer-to-member-function.
TYPE_CODE_MEMBERPTR-
A pointer-to-member.
TYPE_CODE_REF-
A reference type.
TYPE_CODE_RVALUE_REF-
A C++11 rvalue reference type.
TYPE_CODE_CHAR-
A character type.
TYPE_CODE_BOOL-
A boolean type.
TYPE_CODE_COMPLEX-
A complex float type.
TYPE_CODE_TYPEDEF-
A typedef to some other type.
TYPE_CODE_NAMESPACE-
A C++ namespace.
TYPE_CODE_DECFLOAT-
A decimal floating point type.
TYPE_CODE_INTERNAL_FUNCTION-
A function internal to GDB. This is the type used to represent
convenience functions (see Convenience Funs). gdb.TYPE_CODE_XMETHOD-
A method internal to GDB. This is the type used to represent
xmethods (see Writing an Xmethod). gdb.TYPE_CODE_FIXED_POINT-
A fixed-point number.
gdb.TYPE_CODE_NAMESPACE-
A Fortran namelist.
Further support for types is provided in the (gdb types)
Guile module (see Guile Types Module).
Each field is represented as an object of type <gdb:field>.
The following field-related procedures are provided by the
(gdb) module:
- Scheme Procedure: field? object
-
Return
#tif object is an object of type<gdb:field>.
Otherwise return#f.
- Scheme Procedure: field-name field
-
Return the name of the field, or
#ffor anonymous fields.
- Scheme Procedure: field-type field
-
Return the type of the field. This is usually an instance of
<gdb:type>, but it can be#fin some situations.
- Scheme Procedure: field-enumval field
-
Return the enum value represented by
<gdb:field>field.
- Scheme Procedure: field-bitpos field
-
Return the bit position of
<gdb:field>field.
This attribute is not available forstaticfields (as in
C++).
- Scheme Procedure: field-bitsize field
-
If the field is packed, or is a bitfield, return the size of
<gdb:field>field in bits. Otherwise, zero is returned;
in which case the field’s size is given by its type.
- Scheme Procedure: field-artificial? field
-
Return
#tif the field is artificial, usually meaning that
it was provided by the compiler and not the user.
Otherwise return#f.
- Scheme Procedure: field-base-class? field
-
Return
#tif the field represents a base class of a C++
structure.
Otherwise return#f.
23.4.3.8 Guile Pretty Printing API
An example output is provided (see Pretty Printing).
A pretty-printer is represented by an object of type <gdb:pretty-printer>.
Pretty-printer objects are created with make-pretty-printer.
The following pretty-printer-related procedures are provided by the
(gdb) module:
- Scheme Procedure: make-pretty-printer name lookup-function
-
Return a
<gdb:pretty-printer>object named name.lookup-function is a function of one parameter: the value to
be printed. If the value is handled by this pretty-printer, then
lookup-function returns an object of type
<gdb:pretty-printer-worker> to perform the actual pretty-printing.
Otherwise lookup-function returns#f.
- Scheme Procedure: pretty-printer? object
-
Return
#tif object is a<gdb:pretty-printer>object.
Otherwise return#f.
- Scheme Procedure: pretty-printer-enabled? pretty-printer
-
Return
#tif pretty-printer is enabled.
Otherwise return#f.
- Scheme Procedure: set-pretty-printer-enabled! pretty-printer flag
-
Set the enabled flag of pretty-printer to flag.
The value returned is unspecified.
- Scheme Procedure: pretty-printers
-
Return the list of global pretty-printers.
- Scheme Procedure: set-pretty-printers! pretty-printers
-
Set the list of global pretty-printers to pretty-printers.
The value returned is unspecified.
- Scheme Procedure: make-pretty-printer-worker display-hint to-string children
-
Return an object of type
<gdb:pretty-printer-worker>.This function takes three parameters:
- ‘display-hint’
-
display-hint provides a hint to GDB or GDB
front end via MI to change the formatting of the value being printed.
The value must be a string or#f(meaning there is no hint).
Several values for display-hint
are predefined by GDB:- ‘array’
-
Indicate that the object being printed is “array-like”. The CLI
uses this to respect parameters such asset print elementsand
set print array. - ‘map’
-
Indicate that the object being printed is “map-like”, and that the
children of this value can be assumed to alternate between keys and
values. - ‘string’
-
Indicate that the object being printed is “string-like”. If the
printer’sto-stringfunction returns a Guile string of some
kind, then GDB will call its internal language-specific
string-printing function to format the string. For the CLI this means
adding quotation marks, possibly escaping some characters, respecting
set print elements, and the like.
- ‘to-string’
-
to-string is either a function of one parameter, the
<gdb:pretty-printer-worker>object, or#f.When printing from the CLI, if the
to-stringmethod exists,
then GDB will prepend its result to the values returned by
children. Exactly how this formatting is done is dependent on
the display hint, and may change as more hints are added. Also,
depending on the print settings (see Print Settings), the CLI may
print just the result ofto-stringin a stack trace, omitting
the result ofchildren.If this method returns a string, it is printed verbatim.
Otherwise, if this method returns an instance of
<gdb:value>,
then GDB prints this value. This may result in a call to
another pretty-printer.If instead the method returns a Guile value which is convertible to a
<gdb:value>, then GDB performs the conversion and prints
the resulting value. Again, this may result in a call to another
pretty-printer. Guile scalars (integers, floats, and booleans) and
strings are convertible to<gdb:value>; other types are not.Finally, if this method returns
#fthen no further operations
are peformed in this method and nothing is printed.If the result is not one of these types, an exception is raised.
to-string may also be
#fin which case it is left to
children to print the value. - ‘children’
-
children is either a function of one parameter, the
<gdb:pretty-printer-worker>object, or#f.GDB will call this function on a pretty-printer to compute the
children of the pretty-printer’s value.This function must return a <gdb:iterator> object.
Each item returned by the iterator must be a tuple holding
two elements. The first element is the “name” of the child; the
second element is the child’s value. The value can be any Guile
object which is convertible to a GDB value.If children is
#f, GDB will act
as though the value has no children.Children may be hidden from display based on the value of ‘set
print max-depth’ (see Print Settings).
GDB provides a function which can be used to look up the
default pretty-printer for a <gdb:value>:
- Scheme Procedure: default-visualizer value
-
This function takes a
<gdb:value>object as an argument. If a
pretty-printer for this value exists, then it is returned. If no such
printer exists, then this returns#f.
23.4.3.9 Selecting Guile Pretty-Printers
There are three sets of pretty-printers that GDB searches:
- Per-objfile list of pretty-printers (see Objfiles In Guile).
- Per-progspace list of pretty-printers (see Progspaces In Guile).
- The global list of pretty-printers (see Guile Pretty Printing API).
These printers are available when debugging any inferior.
Pretty-printer lookup is done by passing the value to be printed to the
lookup function of each enabled object in turn.
Lookup stops when a lookup function returns a non-#f value
or when the list is exhausted.
Lookup functions must return either a <gdb:pretty-printer-worker>
object or #f. Otherwise an exception is thrown.
GDB first checks the result of objfile-pretty-printers
of each <gdb:objfile> in the current program space and iteratively
calls each enabled lookup function in the list for that <gdb:objfile>
until a non-#f object is returned.
If no pretty-printer is found in the objfile lists, GDB then
searches the result of progspace-pretty-printers of the current
program space, calling each enabled function until a non-#f object
is returned.
After these lists have been exhausted, it tries the global pretty-printers
list, obtained with pretty-printers, again calling each enabled
function until a non-#f object is returned.
The order in which the objfiles are searched is not specified. For a
given list, functions are always invoked from the head of the list,
and iterated over sequentially until the end of the list, or a
<gdb:pretty-printer-worker> object is returned.
For various reasons a pretty-printer may not work.
For example, the underlying data structure may have changed and
the pretty-printer is out of date.
The consequences of a broken pretty-printer are severe enough that
GDB provides support for enabling and disabling individual
printers. For example, if print frame-arguments is on,
a backtrace can become highly illegible if any argument is printed
with a broken printer.
Pretty-printers are enabled and disabled from Scheme by calling
set-pretty-printer-enabled!.
See Guile Pretty Printing API.
23.4.3.10 Writing a Guile Pretty-Printer
A pretty-printer consists of two basic parts: a lookup function to determine
if the type is supported, and the printer itself.
Here is an example showing how a std::string printer might be
written. See Guile Pretty Printing API, for details.
(define (make-my-string-printer value)
"Print a my::string string"
(make-pretty-printer-worker
"string"
(lambda (printer)
(value-field value "_data"))
#f))
And here is an example showing how a lookup function for the printer
example above might be written.
(define (str-lookup-function pretty-printer value)
(let ((tag (type-tag (value-type value))))
(and tag
(string-prefix? "std::string<" tag)
(make-my-string-printer value))))
Then to register this printer in the global printer list:
(append-pretty-printer! (make-pretty-printer "my-string" str-lookup-function))
The example lookup function extracts the value’s type, and attempts to
match it to a type that it can pretty-print. If it is a type the
printer can pretty-print, it will return a <gdb:pretty-printer-worker> object.
If not, it returns #f.
We recommend that you put your core pretty-printers into a Guile
package. If your pretty-printers are for use with a library, we
further recommend embedding a version number into the package name.
This practice will enable GDB to load multiple versions of
your pretty-printers at the same time, because they will have
different names.
You should write auto-loaded code (see Guile Auto-loading) such that it
can be evaluated multiple times without changing its meaning. An
ideal auto-load file will consist solely of imports of your
printer modules, followed by a call to a register pretty-printers with
the current objfile.
Taken as a whole, this approach will scale nicely to multiple
inferiors, each potentially using a different library version.
Embedding a version number in the Guile package name will ensure that
GDB is able to load both sets of printers simultaneously.
Then, because the search for pretty-printers is done by objfile, and
because your auto-loaded code took care to register your library’s
printers with a specific objfile, GDB will find the correct
printers for the specific version of the library used by each
inferior.
To continue the my::string example,
this code might appear in (my-project my-library v1):
(use-modules (gdb)) (define (register-printers objfile) (append-objfile-pretty-printer! (make-pretty-printer "my-string" str-lookup-function)))
And then the corresponding contents of the auto-load file would be:
(use-modules (gdb) (my-project my-library v1)) (register-printers (current-objfile))
The previous example illustrates a basic pretty-printer.
There are a few things that can be improved on.
The printer only handles one type, whereas a library typically has
several types. One could install a lookup function for each desired type
in the library, but one could also have a single lookup function recognize
several types. The latter is the conventional way this is handled.
If a pretty-printer can handle multiple data types, then its
subprinters are the printers for the individual data types.
The (gdb printing) module provides a formal way of solving this
problem (see Guile Printing Module).
Here is another example that handles multiple types.
These are the types we are going to pretty-print:
struct foo { int a, b; };
struct bar { struct foo x, y; };
Here are the printers:
(define (make-foo-printer value)
"Print a foo object"
(make-pretty-printer-worker
"foo"
(lambda (printer)
(format #f "a=<~a> b=<~a>"
(value-field value "a") (value-field value "a")))
#f))
(define (make-bar-printer value)
"Print a bar object"
(make-pretty-printer-worker
"foo"
(lambda (printer)
(format #f "x=<~a> y=<~a>"
(value-field value "x") (value-field value "y")))
#f))
This example doesn’t need a lookup function, that is handled by the
(gdb printing) module. Instead a function is provided to build up
the object that handles the lookup.
(use-modules (gdb printing))
(define (build-pretty-printer)
(let ((pp (make-pretty-printer-collection "my-library")))
(pp-collection-add-tag-printer "foo" make-foo-printer)
(pp-collection-add-tag-printer "bar" make-bar-printer)
pp))
And here is the autoload support:
(use-modules (gdb) (my-library)) (append-objfile-pretty-printer! (current-objfile) (build-pretty-printer))
Finally, when this printer is loaded into GDB, here is the
corresponding output of ‘info pretty-printer’:
(gdb) info pretty-printer
my_library.so:
my-library
foo
bar
23.4.3.11 Commands In Guile
You can implement new GDB CLI commands in Guile. A CLI
command object is created with the make-command Guile function,
and added to GDB with the register-command! Guile function.
This two-step approach is taken to separate out the side-effect of adding
the command to GDB from make-command.
There is no support for multi-line commands, that is commands that
consist of multiple lines and are terminated with end.
- Scheme Procedure: make-command name [#:invoke invoke] [#:command-class command-class] [#:completer-class completer] [#:prefix? prefix] [#:doc doc-string]
-
The argument name is the name of the command. If name consists of
multiple words, then the initial words are looked for as prefix
commands. In this case, if one of the prefix commands does not exist,
an exception is raised.The result is the
<gdb:command>object representing the command.
The command is not usable until it has been registered with GDB
withregister-command!.The rest of the arguments are optional.
The argument invoke is a procedure of three arguments: self,
args and from-tty. The argument self is the
<gdb:command>object representing the command.
The argument args is a string representing the arguments passed to
the command, after leading and trailing whitespace has been stripped.
The argument from-tty is a boolean flag and specifies whether the
command should consider itself to have been originated from the user
invoking it interactively. If this function throws an exception,
it is turned into a GDBerrorcall.
Otherwise, the return value is ignored.The argument command-class is one of the ‘COMMAND_’ constants
defined below. This argument tells GDB how to categorize the
new command in the help system. The default isCOMMAND_NONE.The argument completer is either
#f, one of the ‘COMPLETE_’
constants defined below, or a procedure, also defined below.
This argument tells GDB how to perform completion
for this command. If not provided or if the value is#f,
then no completion is performed on the command.The argument prefix is a boolean flag indicating whether the new
command is a prefix command; sub-commands of this command may be
registered.The argument doc-string is help text for the new command.
If no documentation string is provided, the default value “This command is
not documented.” is used.
- Scheme Procedure: register-command! command
-
Add command, a
<gdb:command>object, to GDB’s
list of commands.
It is an error to register a command more than once.
The result is unspecified.
- Scheme Procedure: command? object
-
Return
#tif object is a<gdb:command>object.
Otherwise return#f.
- Scheme Procedure: dont-repeat
-
By default, a GDB command is repeated when the user enters a
blank line at the command prompt. A command can suppress this
behavior by invoking thedont-repeatfunction. This is similar
to the user commanddont-repeat, see dont-repeat.
- Scheme Procedure: string->argv string
-
Convert a string to a list of strings split up according to
GDB’s argv parsing rules.
It is recommended to use this for consistency.
Arguments are separated by spaces and may be quoted.
Example:scheme@(guile-user)> (string->argv "1 2\ \"3 '4 "5' "6 '7"") $1 = ("1" "2 "3" "4 "5" "6 '7")
- Scheme Procedure: throw-user-error message . args
-
Throw a
gdb:user-errorexception.
The argument message is the error message as a format string, like the
fmt argument to theformatScheme function.
See Formatted Output in GNU Guile Reference Manual.
The argument args is a list of the optional arguments of message.This is used when the command detects a user error of some kind,
say a bad command argument.(gdb) guile (use-modules (gdb)) (gdb) guile (register-command! (make-command "test-user-error" #:command-class COMMAND_OBSCURE #:invoke (lambda (self arg from-tty) (throw-user-error "Bad argument ~a" arg)))) end (gdb) test-user-error ugh ERROR: Bad argument ugh
- completer: self text word
-
If the completer option to
make-commandis a procedure,
it takes three arguments: self which is the<gdb:command>
object, and text and word which are both strings.
The argument text holds the complete command line up to the cursor’s
location. The argument word holds the last word of the command line;
this is computed using a word-breaking heuristic.All forms of completion are handled by this function, that is,
the TAB and M-? key bindings (see Completion),
and thecompletecommand (see complete).This procedure can return several kinds of values:
- If the return value is a list, the contents of the list are used as the
completions. It is up to completer to ensure that the
contents actually do complete the word. An empty list is
allowed, it means that there were no completions available. Only
string elements of the list are used; other elements in the
list are ignored. - If the return value is a
<gdb:iterator>object, it is iterated over to
obtain the completions. It is up tocompleter-procedureto ensure
that the results actually do complete the word. Only
string elements of the result are used; other elements in the
sequence are ignored. - All other results are treated as though there were no available
completions.
- If the return value is a list, the contents of the list are used as the
When a new command is registered, it will have been declared as a member of
some general class of commands. This is used to classify top-level
commands in the on-line help system; note that prefix commands are not
listed under their own category but rather that of their top-level
command. The available classifications are represented by constants
defined in the gdb module:
COMMAND_NONE-
The command does not belong to any particular class. A command in
this category will not be displayed in any of the help categories.
This is the default. COMMAND_RUNNING-
The command is related to running the inferior. For example,
start,step, andcontinueare in this category.
Type help running at the GDB prompt to see a list of
commands in this category. COMMAND_DATA-
The command is related to data or variables. For example,
call,find, andprintare in this category. Type
help data at the GDB prompt to see a list of commands
in this category. COMMAND_STACK-
The command has to do with manipulation of the stack. For example,
backtrace,frame, andreturnare in this
category. Type help stack at the GDB prompt to see a
list of commands in this category. COMMAND_FILES-
This class is used for file-related commands. For example,
file,listandsectionare in this category.
Type help files at the GDB prompt to see a list of
commands in this category. COMMAND_SUPPORT-
This should be used for “support facilities”, generally meaning
things that are useful to the user when interacting with GDB,
but not related to the state of the inferior. For example,
help,make, andshellare in this category. Type
help support at the GDB prompt to see a list of
commands in this category. COMMAND_STATUS-
The command is an ‘info’-related command, that is, related to the
state of GDB itself. For example,info,macro,
andshoware in this category. Type help status at the
GDB prompt to see a list of commands in this category. COMMAND_BREAKPOINTS-
The command has to do with breakpoints. For example,
break,
clear, anddeleteare in this category. Type help
breakpoints at the GDB prompt to see a list of commands in
this category. COMMAND_TRACEPOINTS-
The command has to do with tracepoints. For example,
trace,
actions, andtfindare in this category. Type
help tracepoints at the GDB prompt to see a list of
commands in this category. COMMAND_USER-
The command is a general purpose command for the user, and typically
does not fit in one of the other categories.
Type help user-defined at the GDB prompt to see
a list of commands in this category, as well as the list of gdb macros
(see Sequences). COMMAND_OBSCURE-
The command is only used in unusual circumstances, or is not of
general interest to users. For example,checkpoint,
fork, andstopare in this category. Type help
obscure at the GDB prompt to see a list of commands in this
category. COMMAND_MAINTENANCE-
The command is only useful to GDB maintainers. The
maintenanceandflushregscommands are in this category.
Type help internals at the GDB prompt to see a list of
commands in this category.
A new command can use a predefined completion function, either by
specifying it via an argument at initialization, or by returning it
from the completer procedure. These predefined completion
constants are all defined in the gdb module:
COMPLETE_NONE-
This constant means that no completion should be done.
COMPLETE_FILENAME-
This constant means that filename completion should be performed.
COMPLETE_LOCATION-
This constant means that location completion should be done.
See Location Specifications. COMPLETE_COMMAND-
This constant means that completion should examine GDB
command names. COMPLETE_SYMBOL-
This constant means that completion should be done using symbol names
as the source. COMPLETE_EXPRESSION-
This constant means that completion should be done on expressions.
Often this means completing on symbol names, but some language
parsers also have support for completing on field names.
The following code snippet shows how a trivial CLI command can be
implemented in Guile:
(gdb) guile (register-command! (make-command "hello-world" #:command-class COMMAND_USER #:doc "Greet the whole world." #:invoke (lambda (self args from-tty) (display "Hello, World!n")))) end (gdb) hello-world Hello, World!
23.4.3.12 Parameters In Guile
You can implement new GDB parameters using Guile
20.
There are many parameters that already exist and can be set in
GDB. Two examples are: set follow-fork and
set charset. Setting these parameters influences certain
behavior in GDB. Similarly, you can define parameters that
can be used to influence behavior in custom Guile scripts and commands.
A new parameter is defined with the make-parameter Guile function,
and added to GDB with the register-parameter! Guile function.
This two-step approach is taken to separate out the side-effect of adding
the parameter to GDB from make-parameter.
Parameters are exposed to the user via the set and
show commands. See Help.
- Scheme Procedure: make-parameter name [#:command-class command-class] [#:parameter-type parameter-type] [#:enum-list enum-list] [#:set-func set-func] [#:show-func show-func] [#:doc doc] [#:set-doc set-doc] [#:show-doc show-doc] [#:initial-value initial-value]
-
The argument name is the name of the new parameter. If name
consists of multiple words, then the initial words are looked for as prefix
parameters. An example of this can be illustrated with the
set printset of parameters. If name is
print foo, thenprintwill be searched as the prefix
parameter. In this case the parameter can subsequently be accessed in
GDB asset print foo.
If name consists of multiple words, and no prefix parameter group
can be found, an exception is raised.The result is the
<gdb:parameter>object representing the parameter.
The parameter is not usable until it has been registered with GDB
withregister-parameter!.The rest of the arguments are optional.
The argument command-class should be one of the ‘COMMAND_’ constants
(see Commands In Guile). This argument tells GDB how to
categorize the new parameter in the help system.
The default isCOMMAND_NONE.The argument parameter-type should be one of the ‘PARAM_’ constants
defined below. This argument tells GDB the type of the new
parameter; this information is used for input validation and
completion. The default isPARAM_BOOLEAN.If parameter-type is
PARAM_ENUM, then
enum-list must be a list of strings. These strings
represent the possible values for the parameter.If parameter-type is not
PARAM_ENUM, then the presence
of enum-list will cause an exception to be thrown.The argument set-func is a function of one argument: self which
is the<gdb:parameter>object representing the parameter.
GDB will call this function when a parameter’s value has
been changed via thesetAPI (for example, set foo off).
The value of the parameter has already been set to the new value.
This function must return a string to be displayed to the user.
GDB will add a trailing newline if the string is non-empty.
GDB generally doesn’t print anything when a parameter is set,
thus typically this function should return ‘«»’.
A non-empty string result should typically be used for displaying warnings
and errors.The argument show-func is a function of two arguments: self which
is the<gdb:parameter>object representing the parameter, and
svalue which is the string representation of the current value.
GDB will call this function when a parameter’s
showAPI has been invoked (for example, show foo).
This function must return a string, and will be displayed to the user.
GDB will add a trailing newline.The argument doc is the help text for the new parameter.
If there is no documentation string, a default value is used.The argument set-doc is the help text for this parameter’s
setcommand.The argument show-doc is the help text for this parameter’s
showcommand.The argument initial-value specifies the initial value of the parameter.
If it is a function, it takes one parameter, the<gdb:parameter>
object and its result is used as the initial value of the parameter.
The initial value must be valid for the parameter type,
otherwise an exception is thrown.
- Scheme Procedure: register-parameter! parameter
-
Add parameter, a
<gdb:parameter>object, to GDB’s
list of parameters.
It is an error to register a parameter more than once.
The result is unspecified.
- Scheme Procedure: parameter? object
-
Return
#tif object is a<gdb:parameter>object.
Otherwise return#f.
- Scheme Procedure: parameter-value parameter
-
Return the value of parameter which may either be
a<gdb:parameter>object or a string naming the parameter.
- Scheme Procedure: set-parameter-value! parameter new-value
-
Assign parameter the value of new-value.
The argument parameter must be an object of type<gdb:parameter>.
GDB does validation when assignments are made.
When a new parameter is defined, its type must be specified. The
available types are represented by constants defined in the gdb
module:
PARAM_BOOLEAN-
The value is a plain boolean. The Guile boolean values,
#t
and#fare the only valid values. PARAM_AUTO_BOOLEAN-
The value has three possible states: true, false, and ‘auto’. In
Guile, true and false are represented using boolean constants, and
‘auto’ is represented using#:auto. PARAM_UINTEGER-
The value is an unsigned integer. The value of
#:unlimited
should be interpreted to mean “unlimited”, and the value of ‘0’
is reserved and should not be used. PARAM_ZINTEGER-
The value is an integer.
PARAM_ZUINTEGER-
The value is an unsigned integer.
PARAM_ZUINTEGER_UNLIMITED-
The value is an integer in the range ‘[0, INT_MAX]’. The value
of#:unlimitedmeans “unlimited”, the value of ‘-1’ is
reserved and should not be used, and other negative numbers are not
allowed. PARAM_STRING-
The value is a string. When the user modifies the string, any escape
sequences, such as ‘t’, ‘f’, and octal escapes, are
translated into corresponding characters and encoded into the current
host charset. PARAM_STRING_NOESCAPE-
The value is a string. When the user modifies the string, escapes are
passed through untranslated. PARAM_OPTIONAL_FILENAME-
The value is a either a filename (a string), or
#f. PARAM_FILENAME-
The value is a filename. This is just like
PARAM_STRING_NOESCAPE, but uses file names for completion. PARAM_ENUM-
The value is a string, which must be one of a collection of string
constants provided when the parameter is created.
23.4.3.13 Program Spaces In Guile
A program space, or progspace, represents a symbolic view
of an address space.
It consists of all of the objfiles of the program.
See Objfiles In Guile.
See program spaces, for more details
about program spaces.
Each progspace is represented by an instance of the <gdb:progspace>
smob. See GDB Scheme Data Types.
The following progspace-related functions are available in the
(gdb) module:
- Scheme Procedure: progspace? object
-
Return
#tif object is a<gdb:progspace>object.
Otherwise return#f.
- Scheme Procedure: progspace-valid? progspace
-
Return
#tif progspace is valid,#fif not.
A<gdb:progspace>object can become invalid
if the program it refers to is not loaded in GDB any longer.
- Scheme Procedure: current-progspace
-
This function returns the program space of the currently selected inferior.
There is always a current progspace, this never returns#f.
See Inferiors Connections and Programs.
- Scheme Procedure: progspaces
-
Return a list of all the progspaces currently known to GDB.
- Scheme Procedure: progspace-filename progspace
-
Return the absolute file name of progspace as a string.
This is the name of the file passed as the argument to thefile
orsymbol-filecommands.
If the program space does not have an associated file name,
then#fis returned. This occurs, for example, when GDB
is started without a program to debug.A
gdb:invalid-object-errorexception is thrown if progspace
is invalid.
- Scheme Procedure: progspace-objfiles progspace
-
Return the list of objfiles of progspace.
The order of objfiles in the result is arbitrary.
Each element is an object of type<gdb:objfile>.
See Objfiles In Guile.A
gdb:invalid-object-errorexception is thrown if progspace
is invalid.
- Scheme Procedure: progspace-pretty-printers progspace
-
Return the list of pretty-printers of progspace.
Each element is an object of type<gdb:pretty-printer>.
See Guile Pretty Printing API, for more information.
- Scheme Procedure: set-progspace-pretty-printers! progspace printer-list
-
Set the list of registered
<gdb:pretty-printer>objects for
progspace to printer-list.
See Guile Pretty Printing API, for more information.
23.4.3.14 Objfiles In Guile
GDB loads symbols for an inferior from various
symbol-containing files (see Files). These include the primary
executable file, any shared libraries used by the inferior, and any
separate debug info files (see Separate Debug Files).
GDB calls these symbol-containing files objfiles.
Each objfile is represented as an object of type <gdb:objfile>.
The following objfile-related procedures are provided by the
(gdb) module:
- Scheme Procedure: objfile? object
-
Return
#tif object is a<gdb:objfile>object.
Otherwise return#f.
- Scheme Procedure: objfile-valid? objfile
-
Return
#tif objfile is valid,#fif not.
A<gdb:objfile>object can become invalid
if the object file it refers to is not loaded in GDB any
longer. All other<gdb:objfile>procedures will throw an exception
if it is invalid at the time the procedure is called.
- Scheme Procedure: objfile-filename objfile
-
Return the file name of objfile as a string,
with symbolic links resolved.
- Scheme Procedure: objfile-progspace objfile
-
Return the
<gdb:progspace>that this object file lives in.
See Progspaces In Guile, for more on progspaces.
- Scheme Procedure: objfile-pretty-printers objfile
-
Return the list of registered
<gdb:pretty-printer>objects for
objfile. See Guile Pretty Printing API, for more information.
- Scheme Procedure: set-objfile-pretty-printers! objfile printer-list
-
Set the list of registered
<gdb:pretty-printer>objects for
objfile to printer-list. The
printer-list must be a list of<gdb:pretty-printer>objects.
See Guile Pretty Printing API, for more information.
- Scheme Procedure: current-objfile
-
When auto-loading a Guile script (see Guile Auto-loading), GDB
sets the “current objfile” to the corresponding objfile. This
function returns the current objfile. If there is no current objfile,
this function returns#f.
- Scheme Procedure: objfiles
-
Return a list of all the objfiles in the current program space.
23.4.3.15 Accessing inferior stack frames from Guile.
When the debugged program stops, GDB is able to analyze its call
stack (see Stack frames). The <gdb:frame> class
represents a frame in the stack. A <gdb:frame> object is only valid
while its corresponding frame exists in the inferior’s stack. If you try
to use an invalid frame object, GDB will throw a
gdb:invalid-object exception (see Guile Exception Handling).
Two <gdb:frame> objects can be compared for equality with the
equal? function, like:
(gdb) guile (equal? (newest-frame) (selected-frame)) #t
The following frame-related procedures are provided by the
(gdb) module:
- Scheme Procedure: frame? object
-
Return
#tif object is a<gdb:frame>object.
Otherwise return#f.
- Scheme Procedure: frame-valid? frame
-
Returns
#tif frame is valid,#fif not.
A frame object can become invalid if the frame it refers to doesn’t
exist anymore in the inferior. All<gdb:frame>procedures will throw
an exception if the frame is invalid at the time the procedure is called.
- Scheme Procedure: frame-name frame
-
Return the function name of frame, or
#fif it can’t be
obtained.
- Scheme Procedure: frame-arch frame
-
Return the
<gdb:architecture>object corresponding to frame’s
architecture. See Architectures In Guile.
- Scheme Procedure: frame-type frame
-
Return the type of frame. The value can be one of:
NORMAL_FRAME-
An ordinary stack frame.
DUMMY_FRAME-
A fake stack frame that was created by GDB when performing an
inferior function call. INLINE_FRAME-
A frame representing an inlined function. The function was inlined
into aNORMAL_FRAMEthat is older than this one. TAILCALL_FRAME-
A frame representing a tail call. See Tail Call Frames.
SIGTRAMP_FRAME-
A signal trampoline frame. This is the frame created by the OS when
it calls into a signal handler. ARCH_FRAME-
A fake stack frame representing a cross-architecture call.
SENTINEL_FRAME-
This is like
NORMAL_FRAME, but it is only used for the
newest frame.
- Scheme Procedure: frame-unwind-stop-reason frame
-
Return an integer representing the reason why it’s not possible to find
more frames toward the outermost frame. Use
unwind-stop-reason-stringto convert the value returned by this
function to a string. The value can be one of:FRAME_UNWIND_NO_REASON-
No particular reason (older frames should be available).
FRAME_UNWIND_NULL_ID-
The previous frame’s analyzer returns an invalid result.
FRAME_UNWIND_OUTERMOST-
This frame is the outermost.
FRAME_UNWIND_UNAVAILABLE-
Cannot unwind further, because that would require knowing the
values of registers or memory that have not been collected. FRAME_UNWIND_INNER_ID-
This frame ID looks like it ought to belong to a NEXT frame,
but we got it for a PREV frame. Normally, this is a sign of
unwinder failure. It could also indicate stack corruption. FRAME_UNWIND_SAME_ID-
This frame has the same ID as the previous one. That means
that unwinding further would almost certainly give us another
frame with exactly the same ID, so break the chain. Normally,
this is a sign of unwinder failure. It could also indicate
stack corruption. FRAME_UNWIND_NO_SAVED_PC-
The frame unwinder did not find any saved PC, but we needed
one to unwind further. FRAME_UNWIND_MEMORY_ERROR-
The frame unwinder caused an error while trying to access memory.
FRAME_UNWIND_FIRST_ERROR-
Any stop reason greater or equal to this value indicates some kind
of error. This special value facilitates writing code that tests
for errors in unwinding in a way that will work correctly even if
the list of the other values is modified in future GDB
versions. Using it, you could write:(define reason (frame-unwind-stop-readon (selected-frame))) (define reason-str (unwind-stop-reason-string reason)) (if (>= reason FRAME_UNWIND_FIRST_ERROR) (format #t "An error occured: ~sn" reason-str))
- Scheme Procedure: frame-pc frame
-
Return the frame’s resume address.
- Scheme Procedure: frame-block frame
-
Return the frame’s code block as a
<gdb:block>object.
See Blocks In Guile.
- Scheme Procedure: frame-function frame
-
Return the symbol for the function corresponding to this frame
as a<gdb:symbol>object, or#fif there isn’t one.
See Symbols In Guile.
- Scheme Procedure: frame-older frame
-
Return the frame that called frame.
- Scheme Procedure: frame-newer frame
-
Return the frame called by frame.
- Scheme Procedure: frame-sal frame
-
Return the frame’s
<gdb:sal>(symtab and line) object.
See Symbol Tables In Guile.
- Scheme Procedure: frame-read-register frame register
-
Return the value of register in frame. register
should be a string, like ‘pc’.
- Scheme Procedure: frame-read-var frame variable [#:block block]
-
Return the value of variable in frame. If the optional
argument block is provided, search for the variable from that
block; otherwise start at the frame’s current block (which is
determined by the frame’s current program counter). The
variable must be given as a string or a<gdb:symbol>
object, and block must be a<gdb:block>object.
- Scheme Procedure: frame-select frame
-
Set frame to be the selected frame. See Examining the
Stack.
- Scheme Procedure: selected-frame
-
Return the selected frame object. See Selecting a Frame.
- Scheme Procedure: newest-frame
-
Return the newest frame object for the selected thread.
- Scheme Procedure: unwind-stop-reason-string reason
-
Return a string explaining the reason why GDB stopped unwinding
frames, as expressed by the given reason code (an integer, see the
frame-unwind-stop-reasonprocedure above in this section).
23.4.3.16 Accessing blocks from Guile.
In GDB, symbols are stored in blocks. A block corresponds
roughly to a scope in the source code. Blocks are organized
hierarchically, and are represented individually in Guile as an object
of type <gdb:block>. Blocks rely on debugging information being
available.
A frame has a block. Please see Frames In Guile, for a more
in-depth discussion of frames.
The outermost block is known as the global block. The global
block typically holds public global variables and functions.
The block nested just inside the global block is the static
block. The static block typically holds file-scoped variables and
functions.
GDB provides a method to get a block’s superblock, but there
is currently no way to examine the sub-blocks of a block, or to
iterate over all the blocks in a symbol table (see Symbol Tables In Guile).
Here is a short example that should help explain blocks:
/* This is in the global block. */
int global;
/* This is in the static block. */
static int file_scope;
/* 'function' is in the global block, and 'argument' is
in a block nested inside of 'function'. */
int function (int argument)
{
/* 'local' is in a block inside 'function'. It may or may
not be in the same block as 'argument'. */
int local;
{
/* 'inner' is in a block whose superblock is the one holding
'local'. */
int inner;
/* If this call is expanded by the compiler, you may see
a nested block here whose function is 'inline_function'
and whose superblock is the one holding 'inner'. */
inline_function ();
}
}
The following block-related procedures are provided by the
(gdb) module:
- Scheme Procedure: block? object
-
Return
#tif object is a<gdb:block>object.
Otherwise return#f.
- Scheme Procedure: block-valid? block
-
Returns
#tif<gdb:block>block is valid,
#fif not. A block object can become invalid if the block it
refers to doesn’t exist anymore in the inferior. All other
<gdb:block>methods will throw an exception if it is invalid at
the time the procedure is called. The block’s validity is also checked
during iteration over symbols of the block.
- Scheme Procedure: block-start block
-
Return the start address of
<gdb:block>block.
- Scheme Procedure: block-end block
-
Return the end address of
<gdb:block>block.
- Scheme Procedure: block-function block
-
Return the name of
<gdb:block>block represented as a
<gdb:symbol>object.
If the block is not named, then#fis returned.For ordinary function blocks, the superblock is the static block.
However, you should note that it is possible for a function block to
have a superblock that is not the static block – for instance this
happens for an inlined function.
- Scheme Procedure: block-superblock block
-
Return the block containing
<gdb:block>block.
If the parent block does not exist, then#fis returned.
- Scheme Procedure: block-global-block block
-
Return the global block associated with
<gdb:block>block.
- Scheme Procedure: block-static-block block
-
Return the static block associated with
<gdb:block>block.
- Scheme Procedure: block-global? block
-
Return
#tif<gdb:block>block is a global block.
Otherwise return#f.
- Scheme Procedure: block-static? block
-
Return
#tif<gdb:block>block is a static block.
Otherwise return#f.
- Scheme Procedure: block-symbols
-
Return a list of all symbols (as <gdb:symbol> objects) in
<gdb:block>block.
- Scheme Procedure: make-block-symbols-iterator block
-
Return an object of type
<gdb:iterator>that will iterate
over all symbols of the block.
Guile programs should not assume that a specific block object will
always contain a given symbol, since changes in GDB features and
infrastructure may cause symbols move across blocks in a symbol table.
See Iterators In Guile.
- Scheme Procedure: block-symbols-progress?
-
Return #t if the object is a <gdb:block-symbols-progress> object.
This object would be obtained from theprogresselement of the
<gdb:iterator>object returned bymake-block-symbols-iterator.
- Scheme Procedure: lookup-block pc
-
Return the innermost
<gdb:block>containing the given pc
value. If the block cannot be found for the pc value specified,
the function will return#f.
23.4.3.17 Guile representation of Symbols.
GDB represents every variable, function and type as an
entry in a symbol table. See Examining the Symbol Table.
Guile represents these symbols in GDB with the
<gdb:symbol> object.
The following symbol-related procedures are provided by the
(gdb) module:
- Scheme Procedure: symbol? object
-
Return
#tif object is an object of type<gdb:symbol>.
Otherwise return#f.
- Scheme Procedure: symbol-valid? symbol
-
Return
#tif the<gdb:symbol>object is valid,
#fif not. A<gdb:symbol>object can become invalid if
the symbol it refers to does not exist in GDB any longer.
All other<gdb:symbol>procedures will throw an exception if it is
invalid at the time the procedure is called.
- Scheme Procedure: symbol-type symbol
-
Return the type of symbol or
#fif no type is recorded.
The result is an object of type<gdb:type>.
See Types In Guile.
- Scheme Procedure: symbol-symtab symbol
-
Return the symbol table in which symbol appears.
The result is an object of type<gdb:symtab>.
See Symbol Tables In Guile.
- Scheme Procedure: symbol-line symbol
-
Return the line number in the source code at which symbol was defined.
This is an integer.
- Scheme Procedure: symbol-name symbol
-
Return the name of symbol as a string.
- Scheme Procedure: symbol-linkage-name symbol
-
Return the name of symbol, as used by the linker (i.e., may be mangled).
- Scheme Procedure: symbol-print-name symbol
-
Return the name of symbol in a form suitable for output. This is either
nameorlinkage_name, depending on whether the user
asked GDB to display demangled or mangled names.
- Scheme Procedure: symbol-addr-class symbol
-
Return the address class of the symbol. This classifies how to find the value
of a symbol. Each address class is a constant defined in the
(gdb)module and described later in this chapter.
- Scheme Procedure: symbol-needs-frame? symbol
-
Return
#tif evaluating symbol’s value requires a frame
(see Frames In Guile) and#fotherwise. Typically,
local variables will require a frame, but other symbols will not.
- Scheme Procedure: symbol-argument? symbol
-
Return
#tif symbol is an argument of a function.
Otherwise return#f.
- Scheme Procedure: symbol-constant? symbol
-
Return
#tif symbol is a constant.
Otherwise return#f.
- Scheme Procedure: symbol-function? symbol
-
Return
#tif symbol is a function or a method.
Otherwise return#f.
- Scheme Procedure: symbol-variable? symbol
-
Return
#tif symbol is a variable.
Otherwise return#f.
- Scheme Procedure: symbol-value symbol [#:frame frame]
-
Compute the value of symbol, as a
<gdb:value>. For
functions, this computes the address of the function, cast to the
appropriate type. If the symbol requires a frame in order to compute
its value, then frame must be given. If frame is not
given, or if frame is invalid, then an exception is thrown.
- Scheme Procedure: lookup-symbol name [#:block block] [#:domain domain]
-
This function searches for a symbol by name. The search scope can be
restricted to the parameters defined in the optional domain and block
arguments.name is the name of the symbol. It must be a string. The
optional block argument restricts the search to symbols visible
in that block. The block argument must be a
<gdb:block>object. If omitted, the block for the current frame
is used. The optional domain argument restricts
the search to the domain type. The domain argument must be a
domain constant defined in the(gdb)module and described later
in this chapter.The result is a list of two elements.
The first element is a<gdb:symbol>object or#fif the symbol
is not found.
If the symbol is found, the second element is#tif the symbol
is a field of a method’s object (e.g.,thisin C++),
otherwise it is#f.
If the symbol is not found, the second element is#f.
- Scheme Procedure: lookup-global-symbol name [#:domain domain]
-
This function searches for a global symbol by name.
The search scope can be restricted by the domain argument.name is the name of the symbol. It must be a string.
The optional domain argument restricts the search to the domain type.
The domain argument must be a domain constant defined in the(gdb)
module and described later in this chapter.The result is a
<gdb:symbol>object or#fif the symbol
is not found.
The available domain categories in <gdb:symbol> are represented
as constants in the (gdb) module:
SYMBOL_UNDEF_DOMAIN-
This is used when a domain has not been discovered or none of the
following domains apply. This usually indicates an error either
in the symbol information or in GDB’s handling of symbols. SYMBOL_VAR_DOMAIN-
This domain contains variables, function names, typedef names and enum
type values. SYMBOL_STRUCT_DOMAIN-
This domain holds struct, union and enum type names.
SYMBOL_LABEL_DOMAIN-
This domain contains names of labels (for gotos).
SYMBOL_VARIABLES_DOMAIN-
This domain holds a subset of the
SYMBOLS_VAR_DOMAIN; it
contains everything minus functions and types. SYMBOL_FUNCTIONS_DOMAIN-
This domain contains all functions.
SYMBOL_TYPES_DOMAIN-
This domain contains all types.
The available address class categories in <gdb:symbol> are represented
as constants in the gdb module:
SYMBOL_LOC_UNDEF-
If this is returned by address class, it indicates an error either in
the symbol information or in GDB’s handling of symbols. SYMBOL_LOC_CONST-
Value is constant int.
SYMBOL_LOC_STATIC-
Value is at a fixed address.
SYMBOL_LOC_REGISTER-
Value is in a register.
SYMBOL_LOC_ARG-
Value is an argument. This value is at the offset stored within the
symbol inside the frame’s argument list. SYMBOL_LOC_REF_ARG-
Value address is stored in the frame’s argument list. Just like
LOC_ARGexcept that the value’s address is stored at the
offset, not the value itself. SYMBOL_LOC_REGPARM_ADDR-
Value is a specified register. Just like
LOC_REGISTERexcept
the register holds the address of the argument instead of the argument
itself. SYMBOL_LOC_LOCAL-
Value is a local variable.
SYMBOL_LOC_TYPEDEF-
Value not used. Symbols in the domain
SYMBOL_STRUCT_DOMAINall
have this class. SYMBOL_LOC_BLOCK-
Value is a block.
SYMBOL_LOC_CONST_BYTES-
Value is a byte-sequence.
SYMBOL_LOC_UNRESOLVED-
Value is at a fixed address, but the address of the variable has to be
determined from the minimal symbol table whenever the variable is
referenced. SYMBOL_LOC_OPTIMIZED_OUT-
The value does not actually exist in the program.
SYMBOL_LOC_COMPUTED-
The value’s address is a computed location.
23.4.3.18 Symbol table representation in Guile.
Access to symbol table data maintained by GDB on the inferior
is exposed to Guile via two objects: <gdb:sal> (symtab-and-line) and
<gdb:symtab>. Symbol table and line data for a frame is returned
from the frame-find-sal <gdb:frame> procedure.
See Frames In Guile.
For more information on GDB’s symbol table management, see
Examining the Symbol Table.
The following symtab-related procedures are provided by the
(gdb) module:
- Scheme Procedure: symtab? object
-
Return
#tif object is an object of type<gdb:symtab>.
Otherwise return#f.
- Scheme Procedure: symtab-valid? symtab
-
Return
#tif the<gdb:symtab>object is valid,
#fif not. A<gdb:symtab>object becomes invalid when
the symbol table it refers to no longer exists in GDB.
All other<gdb:symtab>procedures will throw an exception
if it is invalid at the time the procedure is called.
- Scheme Procedure: symtab-filename symtab
-
Return the symbol table’s source filename.
- Scheme Procedure: symtab-fullname symtab
-
Return the symbol table’s source absolute file name.
- Scheme Procedure: symtab-objfile symtab
-
Return the symbol table’s backing object file. See Objfiles In Guile.
- Scheme Procedure: symtab-global-block symtab
-
Return the global block of the underlying symbol table.
See Blocks In Guile.
- Scheme Procedure: symtab-static-block symtab
-
Return the static block of the underlying symbol table.
See Blocks In Guile.
The following symtab-and-line-related procedures are provided by the
(gdb) module:
- Scheme Procedure: sal? object
-
Return
#tif object is an object of type<gdb:sal>.
Otherwise return#f.
- Scheme Procedure: sal-valid? sal
-
Return
#tif sal is valid,#fif not.
A<gdb:sal>object becomes invalid when the Symbol table object
it refers to no longer exists in GDB. All other
<gdb:sal>procedures will throw an exception if it is
invalid at the time the procedure is called.
- Scheme Procedure: sal-symtab sal
-
Return the symbol table object (
<gdb:symtab>) for sal.
- Scheme Procedure: sal-line sal
-
Return the line number for sal.
- Scheme Procedure: sal-pc sal
-
Return the start of the address range occupied by code for sal.
- Scheme Procedure: sal-last sal
-
Return the end of the address range occupied by code for sal.
- Scheme Procedure: find-pc-line pc
-
Return the
<gdb:sal>object corresponding to the pc value.
If an invalid value of pc is passed as an argument, then the
symtabandlineattributes of the returned<gdb:sal>
object will be#fand 0 respectively.
23.4.3.19 Manipulating breakpoints using Guile
Breakpoints in Guile are represented by objects of type
<gdb:breakpoint>. New breakpoints can be created with the
make-breakpoint Guile function, and then added to GDB with the
register-breakpoint! Guile function.
This two-step approach is taken to separate out the side-effect of adding
the breakpoint to GDB from make-breakpoint.
Support is also provided to view and manipulate breakpoints created
outside of Guile.
The following breakpoint-related procedures are provided by the
(gdb) module:
- Scheme Procedure: make-breakpoint location [#:type type] [#:wp-class wp-class] [#:internal internal] [#:temporary temporary]
-
Create a new breakpoint at location, a string naming the
location of the breakpoint, or an expression that defines a watchpoint.
The contents can be any location recognized by thebreakcommand,
or in the case of a watchpoint, by thewatchcommand.The breakpoint is initially marked as ‘invalid’.
The breakpoint is not usable until it has been registered with GDB
withregister-breakpoint!, at which point it becomes ‘valid’.
The result is the<gdb:breakpoint>object representing the breakpoint.The optional type denotes the breakpoint to create.
This argument can be eitherBP_BREAKPOINTorBP_WATCHPOINT,
and defaults toBP_BREAKPOINT.The optional wp-class argument defines the class of watchpoint to
create, if type isBP_WATCHPOINT. If a watchpoint class is
not provided, it is assumed to be aWP_WRITEclass.The optional internal argument allows the breakpoint to become
invisible to the user. The breakpoint will neither be reported when
registered, nor will it be listed in the output frominfo breakpoints
(but will be listed with themaint info breakpointscommand).
If an internal flag is not provided, the breakpoint is visible
(non-internal).The optional temporary argument makes the breakpoint a temporary
breakpoint. Temporary breakpoints are deleted after they have been hit,
after which the Guile breakpoint is no longer usable (although it may be
re-registered withregister-breakpoint!).When a watchpoint is created, GDB will try to create a
hardware assisted watchpoint. If successful, the type of the watchpoint
is changed fromBP_WATCHPOINTtoBP_HARDWARE_WATCHPOINT
forWP_WRITE,BP_READ_WATCHPOINTforWP_READ,
andBP_ACCESS_WATCHPOINTforWP_ACCESS.
If not successful, the type of the watchpoint is left asWP_WATCHPOINT.The available types are represented by constants defined in the
gdb
module:BP_BREAKPOINT-
Normal code breakpoint.
BP_WATCHPOINT-
Watchpoint breakpoint.
BP_HARDWARE_WATCHPOINT-
Hardware assisted watchpoint.
This value cannot be specified when creating the breakpoint. BP_READ_WATCHPOINT-
Hardware assisted read watchpoint.
This value cannot be specified when creating the breakpoint. BP_ACCESS_WATCHPOINT-
Hardware assisted access watchpoint.
This value cannot be specified when creating the breakpoint. BP_CATCHPOINT-
Catchpoint.
This value cannot be specified when creating the breakpoint.
The available watchpoint types are represented by constants defined in the
(gdb)module:WP_READ-
Read only watchpoint.
WP_WRITE-
Write only watchpoint.
WP_ACCESS-
Read/Write watchpoint.
- Scheme Procedure: register-breakpoint! breakpoint
-
Add breakpoint, a
<gdb:breakpoint>object, to GDB’s
list of breakpoints. The breakpoint must have been created with
make-breakpoint. One cannot register breakpoints that have been
created outside of Guile. Once a breakpoint is registered it becomes
‘valid’.
It is an error to register an already registered breakpoint.
The result is unspecified.
- Scheme Procedure: delete-breakpoint! breakpoint
-
Remove breakpoint from GDB’s list of breakpoints.
This also invalidates the Guile breakpoint object.
Any further attempt to access the object will throw an exception.If breakpoint was created from Guile with
make-breakpoint
it may be re-registered with GDB, in which case the breakpoint
becomes valid again.
- Scheme Procedure: breakpoints
-
Return a list of all breakpoints.
Each element of the list is a<gdb:breakpoint>object.
- Scheme Procedure: breakpoint? object
-
Return
#tif object is a<gdb:breakpoint>object,
and#fotherwise.
- Scheme Procedure: breakpoint-valid? breakpoint
-
Return
#tif breakpoint is valid,#fotherwise.
Breakpoints created withmake-breakpointare marked as invalid
until they are registered with GDB withregister-breakpoint!.
A<gdb:breakpoint>object can become invalid
if the user deletes the breakpoint. In this case, the object still
exists, but the underlying breakpoint does not. In the cases of
watchpoint scope, the watchpoint remains valid even if execution of the
inferior leaves the scope of that watchpoint.
- Scheme Procedure: breakpoint-number breakpoint
-
Return the breakpoint’s number — the identifier used by
the user to manipulate the breakpoint.
- Scheme Procedure: breakpoint-temporary? breakpoint
-
Return
#tif the breakpoint was created as a temporary
breakpoint. Temporary breakpoints are automatically deleted after
they’ve been hit. Calling this procedure, and all other procedures
other thanbreakpoint-valid?andregister-breakpoint!,
will result in an error after the breakpoint has been hit (since it has
been automatically deleted).
- Scheme Procedure: breakpoint-type breakpoint
-
Return the breakpoint’s type — the identifier used to
determine the actual breakpoint type or use-case.
- Scheme Procedure: breakpoint-visible? breakpoint
-
Return
#tif the breakpoint is visible to the user
when hit, or when the ‘info breakpoints’ command is run.
Otherwise return#f.
- Scheme Procedure: breakpoint-location breakpoint
-
Return the location of the breakpoint, as specified by
the user. It is a string. If the breakpoint does not have a location
(that is, it is a watchpoint) return#f.
- Scheme Procedure: breakpoint-expression breakpoint
-
Return the breakpoint expression, as specified by the user. It is a string.
If the breakpoint does not have an expression (the breakpoint is not a
watchpoint) return#f.
- Scheme Procedure: breakpoint-enabled? breakpoint
-
Return
#tif the breakpoint is enabled, and#fotherwise.
- Scheme Procedure: set-breakpoint-enabled! breakpoint flag
-
Set the enabled state of breakpoint to flag.
If flag is#fit is disabled, otherwise it is enabled.
- Scheme Procedure: breakpoint-silent? breakpoint
-
Return
#tif the breakpoint is silent, and#fotherwise.Note that a breakpoint can also be silent if it has commands and the
first command issilent. This is not reported by the
silentattribute.
- Scheme Procedure: set-breakpoint-silent! breakpoint flag
-
Set the silent state of breakpoint to flag.
If flag is#fthe breakpoint is made silent,
otherwise it is made non-silent (or noisy).
- Scheme Procedure: breakpoint-ignore-count breakpoint
-
Return the ignore count for breakpoint.
- Scheme Procedure: set-breakpoint-ignore-count! breakpoint count
-
Set the ignore count for breakpoint to count.
- Scheme Procedure: breakpoint-hit-count breakpoint
-
Return hit count of breakpoint.
- Scheme Procedure: set-breakpoint-hit-count! breakpoint count
-
Set the hit count of breakpoint to count.
At present, count must be zero.
- Scheme Procedure: breakpoint-thread breakpoint
-
Return the global-thread-id for thread-specific breakpoint
breakpoint. Return #f if breakpoint is not
thread-specific.
- Scheme Procedure: set-breakpoint-thread! breakpoint global-thread-id|#f
-
Set the thread-id for breakpoint to global-thread-id If
set to#f, the breakpoint is no longer thread-specific.
- Scheme Procedure: breakpoint-task breakpoint
-
If the breakpoint is Ada task-specific, return the Ada task id.
If the breakpoint is not task-specific (or the underlying
language is not Ada), return#f.
- Scheme Procedure: set-breakpoint-task! breakpoint task
-
Set the Ada task of breakpoint to task.
If set to#f, the breakpoint is no longer task-specific.
- Scheme Procedure: breakpoint-condition breakpoint
-
Return the condition of breakpoint, as specified by the user.
It is a string. If there is no condition, return#f.
- Scheme Procedure: set-breakpoint-condition! breakpoint condition
-
Set the condition of breakpoint to condition,
which must be a string. If set to#fthen the breakpoint
becomes unconditional.
- Scheme Procedure: breakpoint-stop breakpoint
-
Return the stop predicate of breakpoint.
Seeset-breakpoint-stop!below in this section.
- Scheme Procedure: set-breakpoint-stop! breakpoint procedure|#f
-
Set the stop predicate of breakpoint. The predicate
procedure takes one argument: the <gdb:breakpoint> object.
If this predicate is set to a procedure then it is invoked whenever
the inferior reaches this breakpoint. If it returns#t,
or any non-#fvalue, then the inferior is stopped,
otherwise the inferior will continue.If there are multiple breakpoints at the same location with a
stoppredicate, each one will be called regardless of the
return status of the previous. This ensures that allstop
predicates have a chance to execute at that location. In this scenario
if one of the methods returns#tbut the others return
#f, the inferior will still be stopped.You should not alter the execution state of the inferior (i.e., step,
next, etc.), alter the current frame context (i.e., change the current
active frame), or alter, add or delete any breakpoint. As a general
rule, you should not alter any data within GDB or the inferior
at this time.Example
stopimplementation:(define (my-stop? bkpt) (let ((int-val (parse-and-eval "foo"))) (value=? int-val 3))) (define bkpt (make-breakpoint "main.c:42")) (register-breakpoint! bkpt) (set-breakpoint-stop! bkpt my-stop?)
- Scheme Procedure: breakpoint-commands breakpoint
-
Return the commands attached to breakpoint as a string,
or#fif there are none.
23.4.3.20 Guile representation of lazy strings.
A lazy string is a string whose contents is not retrieved or
encoded until it is needed.
A <gdb:lazy-string> is represented in GDB as an
address that points to a region of memory, an encoding
that will be used to encode that region of memory, and a length
to delimit the region of memory that represents the string. The
difference between a <gdb:lazy-string> and a string wrapped within
a <gdb:value> is that a <gdb:lazy-string> will be treated
differently by GDB when printing. A <gdb:lazy-string> is
retrieved and encoded during printing, while a <gdb:value>
wrapping a string is immediately retrieved and encoded on creation.
The following lazy-string-related procedures are provided by the
(gdb) module:
- Scheme Procedure: lazy-string? object
-
Return
#tif object is an object of type<gdb:lazy-string>.
Otherwise return#f.
- Scheme Procedure: lazy-string-address lazy-sring
-
Return the address of lazy-string.
- Scheme Procedure: lazy-string-length lazy-string
-
Return the length of lazy-string in characters. If the
length is -1, then the string will be fetched and encoded up to the
first null of appropriate width.
- Scheme Procedure: lazy-string-encoding lazy-string
-
Return the encoding that will be applied to lazy-string
when the string is printed by GDB. If the encoding is not
set, or contains an empty string, then GDB will select the
most appropriate encoding when the string is printed.
- Scheme Procedure: lazy-string-type lazy-string
-
Return the type that is represented by lazy-string’s type.
For a lazy string this is a pointer or array type. To
resolve this to the lazy string’s character type, usetype-target-type.
See Types In Guile.
- Scheme Procedure: lazy-string->value lazy-string
-
Convert the
<gdb:lazy-string>to a<gdb:value>. This value
will point to the string in memory, but will lose all the delayed
retrieval, encoding and handling that GDB applies to a
<gdb:lazy-string>.
23.4.3.21 Guile representation of architectures
GDB uses architecture specific parameters and artifacts in a
number of its various computations. An architecture is represented
by an instance of the <gdb:arch> class.
The following architecture-related procedures are provided by the
(gdb) module:
- Scheme Procedure: arch? object
-
Return
#tif object is an object of type<gdb:arch>.
Otherwise return#f.
- Scheme Procedure: current-arch
-
Return the current architecture as a
<gdb:arch>object.
- Scheme Procedure: arch-name arch
-
Return the name (string value) of
<gdb:arch>arch.
- Scheme Procedure: arch-charset arch
-
Return name of target character set of
<gdb:arch>arch.
- Scheme Procedure: arch-wide-charset
-
Return name of target wide character set of
<gdb:arch>arch.
Each architecture provides a set of predefined types, obtained by
the following functions.
- Scheme Procedure: arch-void-type arch
-
Return the
<gdb:type>object for avoidtype
of architecture arch.
- Scheme Procedure: arch-char-type arch
-
Return the
<gdb:type>object for achartype
of architecture arch.
- Scheme Procedure: arch-short-type arch
-
Return the
<gdb:type>object for ashorttype
of architecture arch.
- Scheme Procedure: arch-int-type arch
-
Return the
<gdb:type>object for aninttype
of architecture arch.
- Scheme Procedure: arch-long-type arch
-
Return the
<gdb:type>object for alongtype
of architecture arch.
- Scheme Procedure: arch-schar-type arch
-
Return the
<gdb:type>object for asigned chartype
of architecture arch.
- Scheme Procedure: arch-uchar-type arch
-
Return the
<gdb:type>object for anunsigned chartype
of architecture arch.
- Scheme Procedure: arch-ushort-type arch
-
Return the
<gdb:type>object for anunsigned shorttype
of architecture arch.
- Scheme Procedure: arch-uint-type arch
-
Return the
<gdb:type>object for anunsigned inttype
of architecture arch.
- Scheme Procedure: arch-ulong-type arch
-
Return the
<gdb:type>object for anunsigned longtype
of architecture arch.
- Scheme Procedure: arch-float-type arch
-
Return the
<gdb:type>object for afloattype
of architecture arch.
- Scheme Procedure: arch-double-type arch
-
Return the
<gdb:type>object for adoubletype
of architecture arch.
- Scheme Procedure: arch-longdouble-type arch
-
Return the
<gdb:type>object for along doubletype
of architecture arch.
- Scheme Procedure: arch-bool-type arch
-
Return the
<gdb:type>object for abooltype
of architecture arch.
- Scheme Procedure: arch-longlong-type arch
-
Return the
<gdb:type>object for along longtype
of architecture arch.
- Scheme Procedure: arch-ulonglong-type arch
-
Return the
<gdb:type>object for anunsigned long longtype
of architecture arch.
- Scheme Procedure: arch-int8-type arch
-
Return the
<gdb:type>object for anint8type
of architecture arch.
- Scheme Procedure: arch-uint8-type arch
-
Return the
<gdb:type>object for auint8type
of architecture arch.
- Scheme Procedure: arch-int16-type arch
-
Return the
<gdb:type>object for anint16type
of architecture arch.
- Scheme Procedure: arch-uint16-type arch
-
Return the
<gdb:type>object for auint16type
of architecture arch.
- Scheme Procedure: arch-int32-type arch
-
Return the
<gdb:type>object for anint32type
of architecture arch.
- Scheme Procedure: arch-uint32-type arch
-
Return the
<gdb:type>object for auint32type
of architecture arch.
- Scheme Procedure: arch-int64-type arch
-
Return the
<gdb:type>object for anint64type
of architecture arch.
- Scheme Procedure: arch-uint64-type arch
-
Return the
<gdb:type>object for auint64type
of architecture arch.
Example:
(gdb) guile (type-name (arch-uchar-type (current-arch))) "unsigned char"
23.4.3.22 Disassembly In Guile
The disassembler can be invoked from Scheme code.
Furthermore, the disassembler can take a Guile port as input,
allowing one to disassemble from any source, and not just target memory.
- Scheme Procedure: arch-disassemble arch start-pc [#:port port] [#:offset offset] [#:size size] [#:count count]
-
Return a list of disassembled instructions starting from the memory
address start-pc.The optional argument port specifies the input port to read bytes from.
If port is#fthen bytes are read from target memory.The optional argument offset specifies the address offset of the
first byte in port. This is useful, for example, when port
specifies a ‘bytevector’ and you want the bytevector to be disassembled
as if it came from that address. The start-pc passed to the reader
for port is offset by the same amount.Example:
(gdb) guile (use-modules (rnrs io ports)) (gdb) guile (define pc (value->integer (parse-and-eval "$pc"))) (gdb) guile (define mem (open-memory #:start pc)) (gdb) guile (define bv (get-bytevector-n mem 10)) (gdb) guile (define bv-port (open-bytevector-input-port bv)) (gdb) guile (define arch (current-arch)) (gdb) guile (arch-disassemble arch pc #:port bv-port #:offset pc) (((address . 4195516) (asm . "mov $0x4005c8,%edi") (length . 5)))
The optional arguments size and
count determine the number of instructions in the returned list.
If either size or count is specified as zero, then
no instructions are disassembled and an empty list is returned.
If both the optional arguments size and count are
specified, then a list of at most count disassembled instructions
whose start address falls in the closed memory address interval from
start-pc to (start-pc + size — 1) are returned.
If size is not specified, but count is specified,
then count number of instructions starting from the address
start-pc are returned. If count is not specified but
size is specified, then all instructions whose start address
falls in the closed memory address interval from start-pc to
(start-pc + size — 1) are returned.
If neither size nor count are specified, then a single
instruction at start-pc is returned.Each element of the returned list is an alist (associative list)
with the following keys:address-
The value corresponding to this key is a Guile integer of
the memory address of the instruction. asm-
The value corresponding to this key is a string value which represents
the instruction with assembly language mnemonics. The assembly
language flavor used is the same as that specified by the current CLI
variabledisassembly-flavor. See Machine Code. length-
The value corresponding to this key is the length of the instruction in bytes.
23.4.3.23 I/O Ports in Guile
- Scheme Procedure: input-port
-
Return GDB’s input port as a Guile port object.
- Scheme Procedure: output-port
-
Return GDB’s output port as a Guile port object.
- Scheme Procedure: error-port
-
Return GDB’s error port as a Guile port object.
- Scheme Procedure: stdio-port? object
-
Return
#tif object is a GDB stdio port.
Otherwise return#f.
23.4.3.24 Memory Ports in Guile
GDB provides a port interface to target memory.
This allows Guile code to read/write target memory using Guile’s port and
bytevector functionality. The main routine is open-memory which
returns a port object. One can then read/write memory using that object.
- Scheme Procedure: open-memory [#:mode mode] [#:start address] [#:size size]
-
Return a port object that can be used for reading and writing memory.
The port will be open according to mode, which is the standard
mode argument to Guile port open routines, except that the ‘«a»’
and ‘«l»’ modes are not supported.
See File Ports in GNU Guile Reference Manual.
The ‘«b»’ (binary) character may be present, but is ignored:
memory ports are binary only. If ‘«0»’ is appended then
the port is marked as unbuffered.
The default is ‘«r»’, read-only and buffered.The chunk of memory that can be accessed can be bounded.
If both start and size are unspecified, all of memory can be
accessed. If only start is specified, all of memory from that point
on can be accessed. If only size if specified, all memory in the
range [0,size) can be accessed. If both are specified, all memory
in the rane [start,start+size) can be accessed.
- Scheme Procedure: memory-port?
-
Return
#tif object is an object of type<gdb:memory-port>.
Otherwise return#f.
- Scheme Procedure: memory-port-range memory-port
-
Return the range of
<gdb:memory-port>memory-port as a list
of two elements:(start end). The range is start to end
inclusive.
- Scheme Procedure: memory-port-read-buffer-size memory-port
-
Return the size of the read buffer of
<gdb:memory-port>
memory-port.This procedure is deprecated and will be removed in GDB 11.
It returns 0 when using Guile 2.2 or later.
- Scheme Procedure: set-memory-port-read-buffer-size! memory-port size
-
Set the size of the read buffer of
<gdb:memory-port>
memory-port to size. The result is unspecified.This procedure is deprecated and will be removed in GDB 11.
When GDB is built with Guile 2.2 or later, you can call
setvbufinstead (seesetvbufin GNU
Guile Reference Manual).
- Scheme Procedure: memory-port-write-buffer-size memory-port
-
Return the size of the write buffer of
<gdb:memory-port>
memory-port.This procedure is deprecated and will be removed in GDB 11.
It returns 0 when GDB is built with Guile 2.2 or later.
- Scheme Procedure: set-memory-port-write-buffer-size! memory-port size
-
Set the size of the write buffer of
<gdb:memory-port>
memory-port to size. The result is unspecified.This procedure is deprecated and will be removed in GDB 11.
When GDB is built with Guile 2.2 or later, you can call
setvbufinstead.
A memory port is closed like any other port, with close-port.
Combined with Guile’s bytevectors, memory ports provide a lot
of utility. For example, to fill a buffer of 10 integers in memory,
one can do something like the following.
;; In the program: int buffer[10];
(use-modules (rnrs bytevectors))
(use-modules (rnrs io ports))
(define addr (parse-and-eval "buffer"))
(define n 10)
(define byte-size (* n 4))
(define mem-port (open-memory #:mode "r+" #:start
(value->integer addr) #:size byte-size))
(define byte-vec (make-bytevector byte-size))
(do ((i 0 (+ i 1)))
((>= i n))
(bytevector-s32-native-set! byte-vec (* i 4) (* i 42)))
(put-bytevector mem-port byte-vec)
(close-port mem-port)
23.4.3.25 Iterators In Guile
A simple iterator facility is provided to allow, for example,
iterating over the set of program symbols without having to first
construct a list of all of them. A useful contribution would be
to add support for SRFI 41 and SRFI 45.
- Scheme Procedure: make-iterator object progress next!
-
A
<gdb:iterator>object is constructed with themake-iterator
procedure. It takes three arguments: the object to be iterated over,
an object to record the progress of the iteration, and a procedure to
return the next element in the iteration, or an implementation chosen value
to denote the end of iteration.By convention, end of iteration is marked with
(end-of-iteration),
and may be tested with theend-of-iteration?predicate.
The result of(end-of-iteration)is chosen so that it is not
otherwise used by the(gdb)module. If you are using
<gdb:iterator>in your own code it is your responsibility to
maintain this invariant.A trivial example for illustration’s sake:
(use-modules (gdb iterator)) (define my-list (list 1 2 3)) (define iter (make-iterator my-list my-list (lambda (iter) (let ((l (iterator-progress iter))) (if (eq? l '()) (end-of-iteration) (begin (set-iterator-progress! iter (cdr l)) (car l)))))))Here is a slightly more realistic example, which computes a list of all the
functions inmy-global-block.(use-modules (gdb iterator)) (define this-sal (find-pc-line (frame-pc (selected-frame)))) (define this-symtab (sal-symtab this-sal)) (define this-global-block (symtab-global-block this-symtab)) (define syms-iter (make-block-symbols-iterator this-global-block)) (define functions (iterator-filter symbol-function? syms-iter))
- Scheme Procedure: iterator? object
-
Return
#tif object is a<gdb:iterator>object.
Otherwise return#f.
- Scheme Procedure: iterator-object iterator
-
Return the first argument that was passed to
make-iterator.
This is the object being iterated over.
- Scheme Procedure: iterator-progress iterator
-
Return the object tracking iteration progress.
- Scheme Procedure: set-iterator-progress! iterator new-value
-
Set the object tracking iteration progress.
- Scheme Procedure: iterator-next! iterator
-
Invoke the procedure that was the third argument to
make-iterator,
passing it one argument, the<gdb:iterator>object.
The result is either the next element in the iteration, or an end
marker as implemented by thenext!procedure.
By convention the end marker is the result of(end-of-iteration).
- Scheme Procedure: end-of-iteration
-
Return the Scheme object that denotes end of iteration.
- Scheme Procedure: end-of-iteration? object
-
Return
#tif object is the end of iteration marker.
Otherwise return#f.
These functions are provided by the (gdb iterator) module to
assist in using iterators.
- Scheme Procedure: make-list-iterator list
-
Return a
<gdb:iterator>object that will iterate over list.
- Scheme Procedure: iterator->list iterator
-
Return the elements pointed to by iterator as a list.
- Scheme Procedure: iterator-map proc iterator
-
Return the list of objects obtained by applying proc to the object
pointed to by iterator and to each subsequent object.
- Scheme Procedure: iterator-for-each proc iterator
-
Apply proc to each element pointed to by iterator.
The result is unspecified.
- Scheme Procedure: iterator-filter pred iterator
-
Return the list of elements pointed to by iterator that satisfy
pred.
- Scheme Procedure: iterator-until pred iterator
-
Run iterator until the result of
(pred element)is true
and return that as the result. Otherwise return#f.
23.4.4 Guile Auto-loading
When a new object file is read (for example, due to the file
command, or because the inferior has loaded a shared library),
GDB will look for Guile support scripts in two ways:
objfile-gdb.scm and the .debug_gdb_scripts section.
See Auto-loading extensions.
The auto-loading feature is useful for supplying application-specific
debugging commands and scripts.
Auto-loading can be enabled or disabled,
and the list of auto-loaded scripts can be printed.
set auto-load guile-scripts [on|off]-
Enable or disable the auto-loading of Guile scripts.
show auto-load guile-scripts-
Show whether auto-loading of Guile scripts is enabled or disabled.
info auto-load guile-scripts [regexp]-
Print the list of all Guile scripts that GDB auto-loaded.
Also printed is the list of Guile scripts that were mentioned in
the.debug_gdb_scriptssection and were not found.
This is useful because their names are not printed when GDB
tries to load them and fails. There may be many of them, and printing
an error message for each one is problematic.If regexp is supplied only Guile scripts with matching names are printed.
Example:
(gdb) info auto-load guile-scripts Loaded Script Yes scm-section-script.scm full name: /tmp/scm-section-script.scm No my-foo-pretty-printers.scm
When reading an auto-loaded file, GDB sets the
current objfile. This is available via the current-objfile
procedure (see Objfiles In Guile). This can be useful for
registering objfile-specific pretty-printers.
23.4.5 Guile Modules
GDB comes with several modules to assist writing Guile code.
23.4.5.1 Guile Printing Module
This module provides a collection of utilities for working with
pretty-printers.
Usage:
(use-modules (gdb printing))
- Scheme Procedure: prepend-pretty-printer! object printer
-
Add printer to the front of the list of pretty-printers for
object. The object must either be a<gdb:objfile>object,
or#fin which case printer is added to the global list of
printers.
- Scheme Procecure: append-pretty-printer! object printer
-
Add printer to the end of the list of pretty-printers for
object. The object must either be a<gdb:objfile>object,
or#fin which case printer is added to the global list of
printers.
23.4.5.2 Guile Types Module
This module provides a collection of utilities for working with
<gdb:type> objects.
Usage:
(use-modules (gdb types))
- Scheme Procedure: get-basic-type type
-
Return type with const and volatile qualifiers stripped,
and with typedefs and C++ references converted to the underlying type.C++ example:
typedef const int const_int; const_int foo (3); const_int& foo_ref (foo); int main () { return 0; }Then in gdb:
(gdb) start (gdb) guile (use-modules (gdb) (gdb types)) (gdb) guile (define foo-ref (parse-and-eval "foo_ref")) (gdb) guile (get-basic-type (value-type foo-ref)) int
- Scheme Procedure: type-has-field-deep? type field
-
Return
#tif type, assumed to be a type with fields
(e.g., a structure or union), has field field.
Otherwise return#f.
This searches baseclasses, whereastype-has-field?does not.
- Scheme Procedure: make-enum-hashtable enum-type
-
Return a Guile hash table produced from enum-type.
Elements in the hash table are referenced withhashq-ref.
23.5 Auto-loading extensions
GDB provides two mechanisms for automatically loading
extensions when a new object file is read (for example, due to the
file command, or because the inferior has loaded a shared
library): objfile-gdb.ext (see The objfile-gdb.ext file) and the
.debug_gdb_scripts section of modern file formats like ELF
(see The .debug_gdb_scripts
section). For a discussion of the differences between these two
approaches see Which flavor to choose?.
The auto-loading feature is useful for supplying application-specific
debugging commands and features.
Auto-loading can be enabled or disabled,
and the list of auto-loaded scripts can be printed.
See the ‘auto-loading’ section of each extension language
for more information.
For GDB command files see Auto-loading sequences.
For Python files see Python Auto-loading.
Note that loading of this script file also requires accordingly configured
auto-load safe-path (see Auto-loading safe path).
23.5.1 The objfile-gdb.ext file
When a new object file is read, GDB looks for a file named
objfile-gdb.ext (we call it script-name below),
where objfile is the object file’s name and
where ext is the file extension for the extension language:
objfile-gdb.gdb-
GDB’s own command language
objfile-gdb.py-
Python
objfile-gdb.scm-
Guile
script-name is formed by ensuring that the file name of objfile
is absolute, following all symlinks, and resolving . and ..
components, and appending the -gdb.ext suffix.
If this file exists and is readable, GDB will evaluate it as a
script in the specified extension language.
If this file does not exist, then GDB will look for
script-name file in all of the directories as specified below.
(On MS-Windows/MS-DOS, the drive letter of the executable’s leading
directories is converted to a one-letter subdirectory, i.e.
d:/usr/bin/ is converted to /d/usr/bin/, because Windows
filesystems disallow colons in file names.)
Note that loading of these files requires an accordingly configured
auto-load safe-path (see Auto-loading safe path).
For object files using .exe suffix GDB tries to load first the
scripts normally according to its .exe filename. But if no scripts are
found GDB also tries script filenames matching the object file without
its .exe suffix. This .exe stripping is case insensitive and it
is attempted on any platform. This makes the script filenames compatible
between Unix and MS-Windows hosts.
set auto-load scripts-directory [directories]-
Control GDB auto-loaded scripts location. Multiple directory entries
may be delimited by the host platform path separator in use
(‘:’ on Unix, ‘;’ on MS-Windows and MS-DOS).Each entry here needs to be covered also by the security setting
set auto-load safe-path(see set auto-load safe-path).This variable defaults to $debugdir:$datadir/auto-load. The default
set auto-load safe-pathvalue can be also overriden by GDB
configuration option —with-auto-load-dir.Any reference to $debugdir will get replaced by
debug-file-directory value (see Separate Debug Files) and any
reference to $datadir will get replaced by data-directory which is
determined at GDB startup (see Data Files). $debugdir and
$datadir must be placed as a directory component — either alone or
delimited by / or directory separators, depending on the host
platform.The list of directories uses path separator (‘:’ on GNU and Unix
systems, ‘;’ on MS-Windows and MS-DOS) to separate directories, similarly
to thePATHenvironment variable. show auto-load scripts-directory-
Show GDB auto-loaded scripts location.
add-auto-load-scripts-directory [directories…]-
Add an entry (or list of entries) to the list of auto-loaded scripts locations.
Multiple entries may be delimited by the host platform path separator in use.
GDB does not track which files it has already auto-loaded this way.
GDB will load the associated script every time the corresponding
objfile is opened.
So your -gdb.ext file should be careful to avoid errors if it
is evaluated more than once.
23.5.2 The .debug_gdb_scripts section
For systems using file formats like ELF and COFF,
when GDB loads a new object file
it will look for a special section named .debug_gdb_scripts.
If this section exists, its contents is a list of null-terminated entries
specifying scripts to load. Each entry begins with a non-null prefix byte that
specifies the kind of entry, typically the extension language and whether the
script is in a file or inlined in .debug_gdb_scripts.
The following entries are supported:
SECTION_SCRIPT_ID_PYTHON_FILE = 1SECTION_SCRIPT_ID_SCHEME_FILE = 3SECTION_SCRIPT_ID_PYTHON_TEXT = 4SECTION_SCRIPT_ID_SCHEME_TEXT = 6
23.5.2.1 Script File Entries
If the entry specifies a file, GDB will look for the file first
in the current directory and then along the source search path
(see Specifying Source Directories),
except that $cdir is not searched, since the compilation
directory is not relevant to scripts.
File entries can be placed in section .debug_gdb_scripts with,
for example, this GCC macro for Python scripts.
/* Note: The "MS" section flags are to remove duplicates. */
#define DEFINE_GDB_PY_SCRIPT(script_name)
asm("
.pushsection ".debug_gdb_scripts", "MS",@progbits,1n
.byte 1 /* Python */n
.asciz "" script_name ""n
.popsection n
");
For Guile scripts, replace .byte 1 with .byte 3.
Then one can reference the macro in a header or source file like this:
DEFINE_GDB_PY_SCRIPT ("my-app-scripts.py")
The script name may include directories if desired.
Note that loading of this script file also requires accordingly configured
auto-load safe-path (see Auto-loading safe path).
If the macro invocation is put in a header, any application or library
using this header will get a reference to the specified script,
and with the use of "MS" attributes on the section, the linker
will remove duplicates.
23.5.2.2 Script Text Entries
Script text entries allow to put the executable script in the entry
itself instead of loading it from a file.
The first line of the entry, everything after the prefix byte and up to
the first newline (0xa) character, is the script name, and must not
contain any kind of space character, e.g., spaces or tabs.
The rest of the entry, up to the trailing null byte, is the script to
execute in the specified language. The name needs to be unique among
all script names, as GDB executes each script only once based
on its name.
Here is an example from file py-section-script.c in the GDB
testsuite.
#include "symcat.h"
#include "gdb/section-scripts.h"
asm(
".pushsection ".debug_gdb_scripts", "MS",@progbits,1n"
".byte " XSTRING (SECTION_SCRIPT_ID_PYTHON_TEXT) "n"
".ascii "gdb.inlined-script\n"n"
".ascii "class test_cmd (gdb.Command):\n"n"
".ascii " def __init__ (self):\n"n"
".ascii " super (test_cmd, self).__init__ ("
"\"test-cmd\", gdb.COMMAND_OBSCURE)\n"n"
".ascii " def invoke (self, arg, from_tty):\n"n"
".ascii " print (\"test-cmd output, arg = %s\" % arg)\n"n"
".ascii "test_cmd ()\n"n"
".byte 0n"
".popsectionn"
);
Loading of inlined scripts requires a properly configured
auto-load safe-path (see Auto-loading safe path).
The path to specify in auto-load safe-path is the path of the file
containing the .debug_gdb_scripts section.
23.5.3 Which flavor to choose?
Given the multiple ways of auto-loading extensions, it might not always
be clear which one to choose. This section provides some guidance.
Benefits of the -gdb.ext way:
- Can be used with file formats that don’t support multiple sections.
- Ease of finding scripts for public libraries.
Scripts specified in the
.debug_gdb_scriptssection are searched for
in the source search path.
For publicly installed libraries, e.g., libstdc++, there typically
isn’t a source directory in which to find the script. - Doesn’t require source code additions.
Benefits of the .debug_gdb_scripts way:
- Works with static linking.
Scripts for libraries done the -gdb.ext way require an objfile to
trigger their loading. When an application is statically linked the only
objfile available is the executable, and it is cumbersome to attach all the
scripts from all the input libraries to the executable’s
-gdb.ext script. - Works with classes that are entirely inlined.
Some classes can be entirely inlined, and thus there may not be an associated
shared library to attach a -gdb.ext script to. - Scripts needn’t be copied out of the source tree.
In some circumstances, apps can be built out of large collections of internal
libraries, and the build infrastructure necessary to install the
-gdb.ext scripts in a place where GDB can find them is
cumbersome. It may be easier to specify the scripts in the
.debug_gdb_scriptssection as relative paths, and add a path to the
top of the source tree to the source search path.
23.6 Multiple Extension Languages
The Guile and Python extension languages do not share any state,
and generally do not interfere with each other.
There are some things to be aware of, however.
23.6.1 Python comes first
Python was GDB’s first extension language, and to avoid breaking
existing behaviour Python comes first. This is generally solved by the
“first one wins” principle. GDB maintains a list of enabled
extension languages, and when it makes a call to an extension language,
(say to pretty-print a value), it tries each in turn until an extension
language indicates it has performed the request (e.g., has returned the
pretty-printed form of a value).
This extends to errors while performing such requests: If an error happens
while, for example, trying to pretty-print an object then the error is
reported and any following extension languages are not tried.
24 Command Interpreters
GDB supports multiple command interpreters, and some command
infrastructure to allow users or user interface writers to switch
between interpreters or run commands in other interpreters.
GDB currently supports two command interpreters, the console
interpreter (sometimes called the command-line interpreter or CLI)
and the machine interface interpreter (or GDB/MI). This manual
describes both of these interfaces in great detail.
By default, GDB will start with the console interpreter.
However, the user may choose to start GDB with another
interpreter by specifying the -i or —interpreter
startup options. Defined interpreters include:
console-
The traditional console or command-line interpreter. This is the most often
used interpreter with GDB. With no interpreter specified at runtime,
GDB will use this interpreter. mi-
The newest GDB/MI interface (currently
mi3). Used primarily
by programs wishing to use GDB as a backend for a debugger GUI
or an IDE. For more information, see The GDB/MI
Interface. mi3-
The GDB/MI interface introduced in GDB 9.1.
mi2-
The GDB/MI interface introduced in GDB 6.0.
mi1-
The GDB/MI interface introduced in GDB 5.1.
You may execute commands in any interpreter from the current
interpreter using the appropriate command. If you are running the
console interpreter, simply use the interpreter-exec command:
interpreter-exec mi "-data-list-register-names"
GDB/MI has a similar command, although it is only available in versions of
GDB which support GDB/MI version 2 (or greater).
Note that interpreter-exec only changes the interpreter for the
duration of the specified command. It does not change the interpreter
permanently.
Although you may only choose a single interpreter at startup, it is
possible to run an independent interpreter on a specified input/output
device (usually a tty).
For example, consider a debugger GUI or IDE that wants to provide a
GDB console view. It may do so by embedding a terminal
emulator widget in its GUI, starting GDB in the traditional
command-line mode with stdin/stdout/stderr redirected to that
terminal, and then creating an MI interpreter running on a specified
input/output device. The console interpreter created by GDB
at startup handles commands the user types in the terminal widget,
while the GUI controls and synchronizes state with GDB using
the separate MI interpreter.
To start a new secondary user interface running MI, use the
new-ui command:
The interpreter parameter specifies the interpreter to run.
This accepts the same values as the interpreter-exec command.
For example, ‘console’, ‘mi’, ‘mi2’, etc. The
tty parameter specifies the name of the bidirectional file the
interpreter uses for input/output, usually the name of a
pseudoterminal slave on Unix systems. For example:
(gdb) new-ui mi /dev/pts/9
runs an MI interpreter on /dev/pts/9.
25 GDB Text User Interface
The GDB Text User Interface (TUI) is a terminal
interface which uses the curses library to show the source
file, the assembly output, the program registers and GDB
commands in separate text windows. The TUI mode is supported only
on platforms where a suitable version of the curses library
is available.
The TUI mode is enabled by default when you invoke GDB as
‘gdb -tui’.
You can also switch in and out of TUI mode while GDB runs by
using various TUI commands and key bindings, such as tui or C-x C-a. See TUI Commands, and
enable
TUI Key Bindings.
25.1 TUI Overview
In TUI mode, GDB can display several text windows:
- command
-
This window is the GDB command window with the GDB
prompt and the GDB output. The GDB input is still
managed using readline. - source
-
The source window shows the source file of the program. The current
line and active breakpoints are displayed in this window. - assembly
-
The assembly window shows the disassembly output of the program.
- register
-
This window shows the processor registers. Registers are highlighted
when their values change.
The source and assembly windows show the current program position by
highlighting the current line and marking it with a ‘>’ marker.
By default, source and assembly code styling is disabled for the
highlighted text, but you can enable it with the set style command. See Output Styling.
tui-current-position on
Breakpoints are indicated with two markers. The first marker
indicates the breakpoint type:
B-
Breakpoint which was hit at least once.
b-
Breakpoint which was never hit.
H-
Hardware breakpoint which was hit at least once.
h-
Hardware breakpoint which was never hit.
The second marker indicates whether the breakpoint is enabled or not:
+-
Breakpoint is enabled.
--
Breakpoint is disabled.
The source, assembly and register windows are updated when the current
thread changes, when the frame changes, or when the program counter
changes.
These windows are not all visible at the same time. The command
window is always visible. The others can be arranged in several
layouts:
- source only,
- assembly only,
- source and assembly,
- source and registers, or
- assembly and registers.
These are the standard layouts, but other layouts can be defined.
A status line above the command window shows the following information:
- target
-
Indicates the current GDB target.
(see Specifying a Debugging Target). - process
-
Gives the current process or thread number.
When no process is being debugged, this field is set toNo process. - function
-
Gives the current function name for the selected frame.
The name is demangled if demangling is turned on (see Print Settings).
When there is no symbol corresponding to the current program counter,
the string??is displayed. - line
-
Indicates the current line number for the selected frame.
When the current line number is not known, the string??is displayed. - pc
-
Indicates the current program counter address.
25.2 TUI Key Bindings
The TUI installs several key bindings in the readline keymaps
(see Command Line Editing).
The following key bindings are installed for both TUI mode and the
GDB standard mode.
- C-x C-a
- C-x a
- C-x A
-
Enter or leave the TUI mode. When leaving the TUI mode,
the curses window management stops and GDB operates using
its standard mode, writing on the terminal directly. When reentering
the TUI mode, control is given back to the curses windows.
The screen is then refreshed.This key binding uses the bindable Readline function
tui-switch-mode. - C-x 1
-
Use a TUI layout with only one window. The layout will
either be ‘source’ or ‘assembly’. When the TUI mode
is not active, it will switch to the TUI mode.Think of this key binding as the Emacs C-x 1 binding.
This key binding uses the bindable Readline function
tui-delete-other-windows. - C-x 2
-
Use a TUI layout with at least two windows. When the current
layout already has two windows, the next layout with two windows is used.
When a new layout is chosen, one window will always be common to the
previous layout and the new one.Think of it as the Emacs C-x 2 binding.
This key binding uses the bindable Readline function
tui-change-windows. - C-x o
-
Change the active window. The TUI associates several key bindings
(like scrolling and arrow keys) with the active window. This command
gives the focus to the next TUI window.Think of it as the Emacs C-x o binding.
This key binding uses the bindable Readline function
tui-other-window. - C-x s
-
Switch in and out of the TUI SingleKey mode that binds single
keys to GDB commands (see TUI Single Key Mode).This key binding uses the bindable Readline function
next-keymap.
The following key bindings only work in the TUI mode:
- PgUp
-
Scroll the active window one page up.
- PgDn
-
Scroll the active window one page down.
- Up
-
Scroll the active window one line up.
- Down
-
Scroll the active window one line down.
- Left
-
Scroll the active window one column left.
- Right
-
Scroll the active window one column right.
- C-L
-
Refresh the screen.
Because the arrow keys scroll the active window in the TUI mode, they
are not available for their normal use by readline unless the command
window has the focus. When another window is active, you must use
other readline key bindings such as C-p, C-n, C-b
and C-f to control the command window.
25.3 TUI Single Key Mode
The TUI also provides a SingleKey mode, which binds several
frequently used GDB commands to single keys. Type C-x s to
switch into this mode, where the following key bindings are used:
- c
-
continue
- d
-
down
- f
-
finish
- n
-
next
- o
-
nexti. The shortcut letter ‘o’ stands for “step Over”.
- q
-
exit the SingleKey mode.
- r
-
run
- s
-
step
- i
-
stepi. The shortcut letter ‘i’ stands for “step Into”.
- u
-
up
- v
-
info locals
- w
-
where
Other keys temporarily switch to the GDB command prompt.
The key that was pressed is inserted in the editing buffer so that
it is possible to type most GDB commands without interaction
with the TUI SingleKey mode. Once the command is entered the TUI
SingleKey mode is restored. The only way to permanently leave
this mode is by typing q or C-x s.
If GDB was built with Readline 8.0 or later, the TUI
SingleKey keymap will be named ‘SingleKey’. This can be used in
.inputrc to add additional bindings to this keymap.
25.4 TUI Mouse Support
If the curses library supports the mouse, the TUI supports mouse
actions.
The mouse wheel scrolls the appropriate window under the mouse cursor.
The TUI itself does not directly support copying/pasting with the
mouse. However, on Unix terminals, you can typically press and hold
the SHIFT key on your keyboard to temporarily bypass
GDB’s TUI and access the terminal’s native mouse copy/paste
functionality (commonly, click-drag-release or double-click to select
text, middle-click to paste). This copy/paste works with the
terminal’s selection buffer, as opposed to the TUI’s buffer.
25.5 TUI-specific Commands
The TUI has specific commands to control the text windows.
These commands are always available, even when GDB is not in
the TUI mode. When GDB is in the standard mode, most
of these commands will automatically switch to the TUI mode.
Note that if GDB’s stdout is not connected to a
terminal, or GDB has been started with the machine interface
interpreter (see The GDB/MI Interface), most of
these commands will fail with an error, because it would not be
possible or desirable to enable curses window management.
tui enable-
Activate TUI mode. The last active TUI window layout will be used if
TUI mode has previously been used in the current debugging session,
otherwise a default layout is used. tui disable-
Disable TUI mode, returning to the console interpreter.
info win-
List the names and sizes of all currently displayed windows.
tui new-layout name window weight [window weight…]-
Create a new TUI layout. The new layout will be named name, and
can be accessed using thelayoutcommand (see below).Each window parameter is either the name of a window to display,
or a window description. The windows will be displayed from top to
bottom in the order listed.The names of the windows are the same as the ones given to the
focuscommand (see below); additional, thestatus
window can be specified. Note that, because it is of fixed height,
the weight assigned to the status window is of no importance. It is
conventional to use ‘0’ here.A window description looks a bit like an invocation of
tui, and is of the form
new-layout
{[-horizontal]window weight [window weight…]}.This specifies a sub-layout. If
-horizontalis given, the
windows in this description will be arranged side-by-side, rather than
top-to-bottom.Each weight is an integer. It is the weight of this window
relative to all the other windows in the layout. These numbers are
used to calculate how much of the screen is given to each window.For example:
(gdb) tui new-layout example src 1 regs 1 status 0 cmd 1
Here, the new layout is called ‘example’. It shows the source
and register windows, followed by the status window, and then finally
the command window. The non-status windows all have the same weight,
so the terminal will be split into three roughly equal sections.Here is a more complex example, showing a horizontal layout:
(gdb) tui new-layout example {-horizontal src 1 asm 1} 2 status 0 cmd 1This will result in side-by-side source and assembly windows; with the
status and command window being beneath these, filling the entire
width of the terminal. Because they have weight 2, the source and
assembly windows will be twice the height of the command window. tui layout namelayout name-
Changes which TUI windows are displayed. The name parameter
controls which layout is shown. It can be either one of the built-in
layout names, or the name of a layout defined by the user using
tui new-layout.The built-in layouts are as follows:
next-
Display the next layout.
prev-
Display the previous layout.
src-
Display the source and command windows.
asm-
Display the assembly and command windows.
split-
Display the source, assembly, and command windows.
regs-
When in
srclayout display the register, source, and command
windows. When inasmorsplitlayout display the
register, assembler, and command windows.
tui focus namefocus name-
Changes which TUI window is currently active for scrolling. The
name parameter can be any of the following:next-
Make the next window active for scrolling.
prev-
Make the previous window active for scrolling.
src-
Make the source window active for scrolling.
asm-
Make the assembly window active for scrolling.
regs-
Make the register window active for scrolling.
cmd-
Make the command window active for scrolling.
tui refreshrefresh-
Refresh the screen. This is similar to typing C-L.
tui reg group-
Changes the register group displayed in the tui register window to
group. If the register window is not currently displayed this
command will cause the register window to be displayed. The list of
register groups, as well as their order is target specific. The
following groups are available on most targets:next-
Repeatedly selecting this group will cause the display to cycle
through all of the available register groups. prev-
Repeatedly selecting this group will cause the display to cycle
through all of the available register groups in the reverse order to
next. general-
Display the general registers.
float-
Display the floating point registers.
system-
Display the system registers.
vector-
Display the vector registers.
all-
Display all registers.
update-
Update the source window and the current execution point.
tui window height name +counttui window height name -countwinheight name +countwinheight name -count-
Change the height of the window name by count lines.
Positive counts increase the height, while negative counts decrease
it. The name parameter can be the name of any currently visible
window. The names of the currently visible windows can be discovered
using info win (see info win).The set of currently visible windows must always fill the terminal,
and so, it is only possible to resize on window if there are other
visible windows that can either give or receive the extra terminal
space. tui window width name +counttui window width name -countwinwidth name +countwinwidth name -count-
Change the width of the window name by count columns.
Positive counts increase the width, while negative counts decrease it.
The name parameter can be the name of any currently visible
window. The names of the currently visible windows can be discovered
usinginfo win(see info win).The set of currently visible windows must always fill the terminal,
and so, it is only possible to resize on window if there are other
visible windows that can either give or receive the extra terminal
space.
25.6 TUI Configuration Variables
Several configuration variables control the appearance of TUI windows.
set tui border-kind kind-
Select the border appearance for the source, assembly and register windows.
The possible values are the following:space-
Use a space character to draw the border.
ascii-
Use ASCII characters ‘+’, ‘—’ and ‘|’ to draw the border.
acs-
Use the Alternate Character Set to draw the border. The border is
drawn using character line graphics if the terminal supports them.
set tui border-mode modeset tui active-border-mode mode-
Select the display attributes for the borders of the inactive windows
or the active window. The mode can be one of the following:normal-
Use normal attributes to display the border.
standout-
Use standout mode.
reverse-
Use reverse video mode.
half-
Use half bright mode.
half-standout-
Use half bright and standout mode.
bold-
Use extra bright or bold mode.
bold-standout-
Use extra bright or bold and standout mode.
set tui tab-width nchars-
Set the width of tab stops to be nchars characters. This
setting affects the display of TAB characters in the source and
assembly windows. set tui compact-source [on|off]-
Set whether the TUI source window is displayed in “compact” form.
The default display uses more space for line numbers and starts the
source text at the next tab stop; the compact display uses only as
much space as is needed for the line numbers in the current file, and
only a single space to separate the line numbers from the source. set debug tui [on|off]-
Turn on or off display of GDB internal debug messages relating
to the TUI. show debug tui-
Show the current status of displaying GDB internal debug
messages relating to the TUI.
Note that the colors of the TUI borders can be controlled using the
appropriate set style commands. See Output Styling.
26 Using GDB under GNU Emacs
A special interface allows you to use GNU Emacs to view (and
edit) the source files for the program you are debugging with
GDB.
To use this interface, use the command M-x gdb in Emacs. Give the
executable file you want to debug as an argument. This command starts
GDB as a subprocess of Emacs, with input and output through a newly
created Emacs buffer.
Running GDB under Emacs can be just like running GDB normally except for two
things:
- All “terminal” input and output goes through an Emacs buffer, called
the GUD buffer.This applies both to GDB commands and their output, and to the input
and output done by the program you are debugging.This is useful because it means that you can copy the text of previous
commands and input them again; you can even use parts of the output
in this way.All the facilities of Emacs’ Shell mode are available for interacting
with your program. In particular, you can send signals the usual
way—for example, C-c C-c for an interrupt, C-c C-z for a
stop. - GDB displays source code through Emacs.
Each time GDB displays a stack frame, Emacs automatically finds the
source file for that frame and puts an arrow (‘=>’) at the
left margin of the current line. Emacs uses a separate buffer for
source display, and splits the screen to show both your GDB session
and the source.Explicit GDB
listor search commands still produce output as
usual, but you probably have no reason to use them from Emacs.
We call this text command mode. Emacs 22.1, and later, also uses
a graphical mode, enabled by default, which provides further buffers
that can control the execution and describe the state of your program.
See GDB Graphical Interface in The GNU Emacs Manual.
If you specify an absolute file name when prompted for the M-x
gdb argument, then Emacs sets your current working directory to where
your program resides. If you only specify the file name, then Emacs
sets your current working directory to the directory associated
with the previous buffer. In this case, GDB may find your
program by searching your environment’s PATH variable, but on
some operating systems it might not find the source. So, although the
GDB input and output session proceeds normally, the auxiliary
buffer does not display the current source and line of execution.
The initial working directory of GDB is printed on the top
line of the GUD buffer and this serves as a default for the commands
that specify files for GDB to operate on. See Commands to Specify Files.
By default, M-x gdb calls the program called gdb. If you
need to call GDB by a different name (for example, if you
keep several configurations around, with different names) you can
customize the Emacs variable gud-gdb-command-name to run the
one you want.
In the GUD buffer, you can use these special Emacs commands in
addition to the standard Shell mode commands:
- C-h m
-
Describe the features of Emacs’ GUD Mode.
- C-c C-s
-
Execute to another source line, like the GDB
stepcommand; also
update the display window to show the current file and location. - C-c C-n
-
Execute to next source line in this function, skipping all function
calls, like the GDBnextcommand. Then update the display window
to show the current file and location. - C-c C-i
-
Execute one instruction, like the GDB
stepicommand; update
display window accordingly. - C-c C-f
-
Execute until exit from the selected stack frame, like the GDB
finishcommand. - C-c C-r
-
Continue execution of your program, like the GDB
continue
command. - C-c <
-
Go up the number of frames indicated by the numeric argument
(see Numeric Arguments in The GNU Emacs Manual),
like the GDBupcommand. - C-c >
-
Go down the number of frames indicated by the numeric argument, like the
GDBdowncommand.
In any source file, the Emacs command C-x SPC (gud-break)
tells GDB to set a breakpoint on the source line point is on.
In text command mode, if you type M-x speedbar, Emacs displays a
separate frame which shows a backtrace when the GUD buffer is current.
Move point to any frame in the stack and type RET to make it
become the current frame and display the associated source in the
source buffer. Alternatively, click Mouse-2 to make the
selected frame become the current one. In graphical mode, the
speedbar displays watch expressions.
If you accidentally delete the source-display buffer, an easy way to get
it back is to type the command f in the GDB buffer, to
request a frame display; when you run under Emacs, this recreates
the source buffer if necessary to show you the context of the current
frame.
The source files displayed in Emacs are in ordinary Emacs buffers
which are visiting the source files in the usual way. You can edit
the files with these buffers if you wish; but keep in mind that GDB
communicates with Emacs in terms of line numbers. If you add or
delete lines from the text, the line numbers that GDB knows cease
to correspond properly with the code.
A more detailed description of Emacs’ interaction with GDB is
given in the Emacs manual (see Debuggers in The GNU
Emacs Manual).
27 The GDB/MI Interface
Function and Purpose
GDB/MI is a line based machine oriented text interface to
GDB and is activated by specifying using the
—interpreter command line option (see Mode Options). It
is specifically intended to support the development of systems which
use the debugger as just one small component of a larger system.
This chapter is a specification of the GDB/MI interface. It is written
in the form of a reference manual.
Note that GDB/MI is still under construction, so some of the
features described below are incomplete and subject to change
(see GDB/MI Development and Front Ends).
Notation and Terminology
This chapter uses the following notation:
-
|separates two alternatives. -
[ something ]indicates that something is optional:
it may or may not be given. -
( group )*means that group inside the parentheses
may repeat zero or more times. -
( group )+means that group inside the parentheses
may repeat one or more times. -
( group )means that group inside the parentheses
occurs exactly once. -
"string"means a literal string.
27.1 GDB/MI General Design
Interaction of a GDB/MI frontend with GDB involves three
parts—commands sent to GDB, responses to those commands
and notifications. Each command results in exactly one response,
indicating either successful completion of the command, or an error.
For the commands that do not resume the target, the response contains the
requested information. For the commands that resume the target, the
response only indicates whether the target was successfully resumed.
Notifications is the mechanism for reporting changes in the state of the
target, or in GDB state, that cannot conveniently be associated with
a command and reported as part of that command response.
The important examples of notifications are:
- Exec notifications. These are used to report changes in
target state—when a target is resumed, or stopped. It would not
be feasible to include this information in response of resuming
commands, because one resume commands can result in multiple events in
different threads. Also, quite some time may pass before any event
happens in the target, while a frontend needs to know whether the resuming
command itself was successfully executed. - Console output, and status notifications. Console output
notifications are used to report output of CLI commands, as well as
diagnostics for other commands. Status notifications are used to
report the progress of a long-running operation. Naturally, including
this information in command response would mean no output is produced
until the command is finished, which is undesirable. - General notifications. Commands may have various side effects on
the GDB or target state beyond their official purpose. For example,
a command may change the selected thread. Although such changes can
be included in command response, using notification allows for more
orthogonal frontend design.
There’s no guarantee that whenever an MI command reports an error,
GDB or the target are in any specific state, and especially,
the state is not reverted to the state before the MI command was
processed. Therefore, whenever an MI command results in an error,
we recommend that the frontend refreshes all the information shown in
the user interface.
27.1.1 Context management
27.1.1.1 Threads and Frames
In most cases when GDB accesses the target, this access is
done in context of a specific thread and frame (see Frames).
Often, even when accessing global data, the target requires that a thread
be specified. The CLI interface maintains the selected thread and frame,
and supplies them to target on each command. This is convenient,
because a command line user would not want to specify that information
explicitly on each command, and because user interacts with
GDB via a single terminal, so no confusion is possible as
to what thread and frame are the current ones.
In the case of MI, the concept of selected thread and frame is less
useful. First, a frontend can easily remember this information
itself. Second, a graphical frontend can have more than one window,
each one used for debugging a different thread, and the frontend might
want to access additional threads for internal purposes. This
increases the risk that by relying on implicitly selected thread, the
frontend may be operating on a wrong one. Therefore, each MI command
should explicitly specify which thread and frame to operate on. To
make it possible, each MI command accepts the ‘—thread’ and
‘—frame’ options, the value to each is GDB global
identifier for thread and frame to operate on.
Usually, each top-level window in a frontend allows the user to select
a thread and a frame, and remembers the user selection for further
operations. However, in some cases GDB may suggest that the
current thread or frame be changed. For example, when stopping on a
breakpoint it is reasonable to switch to the thread where breakpoint is
hit. For another example, if the user issues the CLI ‘thread’ or
‘frame’ commands via the frontend, it is desirable to change the
frontend’s selection to the one specified by user. GDB
communicates the suggestion to change current thread and frame using the
‘=thread-selected’ notification.
Note that historically, MI shares the selected thread with CLI, so
frontends used the -thread-select to execute commands in the
right context. However, getting this to work right is cumbersome. The
simplest way is for frontend to emit -thread-select command
before every command. This doubles the number of commands that need
to be sent. The alternative approach is to suppress -thread-select
if the selected thread in GDB is supposed to be identical to the
thread the frontend wants to operate on. However, getting this
optimization right can be tricky. In particular, if the frontend
sends several commands to GDB, and one of the commands changes the
selected thread, then the behaviour of subsequent commands will
change. So, a frontend should either wait for response from such
problematic commands, or explicitly add -thread-select for
all subsequent commands. No frontend is known to do this exactly
right, so it is suggested to just always pass the ‘—thread’ and
‘—frame’ options.
27.1.1.2 Language
The execution of several commands depends on which language is selected.
By default, the current language (see show language) is used.
But for commands known to be language-sensitive, it is recommended
to use the ‘—language’ option. This option takes one argument,
which is the name of the language to use while executing the command.
For instance:
-data-evaluate-expression --language c "sizeof (void*)" ^done,value="4" (gdb)
The valid language names are the same names accepted by the
‘set language’ command (see Manually), excluding ‘auto’,
‘local’ or ‘unknown’.
27.1.2 Asynchronous command execution and non-stop mode
On some targets, GDB is capable of processing MI commands
even while the target is running. This is called asynchronous
command execution (see Background Execution). The frontend may
specify a preference for asynchronous execution using the
-gdb-set mi-async 1 command, which should be emitted before
either running the executable or attaching to the target. After the
frontend has started the executable or attached to the target, it can
find if asynchronous execution is enabled using the
-list-target-features command.
-gdb-set mi-async [on|off]-
Set whether MI is in asynchronous mode.
When
off, which is the default, MI execution commands (e.g.,
-exec-continue) are foreground commands, and GDB waits
for the program to stop before processing further commands.When
on, MI execution commands are background execution
commands (e.g.,-exec-continuebecomes the equivalent of the
c&CLI command), and so GDB is capable of processing
MI commands even while the target is running. -gdb-show mi-async-
Show whether MI asynchronous mode is enabled.
Note: In GDB version 7.7 and earlier, this option was called
target-async instead of mi-async, and it had the effect
of both putting MI in asynchronous mode and making CLI background
commands possible. CLI background commands are now always possible
“out of the box” if the target supports them. The old spelling is
kept as a deprecated alias for backwards compatibility.
Even if GDB can accept a command while target is running,
many commands that access the target do not work when the target is
running. Therefore, asynchronous command execution is most useful
when combined with non-stop mode (see Non-Stop Mode). Then,
it is possible to examine the state of one thread, while other threads
are running.
When a given thread is running, MI commands that try to access the
target in the context of that thread may not work, or may work only on
some targets. In particular, commands that try to operate on thread’s
stack will not work, on any target. Commands that read memory, or
modify breakpoints, may work or not work, depending on the target. Note
that even commands that operate on global state, such as print,
set, and breakpoint commands, still access the target in the
context of a specific thread, so frontend should try to find a
stopped thread and perform the operation on that thread (using the
‘—thread’ option).
Which commands will work in the context of a running thread is
highly target dependent. However, the two commands
-exec-interrupt, to stop a thread, and -thread-info,
to find the state of a thread, will always work.
27.1.3 Thread groups
GDB may be used to debug several processes at the same time.
On some platforms, GDB may support debugging of several
hardware systems, each one having several cores with several different
processes running on each core. This section describes the MI
mechanism to support such debugging scenarios.
The key observation is that regardless of the structure of the
target, MI can have a global list of threads, because most commands that
accept the ‘—thread’ option do not need to know what process that
thread belongs to. Therefore, it is not necessary to introduce
neither additional ‘—process’ option, nor an notion of the
current process in the MI interface. The only strictly new feature
that is required is the ability to find how the threads are grouped
into processes.
To allow the user to discover such grouping, and to support arbitrary
hierarchy of machines/cores/processes, MI introduces the concept of a
thread group. Thread group is a collection of threads and other
thread groups. A thread group always has a string identifier, a type,
and may have additional attributes specific to the type. A new
command, -list-thread-groups, returns the list of top-level
thread groups, which correspond to processes that GDB is
debugging at the moment. By passing an identifier of a thread group
to the -list-thread-groups command, it is possible to obtain
the members of specific thread group.
To allow the user to easily discover processes, and other objects, he
wishes to debug, a concept of available thread group is
introduced. Available thread group is an thread group that
GDB is not debugging, but that can be attached to, using the
-target-attach command. The list of available top-level thread
groups can be obtained using ‘-list-thread-groups —available’.
In general, the content of a thread group may be only retrieved only
after attaching to that thread group.
Thread groups are related to inferiors (see Inferiors Connections and Programs). Each inferior corresponds to a thread group of a special
type ‘process’, and some additional operations are permitted on
such thread groups.
27.2 GDB/MI Command Syntax
27.2.1 GDB/MI Input Syntax
command →-
cli-command | mi-command cli-command →-
[ token ] cli-command nl, where
cli-command is any existing GDB CLI command. mi-command →-
[ token ] "-" operation ( " " option )*
[" --"]( " " parameter )* nl token →-
«any sequence of digits»
option →-
"-" parameter [ " " parameter ] parameter →-
non-blank-sequence | c-string operation →-
any of the operations described in this chapter
non-blank-sequence →-
anything, provided it doesn’t contain special characters such as
«-«, nl, «»» and of course » « c-string →-
""" seven-bit-iso-c-string-content """ nl →-
CR | CR-LF
Notes:
- The CLI commands are still handled by the MI interpreter; their
output is described below. - The
token, when present, is passed back when the command
finishes. - Some MI commands accept optional arguments as part of the parameter
list. Each option is identified by a leading ‘—’ (dash) and may be
followed by an optional argument parameter. Options occur first in the
parameter list and can be delimited from normal parameters using
‘—’ (this is useful when some parameters begin with a dash).
Pragmatics:
- We want easy access to the existing CLI syntax (for debugging).
- We want it to be easy to spot a MI operation.
27.2.2 GDB/MI Output Syntax
The output from GDB/MI consists of zero or more out-of-band records
followed, optionally, by a single result record. This result record
is for the most recent command. The sequence of output records is
terminated by ‘(gdb)’.
If an input command was prefixed with a token then the
corresponding output for that command will also be prefixed by that same
token.
output →-
( out-of-band-record )* [ result-record ] "(gdb)" nl result-record →-
[ token ] "^" result-class ( "," result )* nl out-of-band-record →-
async-record | stream-record async-record →-
exec-async-output | status-async-output | notify-async-output exec-async-output →-
[ token ] "*" async-output nl status-async-output →-
[ token ] "+" async-output nl notify-async-output →-
[ token ] "=" async-output nl async-output →-
async-class ( "," result )* result-class →-
"done" | "running" | "connected" | "error" | "exit" async-class →-
"stopped" | others(where others will be added
depending on the needs—this is still in development). result →-
variable "=" value variable →-
string value →-
const | tuple | list const →-
c-string tuple →-
"{}" | "{" result ( "," result )* "}" list →-
"[]" | "[" value ( "," value )* "]" | "["
result ( "," result )* "]" stream-record →-
console-stream-output | target-stream-output | log-stream-output console-stream-output →-
"~" c-string nl target-stream-output →-
"@" c-string nl log-stream-output →-
"&" c-string nl nl →-
CR | CR-LF token →-
any sequence of digits.
Notes:
- All output sequences end in a single line containing a period.
- The
tokenis from the corresponding request. Note that
for all async output, while the token is allowed by the grammar and
may be output by future versions of GDB for select async
output messages, it is generally omitted. Frontends should treat
all async output as reporting general changes in the state of the
target and there should be no need to associate async output to any
prior command. -
status-async-output contains on-going status information about the
progress of a slow operation. It can be discarded. All status output is
prefixed by ‘+’. -
exec-async-output contains asynchronous state change on the target
(stopped, started, disappeared). All async output is prefixed by
‘*’. -
notify-async-output contains supplementary information that the
client should handle (e.g., a new breakpoint information). All notify
output is prefixed by ‘=’. -
console-stream-output is output that should be displayed as is in the
console. It is the textual response to a CLI command. All the console
output is prefixed by ‘~’. -
target-stream-output is the output produced by the target program.
All the target output is prefixed by ‘@’. -
log-stream-output is output text coming from GDB’s internals, for
instance messages that should be displayed as part of an error log. All
the log output is prefixed by ‘&’. -
New GDB/MI commands should only output lists containing
values.
See GDB/MI Stream Records, for more
details about the various output records.
27.3 GDB/MI Compatibility with CLI
For the developers convenience CLI commands can be entered directly,
but there may be some unexpected behaviour. For example, commands
that query the user will behave as if the user replied yes, breakpoint
command lists are not executed and some CLI commands, such as
if, when and define, prompt for further input with
‘>’, which is not valid MI output.
This feature may be removed at some stage in the future and it is
recommended that front ends use the -interpreter-exec command
(see -interpreter-exec).
27.4 GDB/MI Development and Front Ends
The application which takes the MI output and presents the state of the
program being debugged to the user is called a front end.
Since GDB/MI is used by a variety of front ends to GDB, changes
to the MI interface may break existing usage. This section describes how the
protocol changes and how to request previous version of the protocol when it
does.
Some changes in MI need not break a carefully designed front end, and
for these the MI version will remain unchanged. The following is a
list of changes that may occur within one level, so front ends should
parse MI output in a way that can handle them:
- New MI commands may be added.
- New fields may be added to the output of any MI command.
- The range of values for fields with specified values, e.g.,
in_scope(see -var-update) may be extended.
If the changes are likely to break front ends, the MI version level
will be increased by one. The new versions of the MI protocol are not compatible
with the old versions. Old versions of MI remain available, allowing front ends
to keep using them until they are modified to use the latest MI version.
Since --interpreter=mi always points to the latest MI version, it is
recommended that front ends request a specific version of MI when launching
GDB (e.g. --interpreter=mi2) to make sure they get an
interpreter with the MI version they expect.
The following table gives a summary of the released versions of the MI
interface: the version number, the version of GDB in which it first appeared
and the breaking changes compared to the previous version.
| MI version | GDB version | Breaking changes |
|---|---|---|
|
1 |
5.1 |
None |
|
2 |
6.0 |
|
|
3 |
9.1 |
|
|
4 |
13.1 |
|
If your front end cannot yet migrate to a more recent version of the
MI protocol, you can nevertheless selectively enable specific features
available in those recent MI versions, using the following commands:
-fix-multi-location-breakpoint-output-
Use the output for multi-location breakpoints which was introduced by
MI 3, even when using MI versions below 3. This command has no
effect when using MI version 3 or later. -fix-breakpoint-script-output-
Use the output for the breakpoint «script» field which was introduced by
MI 4, even when using MI versions below 4. This command has no effect when
using MI version 4 or later.
The best way to avoid unexpected changes in MI that might break your front
end is to make your project known to GDB developers and
follow development on gdb@sourceware.org and
gdb-patches@sourceware.org.
27.5 GDB/MI Output Records
27.5.1 GDB/MI Result Records
In addition to a number of out-of-band notifications, the response to a
GDB/MI command includes one of the following result indications:
"^done" [ "," results ]-
The synchronous operation was successful,
resultsare the return
values. "^running"-
This result record is equivalent to ‘^done’. Historically, it
was output instead of ‘^done’ if the command has resumed the
target. This behaviour is maintained for backward compatibility, but
all frontends should treat ‘^done’ and ‘^running’
identically and rely on the ‘*running’ output record to determine
which threads are resumed. "^connected"-
GDB has connected to a remote target.
"^error" "," "msg=" c-string [ "," "code=" c-string ]-
The operation failed. The
msg=c-stringvariable contains
the corresponding error message.If present, the
code=c-stringvariable provides an error
code on which consumers can rely on to detect the corresponding
error condition. At present, only one error code is defined:- ‘«undefined-command»’
-
Indicates that the command causing the error does not exist.
"^exit"-
GDB has terminated.
27.5.2 GDB/MI Stream Records
GDB internally maintains a number of output streams: the console, the
target, and the log. The output intended for each of these streams is
funneled through the GDB/MI interface using stream records.
Each stream record begins with a unique prefix character which
identifies its stream (see GDB/MI Output
Syntax). In addition to the prefix, each stream record contains a
string-output. This is either raw text (with an implicit new
line) or a quoted C string (which does not contain an implicit newline).
"~" string-output-
The console output stream contains text that should be displayed in the
CLI console window. It contains the textual responses to CLI commands. "@" string-output-
The target output stream contains any textual output from the running
target. This is only present when GDB’s event loop is truly
asynchronous, which is currently only the case for remote targets. "&" string-output-
The log stream contains debugging messages being produced by GDB’s
internals.
27.5.3 GDB/MI Async Records
Async records are used to notify the GDB/MI client of
additional changes that have occurred. Those changes can either be a
consequence of GDB/MI commands (e.g., a breakpoint modified) or a result of
target activity (e.g., target stopped).
The following is the list of possible async records:
*running,thread-id="thread"-
The target is now running. The thread field can be the global
thread ID of the thread that is now running, and it can be
‘all’ if all threads are running. The frontend should assume
that no interaction with a running thread is possible after this
notification is produced. The frontend should not assume that this
notification is output only once for any command. GDB may
emit this notification several times, either for different threads,
because it cannot resume all threads together, or even for a single
thread, if the thread must be stepped though some code before letting
it run freely. *stopped,reason="reason",thread-id="id",stopped-threads="stopped",core="core"-
The target has stopped. The reason field can have one of the
following values:breakpoint-hit-
A breakpoint was reached.
watchpoint-trigger-
A watchpoint was triggered.
read-watchpoint-trigger-
A read watchpoint was triggered.
access-watchpoint-trigger-
An access watchpoint was triggered.
function-finished-
An -exec-finish or similar CLI command was accomplished.
location-reached-
An -exec-until or similar CLI command was accomplished.
watchpoint-scope-
A watchpoint has gone out of scope.
end-stepping-range-
An -exec-next, -exec-next-instruction, -exec-step, -exec-step-instruction or
similar CLI command was accomplished. exited-signalled-
The inferior exited because of a signal.
exited-
The inferior exited.
exited-normally-
The inferior exited normally.
signal-received-
A signal was received by the inferior.
solib-event-
The inferior has stopped due to a library being loaded or unloaded.
This can happen whenstop-on-solib-events(see Files) is
set or when acatch loadorcatch unloadcatchpoint is
in use (see Set Catchpoints). fork-
The inferior has forked. This is reported when
catch fork
(see Set Catchpoints) has been used. vfork-
The inferior has vforked. This is reported in when
catch vfork
(see Set Catchpoints) has been used. syscall-entry-
The inferior entered a system call. This is reported when
catch(see Set Catchpoints) has been used.
syscall syscall-return-
The inferior returned from a system call. This is reported when
catch syscall(see Set Catchpoints) has been used. exec-
The inferior called
exec. This is reported whencatch exec
(see Set Catchpoints) has been used.
The id field identifies the global thread ID of the thread
that directly caused the stop – for example by hitting a breakpoint.
Depending on whether all-stop
mode is in effect (see All-Stop Mode), GDB may either
stop all threads, or only the thread that directly triggered the stop.
If all threads are stopped, the stopped field will have the
value of"all". Otherwise, the value of the stopped
field will be a list of thread identifiers. Presently, this list will
always include a single thread, but frontend should be prepared to see
several threads in the list. The core field reports the
processor core on which the stop event has happened. This field may be absent
if such information is not available. =thread-group-added,id="id"=thread-group-removed,id="id"-
A thread group was either added or removed. The id field
contains the GDB identifier of the thread group. When a thread
group is added, it generally might not be associated with a running
process. When a thread group is removed, its id becomes invalid and
cannot be used in any way. =thread-group-started,id="id",pid="pid"-
A thread group became associated with a running program,
either because the program was just started or the thread group
was attached to a program. The id field contains the
GDB identifier of the thread group. The pid field
contains process identifier, specific to the operating system. =thread-group-exited,id="id"[,exit-code="code"]-
A thread group is no longer associated with a running program,
either because the program has exited, or because it was detached
from. The id field contains the GDB identifier of the
thread group. The code field is the exit code of the inferior; it exists
only when the inferior exited with some code. =thread-created,id="id",group-id="gid"=thread-exited,id="id",group-id="gid"-
A thread either was created, or has exited. The id field
contains the global GDB identifier of the thread. The gid
field identifies the thread group this thread belongs to. =thread-selected,id="id"[,frame="frame"]-
Informs that the selected thread or frame were changed. This notification
is not emitted as result of the-thread-selector
-stack-select-framecommands, but is emitted whenever an MI command
that is not documented to change the selected thread and frame actually
changes them. In particular, invoking, directly or indirectly
(via user-defined command), the CLIthreadorframecommands,
will generate this notification. Changing the thread or frame from another
user interface (see Interpreters) will also generate this notification.The frame field is only present if the newly selected thread is
stopped. See GDB/MI Frame Information for the format of its value.We suggest that in response to this notification, front ends
highlight the selected thread and cause subsequent commands to apply to
that thread. =library-loaded,...-
Reports that a new library file was loaded by the program. This
notification has 5 fields—id, target-name,
host-name, symbols-loaded and ranges. The id field is an
opaque identifier of the library. For remote debugging case,
target-name and host-name fields give the name of the
library file on the target, and on the host respectively. For native
debugging, both those fields have the same value. The
symbols-loaded field is emitted only for backward compatibility
and should not be relied on to convey any useful information. The
thread-group field, if present, specifies the id of the thread
group in whose context the library was loaded. If the field is
absent, it means the library was loaded in the context of all present
thread groups. The ranges field specifies the ranges of addresses belonging
to this library. =library-unloaded,...-
Reports that a library was unloaded by the program. This notification
has 3 fields—id, target-name and host-name with
the same meaning as for the=library-loadednotification.
The thread-group field, if present, specifies the id of the
thread group in whose context the library was unloaded. If the field is
absent, it means the library was unloaded in the context of all present
thread groups. =traceframe-changed,num=tfnum,tracepoint=tpnum=traceframe-changed,end-
Reports that the trace frame was changed and its new number is
tfnum. The number of the tracepoint associated with this trace
frame is tpnum. =tsv-created,name=name,initial=initial-
Reports that the new trace state variable name is created with
initial value initial. =tsv-deleted,name=name=tsv-deleted-
Reports that the trace state variable name is deleted or all
trace state variables are deleted. =tsv-modified,name=name,initial=initial[,current=current]-
Reports that the trace state variable name is modified with
the initial value initial. The current value current of
trace state variable is optional and is reported if the current
value of trace state variable is known. =breakpoint-created,bkpt={...}=breakpoint-modified,bkpt={...}=breakpoint-deleted,id=number-
Reports that a breakpoint was created, modified, or deleted,
respectively. Only user-visible breakpoints are reported to the MI
user.The bkpt argument is of the same form as returned by the various
breakpoint commands; See GDB/MI Breakpoint Commands. The
number is the ordinal number of the breakpoint.Note that if a breakpoint is emitted in the result record of a
command, then it will not also be emitted in an async record. =record-started,thread-group="id",method="method"[,format="format"]=record-stopped,thread-group="id"-
Execution log recording was either started or stopped on an
inferior. The id is the GDB identifier of the thread
group corresponding to the affected inferior.The method field indicates the method used to record execution. If the
method in use supports multiple recording formats, format will be present
and contain the currently used format. See Process Record and Replay,
for existing method and format values. =cmd-param-changed,param=param,value=value-
Reports that a parameter of the command
set paramis
changed to value. In the multi-wordsetcommand,
the param is the whole parameter list tosetcommand.
For example, In commandset check type on, param
ischeck typeand value ison. =memory-changed,thread-group=id,addr=addr,len=len[,type="code"]-
Reports that bytes from addr to data + len were
written in an inferior. The id is the identifier of the
thread group corresponding to the affected inferior. The optional
type="code"part is reported if the memory written to holds
executable code.
27.5.4 GDB/MI Breakpoint Information
When GDB reports information about a breakpoint, a
tracepoint, a watchpoint, or a catchpoint, it uses a tuple with the
following fields:
number-
The breakpoint number.
type-
The type of the breakpoint. For ordinary breakpoints this will be
‘breakpoint’, but many values are possible. catch-type-
If the type of the breakpoint is ‘catchpoint’, then this
indicates the exact type of catchpoint. disp-
This is the breakpoint disposition—either ‘del’, meaning that
the breakpoint will be deleted at the next stop, or ‘keep’,
meaning that the breakpoint will not be deleted. enabled-
This indicates whether the breakpoint is enabled, in which case the
value is ‘y’, or disabled, in which case the value is ‘n’.
Note that this is not the same as the fieldenable. addr-
The address of the breakpoint. This may be a hexidecimal number,
giving the address; or the string ‘<PENDING>’, for a pending
breakpoint; or the string ‘<MULTIPLE>’, for a breakpoint with
multiple locations. This field will not be present if no address can
be determined. For example, a watchpoint does not have an address. addr_flags-
Optional field containing any flags related to the address. These flags are
architecture-dependent; see Architectures for their meaning for a
particular CPU. func-
If known, the function in which the breakpoint appears.
If not known, this field is not present. filename-
The name of the source file which contains this function, if known.
If not known, this field is not present. fullname-
The full file name of the source file which contains this function, if
known. If not known, this field is not present. line-
The line number at which this breakpoint appears, if known.
If not known, this field is not present. at-
If the source file is not known, this field may be provided. If
provided, this holds the address of the breakpoint, possibly followed
by a symbol name. pending-
If this breakpoint is pending, this field is present and holds the
text used to set the breakpoint, as entered by the user. evaluated-by-
Where this breakpoint’s condition is evaluated, either ‘host’ or
‘target’. thread-
If this is a thread-specific breakpoint, then this identifies the
thread in which the breakpoint can trigger. task-
If this breakpoint is restricted to a particular Ada task, then this
field will hold the task identifier. cond-
If the breakpoint is conditional, this is the condition expression.
ignore-
The ignore count of the breakpoint.
enable-
The enable count of the breakpoint.
traceframe-usage-
FIXME.
static-tracepoint-marker-string-id-
For a static tracepoint, the name of the static tracepoint marker.
mask-
For a masked watchpoint, this is the mask.
pass-
A tracepoint’s pass count.
original-location-
The location of the breakpoint as originally specified by the user.
This field is optional. times-
The number of times the breakpoint has been hit.
installed-
This field is only given for tracepoints. This is either ‘y’,
meaning that the tracepoint is installed, or ‘n’, meaning that it
is not. what-
Some extra data, the exact contents of which are type-dependent.
locations-
This field is present if the breakpoint has multiple locations. It is also
exceptionally present if the breakpoint is enabled and has a single, disabled
location.The value is a list of locations. The format of a location is described below.
A location in a multi-location breakpoint is represented as a tuple with the
following fields:
number-
The location number as a dotted pair, like ‘1.2’. The first digit is the
number of the parent breakpoint. The second digit is the number of the
location within that breakpoint. enabled-
There are three possible values, with the following meanings:
y-
The location is enabled.
n-
The location is disabled by the user.
N-
The location is disabled because the breakpoint condition is invalid
at this location.
addr-
The address of this location as an hexidecimal number.
addr_flags-
Optional field containing any flags related to the address. These flags are
architecture-dependent; see Architectures for their meaning for a
particular CPU. func-
If known, the function in which the location appears.
If not known, this field is not present. file-
The name of the source file which contains this location, if known.
If not known, this field is not present. fullname-
The full file name of the source file which contains this location, if
known. If not known, this field is not present. line-
The line number at which this location appears, if known.
If not known, this field is not present. thread-groups-
The thread groups this location is in.
For example, here is what the output of -break-insert
(see GDB/MI Breakpoint Commands) might be:
-> -break-insert main
<- ^done,bkpt={number="1",type="breakpoint",disp="keep",
enabled="y",addr="0x08048564",func="main",file="myprog.c",
fullname="/home/nickrob/myprog.c",line="68",thread-groups=["i1"],
times="0"}
<- (gdb)
27.5.5 GDB/MI Frame Information
Response from many MI commands includes an information about stack
frame. This information is a tuple that may have the following
fields:
level-
The level of the stack frame. The innermost frame has the level of
zero. This field is always present. func-
The name of the function corresponding to the frame. This field may
be absent if GDB is unable to determine the function name. addr-
The code address for the frame. This field is always present.
addr_flags-
Optional field containing any flags related to the address. These flags are
architecture-dependent; see Architectures for their meaning for a
particular CPU. file-
The name of the source files that correspond to the frame’s code
address. This field may be absent. line-
The source line corresponding to the frames’ code address. This field
may be absent. from-
The name of the binary file (either executable or shared library) the
corresponds to the frame’s code address. This field may be absent.
27.5.6 GDB/MI Thread Information
Whenever GDB has to report an information about a thread, it
uses a tuple with the following fields. The fields are always present unless
stated otherwise.
id-
The global numeric id assigned to the thread by GDB.
target-id-
The target-specific string identifying the thread.
details-
Additional information about the thread provided by the target.
It is supposed to be human-readable and not interpreted by the
frontend. This field is optional. name-
The name of the thread. If the user specified a name using the
thread namecommand, then this name is given. Otherwise, if
GDB can extract the thread name from the target, then that
name is given. If GDB cannot find the thread name, then this
field is omitted. state-
The execution state of the thread, either ‘stopped’ or ‘running’,
depending on whether the thread is presently running. frame-
The stack frame currently executing in the thread. This field is only present
if the thread is stopped. Its format is documented in
GDB/MI Frame Information. core-
The value of this field is an integer number of the processor core the
thread was last seen on. This field is optional.
27.5.7 GDB/MI Ada Exception Information
Whenever a *stopped record is emitted because the program
stopped after hitting an exception catchpoint (see Set Catchpoints),
GDB provides the name of the exception that was raised via
the exception-name field. Also, for exceptions that were raised
with an exception message, GDB provides that message via
the exception-message field.
27.6 Simple Examples of GDB/MI Interaction
This subsection presents several simple examples of interaction using
the GDB/MI interface. In these examples, ‘->’ means that the
following line is passed to GDB/MI as input, while ‘<-’ means
the output received from GDB/MI.
Note the line breaks shown in the examples are here only for
readability, they don’t appear in the real output.
Setting a Breakpoint
Setting a breakpoint generates synchronous output which contains detailed
information of the breakpoint.
-> -break-insert main
<- ^done,bkpt={number="1",type="breakpoint",disp="keep",
enabled="y",addr="0x08048564",func="main",file="myprog.c",
fullname="/home/nickrob/myprog.c",line="68",thread-groups=["i1"],
times="0"}
<- (gdb)
Program Execution
Program execution generates asynchronous records and MI gives the
reason that execution stopped.
-> -exec-run
<- ^running
<- (gdb)
<- *stopped,reason="breakpoint-hit",disp="keep",bkptno="1",thread-id="0",
frame={addr="0x08048564",func="main",
args=[{name="argc",value="1"},{name="argv",value="0xbfc4d4d4"}],
file="myprog.c",fullname="/home/nickrob/myprog.c",line="68",
arch="i386:x86_64"}
<- (gdb)
-> -exec-continue
<- ^running
<- (gdb)
<- *stopped,reason="exited-normally"
<- (gdb)
Quitting GDB
Quitting GDB just prints the result class ‘^exit’.
-> (gdb) <- -gdb-exit <- ^exit
Please note that ‘^exit’ is printed immediately, but it might
take some time for GDB to actually exit. During that time, GDB
performs necessary cleanups, including killing programs being debugged
or disconnecting from debug hardware, so the frontend should wait till
GDB exits and should only forcibly kill GDB if it
fails to exit in reasonable time.
A Bad Command
Here’s what happens if you pass a non-existent command:
-> -rubbish <- ^error,msg="Undefined MI command: rubbish" <- (gdb)
27.7 GDB/MI Command Description Format
The remaining sections describe blocks of commands. Each block of
commands is laid out in a fashion similar to this section.
Motivation
The motivation for this collection of commands.
Introduction
A brief introduction to this collection of commands as a whole.
Commands
For each command in the block, the following is described:
Synopsis
Result
GDB Command
The corresponding GDB CLI command(s), if any.
Example
Example(s) formatted for readability. Some of the described commands have
not been implemented yet and these are labeled N.A. (not available).
27.8 GDB/MI Breakpoint Commands
This section documents GDB/MI commands for manipulating
breakpoints.
The -break-after Command
Synopsis
-break-after number count
The breakpoint number number is not in effect until it has been
hit count times. To see how this is reflected in the output of
the ‘-break-list’ command, see the description of the
‘-break-list’ command below.
GDB Command
The corresponding GDB command is ‘ignore’.
Example
(gdb)
-break-insert main
^done,bkpt={number="1",type="breakpoint",disp="keep",
enabled="y",addr="0x000100d0",func="main",file="hello.c",
fullname="/home/foo/hello.c",line="5",thread-groups=["i1"],
times="0"}
(gdb)
-break-after 1 3
~
^done
(gdb)
-break-list
^done,BreakpointTable={nr_rows="1",nr_cols="6",
hdr=[{width="3",alignment="-1",col_name="number",colhdr="Num"},
{width="14",alignment="-1",col_name="type",colhdr="Type"},
{width="4",alignment="-1",col_name="disp",colhdr="Disp"},
{width="3",alignment="-1",col_name="enabled",colhdr="Enb"},
{width="10",alignment="-1",col_name="addr",colhdr="Address"},
{width="40",alignment="2",col_name="what",colhdr="What"}],
body=[bkpt={number="1",type="breakpoint",disp="keep",enabled="y",
addr="0x000100d0",func="main",file="hello.c",fullname="/home/foo/hello.c",
line="5",thread-groups=["i1"],times="0",ignore="3"}]}
(gdb)
The -break-commands Command
Synopsis
-break-commands number [ command1 ... commandN ]
Specifies the CLI commands that should be executed when breakpoint
number is hit. The parameters command1 to commandN
are the commands. If no command is specified, any previously-set
commands are cleared. See Break Commands. Typical use of this
functionality is tracing a program, that is, printing of values of
some variables whenever breakpoint is hit and then continuing.
GDB Command
The corresponding GDB command is ‘commands’.
Example
(gdb)
-break-insert main
^done,bkpt={number="1",type="breakpoint",disp="keep",
enabled="y",addr="0x000100d0",func="main",file="hello.c",
fullname="/home/foo/hello.c",line="5",thread-groups=["i1"],
times="0"}
(gdb)
-break-commands 1 "print v" "continue"
^done
(gdb)
The -break-condition Command
Synopsis
-break-condition [ --force ] number [ expr ]
Breakpoint number will stop the program only if the condition in
expr is true. The condition becomes part of the
‘-break-list’ output (see the description of the ‘-break-list’
command below). If the ‘—force’ flag is passed, the condition
is forcibly defined even when it is invalid for all locations of
breakpoint number. If the expr argument is omitted,
breakpoint number becomes unconditional.
GDB Command
The corresponding GDB command is ‘condition’.
Example
(gdb)
-break-condition 1 1
^done
(gdb)
-break-list
^done,BreakpointTable={nr_rows="1",nr_cols="6",
hdr=[{width="3",alignment="-1",col_name="number",colhdr="Num"},
{width="14",alignment="-1",col_name="type",colhdr="Type"},
{width="4",alignment="-1",col_name="disp",colhdr="Disp"},
{width="3",alignment="-1",col_name="enabled",colhdr="Enb"},
{width="10",alignment="-1",col_name="addr",colhdr="Address"},
{width="40",alignment="2",col_name="what",colhdr="What"}],
body=[bkpt={number="1",type="breakpoint",disp="keep",enabled="y",
addr="0x000100d0",func="main",file="hello.c",fullname="/home/foo/hello.c",
line="5",cond="1",thread-groups=["i1"],times="0",ignore="3"}]}
(gdb)
The -break-delete Command
Synopsis
-break-delete ( breakpoint )+
Delete the breakpoint(s) whose number(s) are specified in the argument
list. This is obviously reflected in the breakpoint list.
GDB Command
The corresponding GDB command is ‘delete’.
Example
(gdb)
-break-delete 1
^done
(gdb)
-break-list
^done,BreakpointTable={nr_rows="0",nr_cols="6",
hdr=[{width="3",alignment="-1",col_name="number",colhdr="Num"},
{width="14",alignment="-1",col_name="type",colhdr="Type"},
{width="4",alignment="-1",col_name="disp",colhdr="Disp"},
{width="3",alignment="-1",col_name="enabled",colhdr="Enb"},
{width="10",alignment="-1",col_name="addr",colhdr="Address"},
{width="40",alignment="2",col_name="what",colhdr="What"}],
body=[]}
(gdb)
The -break-disable Command
Synopsis
-break-disable ( breakpoint )+
Disable the named breakpoint(s). The field ‘enabled’ in the
break list is now set to ‘n’ for the named breakpoint(s).
GDB Command
The corresponding GDB command is ‘disable’.
Example
(gdb)
-break-disable 2
^done
(gdb)
-break-list
^done,BreakpointTable={nr_rows="1",nr_cols="6",
hdr=[{width="3",alignment="-1",col_name="number",colhdr="Num"},
{width="14",alignment="-1",col_name="type",colhdr="Type"},
{width="4",alignment="-1",col_name="disp",colhdr="Disp"},
{width="3",alignment="-1",col_name="enabled",colhdr="Enb"},
{width="10",alignment="-1",col_name="addr",colhdr="Address"},
{width="40",alignment="2",col_name="what",colhdr="What"}],
body=[bkpt={number="2",type="breakpoint",disp="keep",enabled="n",
addr="0x000100d0",func="main",file="hello.c",fullname="/home/foo/hello.c",
line="5",thread-groups=["i1"],times="0"}]}
(gdb)
The -break-enable Command
Synopsis
-break-enable ( breakpoint )+
Enable (previously disabled) breakpoint(s).
GDB Command
The corresponding GDB command is ‘enable’.
Example
(gdb)
-break-enable 2
^done
(gdb)
-break-list
^done,BreakpointTable={nr_rows="1",nr_cols="6",
hdr=[{width="3",alignment="-1",col_name="number",colhdr="Num"},
{width="14",alignment="-1",col_name="type",colhdr="Type"},
{width="4",alignment="-1",col_name="disp",colhdr="Disp"},
{width="3",alignment="-1",col_name="enabled",colhdr="Enb"},
{width="10",alignment="-1",col_name="addr",colhdr="Address"},
{width="40",alignment="2",col_name="what",colhdr="What"}],
body=[bkpt={number="2",type="breakpoint",disp="keep",enabled="y",
addr="0x000100d0",func="main",file="hello.c",fullname="/home/foo/hello.c",
line="5",thread-groups=["i1"],times="0"}]}
(gdb)
The -break-info Command
Synopsis
Get information about a single breakpoint.
The result is a table of breakpoints. See GDB/MI Breakpoint Information, for details on the format of each breakpoint in the
table.
GDB Command
The corresponding GDB command is ‘info break breakpoint’.
Example
N.A.
The -break-insert Command
Synopsis
-break-insert [ -t ] [ -h ] [ -f ] [ -d ] [ -a ] [ --qualified ]
[ -c condition ] [ --force-condition ] [ -i ignore-count ]
[ -p thread-id ] [ locspec ]
If specified, locspec, can be one of:
- linespec location
-
A linespec location. See Linespec Locations.
- explicit location
-
An explicit location. GDB/MI explicit locations are
analogous to the CLI’s explicit locations using the option names
listed below. See Explicit Locations.- ‘—source filename’
-
The source file name of the location. This option requires the use
of either ‘—function’ or ‘—line’. - ‘—function function’
-
The name of a function or method.
- ‘—label label’
-
The name of a label.
- ‘—line lineoffset’
-
An absolute or relative line offset from the start of the location.
- address location
-
An address location, *address. See Address Locations.
The possible optional parameters of this command are:
- ‘-t’
-
Insert a temporary breakpoint.
- ‘-h’
-
Insert a hardware breakpoint.
- ‘-f’
-
If locspec cannot be resolved (for example if it
refers to unknown files or functions), create a pending
breakpoint. Without this flag, GDB will report
an error, and won’t create a breakpoint, if locspec
cannot be parsed. - ‘-d’
-
Create a disabled breakpoint.
- ‘-a’
-
Create a tracepoint. See Tracepoints. When this parameter
is used together with ‘-h’, a fast tracepoint is created. - ‘-c condition’
-
Make the breakpoint conditional on condition.
- ‘—force-condition’
-
Forcibly define the breakpoint even if the condition is invalid at
all of the breakpoint locations. - ‘-i ignore-count’
-
Initialize the ignore-count.
- ‘-p thread-id’
-
Restrict the breakpoint to the thread with the specified global
thread-id. - ‘—qualified’
-
This option makes GDB interpret a function name specified as
a complete fully-qualified name.
Result
See GDB/MI Breakpoint Information, for details on the format of the
resulting breakpoint.
Note: this format is open to change.
GDB Command
The corresponding GDB commands are ‘break’, ‘tbreak’,
‘hbreak’, and ‘thbreak’.
Example
(gdb)
-break-insert main
^done,bkpt={number="1",addr="0x0001072c",file="recursive2.c",
fullname="/home/foo/recursive2.c,line="4",thread-groups=["i1"],
times="0"}
(gdb)
-break-insert -t foo
^done,bkpt={number="2",addr="0x00010774",file="recursive2.c",
fullname="/home/foo/recursive2.c,line="11",thread-groups=["i1"],
times="0"}
(gdb)
-break-list
^done,BreakpointTable={nr_rows="2",nr_cols="6",
hdr=[{width="3",alignment="-1",col_name="number",colhdr="Num"},
{width="14",alignment="-1",col_name="type",colhdr="Type"},
{width="4",alignment="-1",col_name="disp",colhdr="Disp"},
{width="3",alignment="-1",col_name="enabled",colhdr="Enb"},
{width="10",alignment="-1",col_name="addr",colhdr="Address"},
{width="40",alignment="2",col_name="what",colhdr="What"}],
body=[bkpt={number="1",type="breakpoint",disp="keep",enabled="y",
addr="0x0001072c", func="main",file="recursive2.c",
fullname="/home/foo/recursive2.c,"line="4",thread-groups=["i1"],
times="0"},
bkpt={number="2",type="breakpoint",disp="del",enabled="y",
addr="0x00010774",func="foo",file="recursive2.c",
fullname="/home/foo/recursive2.c",line="11",thread-groups=["i1"],
times="0"}]}
(gdb)
The -dprintf-insert Command
Synopsis
-dprintf-insert [ -t ] [ -f ] [ -d ] [ --qualified ]
[ -c condition ] [--force-condition] [ -i ignore-count ]
[ -p thread-id ] [ locspec ] [ format ]
[ argument ]
If supplied, locspec and --qualified may be specified
the same way as for the -break-insert command.
See -break-insert.
The possible optional parameters of this command are:
- ‘-t’
-
Insert a temporary breakpoint.
- ‘-f’
-
If locspec cannot be parsed (for example, if it
refers to unknown files or functions), create a pending
breakpoint. Without this flag, GDB will report
an error, and won’t create a breakpoint, if locspec
cannot be parsed. - ‘-d’
-
Create a disabled breakpoint.
- ‘-c condition’
-
Make the breakpoint conditional on condition.
- ‘—force-condition’
-
Forcibly define the breakpoint even if the condition is invalid at
all of the breakpoint locations. - ‘-i ignore-count’
-
Set the ignore count of the breakpoint (see ignore count)
to ignore-count. - ‘-p thread-id’
-
Restrict the breakpoint to the thread with the specified global
thread-id.
Result
See GDB/MI Breakpoint Information, for details on the format of the
resulting breakpoint.
GDB Command
The corresponding GDB command is ‘dprintf’.
Example
(gdb)
4-dprintf-insert foo "At foo entryn"
4^done,bkpt={number="1",type="dprintf",disp="keep",enabled="y",
addr="0x000000000040061b",func="foo",file="mi-dprintf.c",
fullname="mi-dprintf.c",line="25",thread-groups=["i1"],
times="0",script=["printf "At foo entry\n"","continue"],
original-location="foo"}
(gdb)
5-dprintf-insert 26 "arg=%d, g=%dn" arg g
5^done,bkpt={number="2",type="dprintf",disp="keep",enabled="y",
addr="0x000000000040062a",func="foo",file="mi-dprintf.c",
fullname="mi-dprintf.c",line="26",thread-groups=["i1"],
times="0",script=["printf "arg=%d, g=%d\n", arg, g","continue"],
original-location="mi-dprintf.c:26"}
(gdb)
The -break-list Command
Synopsis
Displays the list of inserted breakpoints, showing the following fields:
- ‘Number’
-
number of the breakpoint
- ‘Type’
-
type of the breakpoint: ‘breakpoint’ or ‘watchpoint’
- ‘Disposition’
-
should the breakpoint be deleted or disabled when it is hit: ‘keep’
or ‘nokeep’ - ‘Enabled’
-
is the breakpoint enabled or no: ‘y’ or ‘n’
- ‘Address’
-
memory location at which the breakpoint is set
- ‘What’
-
logical location of the breakpoint, expressed by function name, file
name, line number - ‘Thread-groups’
-
list of thread groups to which this breakpoint applies
- ‘Times’
-
number of times the breakpoint has been hit
If there are no breakpoints or watchpoints, the BreakpointTable
body field is an empty list.
GDB Command
The corresponding GDB command is ‘info break’.
Example
(gdb)
-break-list
^done,BreakpointTable={nr_rows="2",nr_cols="6",
hdr=[{width="3",alignment="-1",col_name="number",colhdr="Num"},
{width="14",alignment="-1",col_name="type",colhdr="Type"},
{width="4",alignment="-1",col_name="disp",colhdr="Disp"},
{width="3",alignment="-1",col_name="enabled",colhdr="Enb"},
{width="10",alignment="-1",col_name="addr",colhdr="Address"},
{width="40",alignment="2",col_name="what",colhdr="What"}],
body=[bkpt={number="1",type="breakpoint",disp="keep",enabled="y",
addr="0x000100d0",func="main",file="hello.c",line="5",thread-groups=["i1"],
times="0"},
bkpt={number="2",type="breakpoint",disp="keep",enabled="y",
addr="0x00010114",func="foo",file="hello.c",fullname="/home/foo/hello.c",
line="13",thread-groups=["i1"],times="0"}]}
(gdb)
Here’s an example of the result when there are no breakpoints:
(gdb)
-break-list
^done,BreakpointTable={nr_rows="0",nr_cols="6",
hdr=[{width="3",alignment="-1",col_name="number",colhdr="Num"},
{width="14",alignment="-1",col_name="type",colhdr="Type"},
{width="4",alignment="-1",col_name="disp",colhdr="Disp"},
{width="3",alignment="-1",col_name="enabled",colhdr="Enb"},
{width="10",alignment="-1",col_name="addr",colhdr="Address"},
{width="40",alignment="2",col_name="what",colhdr="What"}],
body=[]}
(gdb)
The -break-passcount Command
Synopsis
-break-passcount tracepoint-number passcount
Set the passcount for tracepoint tracepoint-number to
passcount. If the breakpoint referred to by tracepoint-number
is not a tracepoint, error is emitted. This corresponds to CLI
command ‘passcount’.
The -break-watch Command
Synopsis
Create a watchpoint. With the ‘-a’ option it will create an
access watchpoint, i.e., a watchpoint that triggers either on a
read from or on a write to the memory location. With the ‘-r’
option, the watchpoint created is a read watchpoint, i.e., it will
trigger only when the memory location is accessed for reading. Without
either of the options, the watchpoint created is a regular watchpoint,
i.e., it will trigger when the memory location is accessed for writing.
See Setting Watchpoints.
Note that ‘-break-list’ will report a single list of watchpoints and
breakpoints inserted.
GDB Command
The corresponding GDB commands are ‘watch’, ‘awatch’, and
‘rwatch’.
Example
Setting a watchpoint on a variable in the main function:
(gdb)
-break-watch x
^done,wpt={number="2",exp="x"}
(gdb)
-exec-continue
^running
(gdb)
*stopped,reason="watchpoint-trigger",wpt={number="2",exp="x"},
value={old="-268439212",new="55"},
frame={func="main",args=[],file="recursive2.c",
fullname="/home/foo/bar/recursive2.c",line="5",arch="i386:x86_64"}
(gdb)
Setting a watchpoint on a variable local to a function. GDB will stop
the program execution twice: first for the variable changing value, then
for the watchpoint going out of scope.
(gdb)
-break-watch C
^done,wpt={number="5",exp="C"}
(gdb)
-exec-continue
^running
(gdb)
*stopped,reason="watchpoint-trigger",
wpt={number="5",exp="C"},value={old="-276895068",new="3"},
frame={func="callee4",args=[],
file="../../../devo/gdb/testsuite/gdb.mi/basics.c",
fullname="/home/foo/bar/devo/gdb/testsuite/gdb.mi/basics.c",line="13",
arch="i386:x86_64"}
(gdb)
-exec-continue
^running
(gdb)
*stopped,reason="watchpoint-scope",wpnum="5",
frame={func="callee3",args=[{name="strarg",
value="0x11940 "A string argument.""}],
file="../../../devo/gdb/testsuite/gdb.mi/basics.c",
fullname="/home/foo/bar/devo/gdb/testsuite/gdb.mi/basics.c",line="18",
arch="i386:x86_64"}
(gdb)
Listing breakpoints and watchpoints, at different points in the program
execution. Note that once the watchpoint goes out of scope, it is
deleted.
(gdb)
-break-watch C
^done,wpt={number="2",exp="C"}
(gdb)
-break-list
^done,BreakpointTable={nr_rows="2",nr_cols="6",
hdr=[{width="3",alignment="-1",col_name="number",colhdr="Num"},
{width="14",alignment="-1",col_name="type",colhdr="Type"},
{width="4",alignment="-1",col_name="disp",colhdr="Disp"},
{width="3",alignment="-1",col_name="enabled",colhdr="Enb"},
{width="10",alignment="-1",col_name="addr",colhdr="Address"},
{width="40",alignment="2",col_name="what",colhdr="What"}],
body=[bkpt={number="1",type="breakpoint",disp="keep",enabled="y",
addr="0x00010734",func="callee4",
file="../../../devo/gdb/testsuite/gdb.mi/basics.c",
fullname="/home/foo/devo/gdb/testsuite/gdb.mi/basics.c"line="8",thread-groups=["i1"],
times="1"},
bkpt={number="2",type="watchpoint",disp="keep",
enabled="y",addr="",what="C",thread-groups=["i1"],times="0"}]}
(gdb)
-exec-continue
^running
(gdb)
*stopped,reason="watchpoint-trigger",wpt={number="2",exp="C"},
value={old="-276895068",new="3"},
frame={func="callee4",args=[],
file="../../../devo/gdb/testsuite/gdb.mi/basics.c",
fullname="/home/foo/bar/devo/gdb/testsuite/gdb.mi/basics.c",line="13",
arch="i386:x86_64"}
(gdb)
-break-list
^done,BreakpointTable={nr_rows="2",nr_cols="6",
hdr=[{width="3",alignment="-1",col_name="number",colhdr="Num"},
{width="14",alignment="-1",col_name="type",colhdr="Type"},
{width="4",alignment="-1",col_name="disp",colhdr="Disp"},
{width="3",alignment="-1",col_name="enabled",colhdr="Enb"},
{width="10",alignment="-1",col_name="addr",colhdr="Address"},
{width="40",alignment="2",col_name="what",colhdr="What"}],
body=[bkpt={number="1",type="breakpoint",disp="keep",enabled="y",
addr="0x00010734",func="callee4",
file="../../../devo/gdb/testsuite/gdb.mi/basics.c",
fullname="/home/foo/devo/gdb/testsuite/gdb.mi/basics.c",line="8",thread-groups=["i1"],
times="1"},
bkpt={number="2",type="watchpoint",disp="keep",
enabled="y",addr="",what="C",thread-groups=["i1"],times="-5"}]}
(gdb)
-exec-continue
^running
^done,reason="watchpoint-scope",wpnum="2",
frame={func="callee3",args=[{name="strarg",
value="0x11940 "A string argument.""}],
file="../../../devo/gdb/testsuite/gdb.mi/basics.c",
fullname="/home/foo/bar/devo/gdb/testsuite/gdb.mi/basics.c",line="18",
arch="i386:x86_64"}
(gdb)
-break-list
^done,BreakpointTable={nr_rows="1",nr_cols="6",
hdr=[{width="3",alignment="-1",col_name="number",colhdr="Num"},
{width="14",alignment="-1",col_name="type",colhdr="Type"},
{width="4",alignment="-1",col_name="disp",colhdr="Disp"},
{width="3",alignment="-1",col_name="enabled",colhdr="Enb"},
{width="10",alignment="-1",col_name="addr",colhdr="Address"},
{width="40",alignment="2",col_name="what",colhdr="What"}],
body=[bkpt={number="1",type="breakpoint",disp="keep",enabled="y",
addr="0x00010734",func="callee4",
file="../../../devo/gdb/testsuite/gdb.mi/basics.c",
fullname="/home/foo/devo/gdb/testsuite/gdb.mi/basics.c",line="8",
thread-groups=["i1"],times="1"}]}
(gdb)
27.9 GDB/MI Catchpoint Commands
This section documents GDB/MI commands for manipulating
catchpoints.
27.9.1 Shared Library GDB/MI Catchpoints
The -catch-load Command
Synopsis
-catch-load [ -t ] [ -d ] regexp
Add a catchpoint for library load events. If the ‘-t’ option is used,
the catchpoint is a temporary one (see Setting
Breakpoints). If the ‘-d’ option is used, the catchpoint is created
in a disabled state. The ‘regexp’ argument is a regular
expression used to match the name of the loaded library.
GDB Command
The corresponding GDB command is ‘catch load’.
Example
-catch-load -t foo.so
^done,bkpt={number="1",type="catchpoint",disp="del",enabled="y",
what="load of library matching foo.so",catch-type="load",times="0"}
(gdb)
The -catch-unload Command
Synopsis
-catch-unload [ -t ] [ -d ] regexp
Add a catchpoint for library unload events. If the ‘-t’ option is
used, the catchpoint is a temporary one (see Setting
Breakpoints). If the ‘-d’ option is used, the catchpoint is
created in a disabled state. The ‘regexp’ argument is a regular
expression used to match the name of the unloaded library.
GDB Command
The corresponding GDB command is ‘catch unload’.
Example
-catch-unload -d bar.so
^done,bkpt={number="2",type="catchpoint",disp="keep",enabled="n",
what="load of library matching bar.so",catch-type="unload",times="0"}
(gdb)
27.9.2 Ada Exception GDB/MI Catchpoints
The following GDB/MI commands can be used to create catchpoints
that stop the execution when Ada exceptions are being raised.
The -catch-assert Command
Synopsis
-catch-assert [ -c condition] [ -d ] [ -t ]
Add a catchpoint for failed Ada assertions.
The possible optional parameters for this command are:
- ‘-c condition’
-
Make the catchpoint conditional on condition.
- ‘-d’
-
Create a disabled catchpoint.
- ‘-t’
-
Create a temporary catchpoint.
GDB Command
The corresponding GDB command is ‘catch assert’.
Example
-catch-assert
^done,bkptno="5",bkpt={number="5",type="breakpoint",disp="keep",
enabled="y",addr="0x0000000000404888",what="failed Ada assertions",
thread-groups=["i1"],times="0",
original-location="__gnat_debug_raise_assert_failure"}
(gdb)
The -catch-exception Command
Synopsis
-catch-exception [ -c condition] [ -d ] [ -e exception-name ]
[ -t ] [ -u ]
Add a catchpoint stopping when Ada exceptions are raised.
By default, the command stops the program when any Ada exception
gets raised. But it is also possible, by using some of the
optional parameters described below, to create more selective
catchpoints.
The possible optional parameters for this command are:
- ‘-c condition’
-
Make the catchpoint conditional on condition.
- ‘-d’
-
Create a disabled catchpoint.
- ‘-e exception-name’
-
Only stop when exception-name is raised. This option cannot
be used combined with ‘-u’. - ‘-t’
-
Create a temporary catchpoint.
- ‘-u’
-
Stop only when an unhandled exception gets raised. This option
cannot be used combined with ‘-e’.
GDB Command
The corresponding GDB commands are ‘catch exception’
and ‘catch exception unhandled’.
Example
-catch-exception -e Program_Error
^done,bkptno="4",bkpt={number="4",type="breakpoint",disp="keep",
enabled="y",addr="0x0000000000404874",
what="`Program_Error' Ada exception", thread-groups=["i1"],
times="0",original-location="__gnat_debug_raise_exception"}
(gdb)
The -catch-handlers Command
Synopsis
-catch-handlers [ -c condition] [ -d ] [ -e exception-name ]
[ -t ]
Add a catchpoint stopping when Ada exceptions are handled.
By default, the command stops the program when any Ada exception
gets handled. But it is also possible, by using some of the
optional parameters described below, to create more selective
catchpoints.
The possible optional parameters for this command are:
- ‘-c condition’
-
Make the catchpoint conditional on condition.
- ‘-d’
-
Create a disabled catchpoint.
- ‘-e exception-name’
-
Only stop when exception-name is handled.
- ‘-t’
-
Create a temporary catchpoint.
GDB Command
The corresponding GDB command is ‘catch handlers’.
Example
-catch-handlers -e Constraint_Error
^done,bkptno="4",bkpt={number="4",type="breakpoint",disp="keep",
enabled="y",addr="0x0000000000402f68",
what="`Constraint_Error' Ada exception handlers",thread-groups=["i1"],
times="0",original-location="__gnat_begin_handler"}
(gdb)
27.9.3 C++ Exception GDB/MI Catchpoints
The following GDB/MI commands can be used to create catchpoints
that stop the execution when C++ exceptions are being throw, rethrown,
or caught.
The -catch-throw Command
Synopsis
-catch-throw [ -t ] [ -r regexp]
Stop when the debuggee throws a C++ exception. If regexp is
given, then only exceptions whose type matches the regular expression
will be caught.
If ‘-t’ is given, then the catchpoint is enabled only for one
stop, the catchpoint is automatically deleted after stopping once for
the event.
GDB Command
The corresponding GDB commands are ‘catch throw’
and ‘tcatch throw’ (see Set Catchpoints).
Example
-catch-throw -r exception_type
^done,bkpt={number="1",type="catchpoint",disp="keep",enabled="y",
what="exception throw",catch-type="throw",
thread-groups=["i1"],
regexp="exception_type",times="0"}
(gdb)
-exec-run
^running
(gdb)
~"n"
~"Catchpoint 1 (exception thrown), 0x00007ffff7ae00ed
in __cxa_throw () from /lib64/libstdc++.so.6n"
*stopped,bkptno="1",reason="breakpoint-hit",disp="keep",
frame={addr="0x00007ffff7ae00ed",func="__cxa_throw",
args=[],from="/lib64/libstdc++.so.6",arch="i386:x86-64"},
thread-id="1",stopped-threads="all",core="6"
(gdb)
The -catch-rethrow Command
Synopsis
-catch-rethrow [ -t ] [ -r regexp]
Stop when a C++ exception is re-thrown. If regexp is given,
then only exceptions whose type matches the regular expression will be
caught.
If ‘-t’ is given, then the catchpoint is enabled only for one
stop, the catchpoint is automatically deleted after the first event is
caught.
GDB Command
The corresponding GDB commands are ‘catch rethrow’
and ‘tcatch rethrow’ (see Set Catchpoints).
Example
-catch-rethrow -r exception_type
^done,bkpt={number="1",type="catchpoint",disp="keep",enabled="y",
what="exception rethrow",catch-type="rethrow",
thread-groups=["i1"],
regexp="exception_type",times="0"}
(gdb)
-exec-run
^running
(gdb)
~"n"
~"Catchpoint 1 (exception rethrown), 0x00007ffff7ae00ed
in __cxa_rethrow () from /lib64/libstdc++.so.6n"
*stopped,bkptno="1",reason="breakpoint-hit",disp="keep",
frame={addr="0x00007ffff7ae00ed",func="__cxa_rethrow",
args=[],from="/lib64/libstdc++.so.6",arch="i386:x86-64"},
thread-id="1",stopped-threads="all",core="6"
(gdb)
The -catch-catch Command
Synopsis
-catch-catch [ -t ] [ -r regexp]
Stop when the debuggee catches a C++ exception. If regexp
is given, then only exceptions whose type matches the regular
expression will be caught.
If ‘-t’ is given, then the catchpoint is enabled only for one
stop, the catchpoint is automatically deleted after the first event is
caught.
GDB Command
The corresponding GDB commands are ‘catch catch’
and ‘tcatch catch’ (see Set Catchpoints).
Example
-catch-catch -r exception_type
^done,bkpt={number="1",type="catchpoint",disp="keep",enabled="y",
what="exception catch",catch-type="catch",
thread-groups=["i1"],
regexp="exception_type",times="0"}
(gdb)
-exec-run
^running
(gdb)
~"n"
~"Catchpoint 1 (exception caught), 0x00007ffff7ae00ed
in __cxa_begin_catch () from /lib64/libstdc++.so.6n"
*stopped,bkptno="1",reason="breakpoint-hit",disp="keep",
frame={addr="0x00007ffff7ae00ed",func="__cxa_begin_catch",
args=[],from="/lib64/libstdc++.so.6",arch="i386:x86-64"},
thread-id="1",stopped-threads="all",core="6"
(gdb)
27.10 GDB/MI Program Context
The -exec-arguments Command
Synopsis
Set the inferior program arguments, to be used in the next
‘-exec-run’.
GDB Command
The corresponding GDB command is ‘set args’.
Example
(gdb) -exec-arguments -v word ^done (gdb)
The -environment-cd Command
Synopsis
Set GDB’s working directory.
GDB Command
The corresponding GDB command is ‘cd’.
Example
(gdb) -environment-cd /kwikemart/marge/ezannoni/flathead-dev/devo/gdb ^done (gdb)
The -environment-directory Command
Synopsis
-environment-directory [ -r ] [ pathdir ]+
Add directories pathdir to beginning of search path for source files.
If the ‘-r’ option is used, the search path is reset to the default
search path. If directories pathdir are supplied in addition to the
‘-r’ option, the search path is first reset and then addition
occurs as normal.
Multiple directories may be specified, separated by blanks. Specifying
multiple directories in a single command
results in the directories added to the beginning of the
search path in the same order they were presented in the command.
If blanks are needed as
part of a directory name, double-quotes should be used around
the name. In the command output, the path will show up separated
by the system directory-separator character. The directory-separator
character must not be used
in any directory name.
If no directories are specified, the current search path is displayed.
GDB Command
The corresponding GDB command is ‘dir’.
Example
(gdb) -environment-directory /kwikemart/marge/ezannoni/flathead-dev/devo/gdb ^done,source-path="/kwikemart/marge/ezannoni/flathead-dev/devo/gdb:$cdir:$cwd" (gdb) -environment-directory "" ^done,source-path="/kwikemart/marge/ezannoni/flathead-dev/devo/gdb:$cdir:$cwd" (gdb) -environment-directory -r /home/jjohnstn/src/gdb /usr/src ^done,source-path="/home/jjohnstn/src/gdb:/usr/src:$cdir:$cwd" (gdb) -environment-directory -r ^done,source-path="$cdir:$cwd" (gdb)
The -environment-path Command
Synopsis
-environment-path [ -r ] [ pathdir ]+
Add directories pathdir to beginning of search path for object files.
If the ‘-r’ option is used, the search path is reset to the original
search path that existed at gdb start-up. If directories pathdir are
supplied in addition to the
‘-r’ option, the search path is first reset and then addition
occurs as normal.
Multiple directories may be specified, separated by blanks. Specifying
multiple directories in a single command
results in the directories added to the beginning of the
search path in the same order they were presented in the command.
If blanks are needed as
part of a directory name, double-quotes should be used around
the name. In the command output, the path will show up separated
by the system directory-separator character. The directory-separator
character must not be used
in any directory name.
If no directories are specified, the current path is displayed.
GDB Command
The corresponding GDB command is ‘path’.
Example
(gdb) -environment-path ^done,path="/usr/bin" (gdb) -environment-path /kwikemart/marge/ezannoni/flathead-dev/ppc-eabi/gdb /bin ^done,path="/kwikemart/marge/ezannoni/flathead-dev/ppc-eabi/gdb:/bin:/usr/bin" (gdb) -environment-path -r /usr/local/bin ^done,path="/usr/local/bin:/usr/bin" (gdb)
The -environment-pwd Command
Synopsis
Show the current working directory.
GDB Command
The corresponding GDB command is ‘pwd’.
Example
(gdb) -environment-pwd ^done,cwd="/kwikemart/marge/ezannoni/flathead-dev/devo/gdb" (gdb)
27.11 GDB/MI Thread Commands
The -thread-info Command
Synopsis
-thread-info [ thread-id ]
Reports information about either a specific thread, if the
thread-id parameter is present, or about all threads.
thread-id is the thread’s global thread ID. When printing
information about all threads, also reports the global ID of the
current thread.
GDB Command
The ‘info thread’ command prints the same information
about all threads.
Result
The result contains the following attributes:
- ‘threads’
-
A list of threads. The format of the elements of the list is described in
GDB/MI Thread Information. - ‘current-thread-id’
-
The global id of the currently selected thread. This field is omitted if there
is no selected thread (for example, when the selected inferior is not running,
and therefore has no threads) or if a thread-id argument was passed to
the command.
Example
-thread-info
^done,threads=[
{id="2",target-id="Thread 0xb7e14b90 (LWP 21257)",
frame={level="0",addr="0xffffe410",func="__kernel_vsyscall",
args=[]},state="running"},
{id="1",target-id="Thread 0xb7e156b0 (LWP 21254)",
frame={level="0",addr="0x0804891f",func="foo",
args=[{name="i",value="10"}],
file="/tmp/a.c",fullname="/tmp/a.c",line="158",arch="i386:x86_64"},
state="running"}],
current-thread-id="1"
(gdb)
The -thread-list-ids Command
Synopsis
Produces a list of the currently known global GDB thread ids.
At the end of the list it also prints the total number of such
threads.
This command is retained for historical reasons, the
-thread-info command should be used instead.
GDB Command
Part of ‘info threads’ supplies the same information.
Example
(gdb)
-thread-list-ids
^done,thread-ids={thread-id="3",thread-id="2",thread-id="1"},
current-thread-id="1",number-of-threads="3"
(gdb)
The -thread-select Command
Synopsis
Make thread with global thread number thread-id the current
thread. It prints the number of the new current thread, and the
topmost frame for that thread.
This command is deprecated in favor of explicitly using the
‘—thread’ option to each command.
GDB Command
The corresponding GDB command is ‘thread’.
Example
(gdb)
-exec-next
^running
(gdb)
*stopped,reason="end-stepping-range",thread-id="2",line="187",
file="../../../devo/gdb/testsuite/gdb.threads/linux-dp.c"
(gdb)
-thread-list-ids
^done,
thread-ids={thread-id="3",thread-id="2",thread-id="1"},
number-of-threads="3"
(gdb)
-thread-select 3
^done,new-thread-id="3",
frame={level="0",func="vprintf",
args=[{name="format",value="0x8048e9c "%*s%c %d %c\n""},
{name="arg",value="0x2"}],file="vprintf.c",line="31",arch="i386:x86_64"}
(gdb)
27.12 GDB/MI Ada Tasking Commands
The -ada-task-info Command
Synopsis
-ada-task-info [ task-id ]
Reports information about either a specific Ada task, if the
task-id parameter is present, or about all Ada tasks.
GDB Command
The ‘info tasks’ command prints the same information
about all Ada tasks (see Ada Tasks).
Result
The result is a table of Ada tasks. The following columns are
defined for each Ada task:
- ‘current’
-
This field exists only for the current thread. It has the value ‘*’.
- ‘id’
-
The identifier that GDB uses to refer to the Ada task.
- ‘task-id’
-
The identifier that the target uses to refer to the Ada task.
- ‘thread-id’
-
The global thread identifier of the thread corresponding to the Ada
task.This field should always exist, as Ada tasks are always implemented
on top of a thread. But if GDB cannot find this corresponding
thread for any reason, the field is omitted. - ‘parent-id’
-
This field exists only when the task was created by another task.
In this case, it provides the ID of the parent task. - ‘priority’
-
The base priority of the task.
- ‘state’
-
The current state of the task. For a detailed description of the
possible states, see Ada Tasks. - ‘name’
-
The name of the task.
Example
-ada-task-info
^done,tasks={nr_rows="3",nr_cols="8",
hdr=[{width="1",alignment="-1",col_name="current",colhdr=""},
{width="3",alignment="1",col_name="id",colhdr="ID"},
{width="9",alignment="1",col_name="task-id",colhdr="TID"},
{width="4",alignment="1",col_name="thread-id",colhdr=""},
{width="4",alignment="1",col_name="parent-id",colhdr="P-ID"},
{width="3",alignment="1",col_name="priority",colhdr="Pri"},
{width="22",alignment="-1",col_name="state",colhdr="State"},
{width="1",alignment="2",col_name="name",colhdr="Name"}],
body=[{current="*",id="1",task-id=" 644010",thread-id="1",priority="48",
state="Child Termination Wait",name="main_task"}]}
(gdb)
27.13 GDB/MI Program Execution
These are the asynchronous commands which generate the out-of-band
record ‘*stopped’. Currently GDB only really executes
asynchronously with remote targets and this interaction is mimicked in
other cases.
The -exec-continue Command
Synopsis
-exec-continue [--reverse] [--all|--thread-group N]
Resumes the execution of the inferior program, which will continue
to execute until it reaches a debugger stop event. If the
‘—reverse’ option is specified, execution resumes in reverse until
it reaches a stop event. Stop events may include
- breakpoints or watchpoints
- signals or exceptions
- the end of the process (or its beginning under ‘—reverse’)
- the end or beginning of a replay log if one is being used.
In all-stop mode (see All-Stop Mode), may resume only one thread, or all threads, depending on the
value of the ‘scheduler-locking’ variable. If ‘—all’ is
specified, all threads (in all inferiors) will be resumed. The ‘—all’ option is
ignored in all-stop mode. If the ‘—thread-group’ options is
specified, then all threads in that thread group are resumed.
GDB Command
The corresponding GDB corresponding is ‘continue’.
Example
-exec-continue
^running
(gdb)
@Hello world
*stopped,reason="breakpoint-hit",disp="keep",bkptno="2",frame={
func="foo",args=[],file="hello.c",fullname="/home/foo/bar/hello.c",
line="13",arch="i386:x86_64"}
(gdb)
For a ‘breakpoint-hit’ stopped reason, when the breakpoint
encountered has multiple locations, the field ‘bkptno’ is
followed by the field ‘locno’.
-exec-continue
^running
(gdb)
@Hello world
*stopped,reason="breakpoint-hit",disp="keep",bkptno="2",locno="3",frame={
func="foo",args=[],file="hello.c",fullname="/home/foo/bar/hello.c",
line="13",arch="i386:x86_64"}
(gdb)
The -exec-finish Command
Synopsis
Resumes the execution of the inferior program until the current
function is exited. Displays the results returned by the function.
If the ‘—reverse’ option is specified, resumes the reverse
execution of the inferior program until the point where current
function was called.
GDB Command
The corresponding GDB command is ‘finish’.
Example
Function returning void.
-exec-finish
^running
(gdb)
@hello from foo
*stopped,reason="function-finished",frame={func="main",args=[],
file="hello.c",fullname="/home/foo/bar/hello.c",line="7",arch="i386:x86_64"}
(gdb)
Function returning other than void. The name of the internal
GDB variable storing the result is printed, together with the
value itself.
-exec-finish
^running
(gdb)
*stopped,reason="function-finished",frame={addr="0x000107b0",func="foo",
args=[{name="a",value="1"],{name="b",value="9"}},
file="recursive2.c",fullname="/home/foo/bar/recursive2.c",line="14",
arch="i386:x86_64"},
gdb-result-var="$1",return-value="0"
(gdb)
The -exec-interrupt Command
Synopsis
-exec-interrupt [--all|--thread-group N]
Interrupts the background execution of the target. Note how the token
associated with the stop message is the one for the execution command
that has been interrupted. The token for the interrupt itself only
appears in the ‘^done’ output. If the user is trying to
interrupt a non-running program, an error message will be printed.
Note that when asynchronous execution is enabled, this command is
asynchronous just like other execution commands. That is, first the
‘^done’ response will be printed, and the target stop will be
reported after that using the ‘*stopped’ notification.
In non-stop mode, only the context thread is interrupted by default.
All threads (in all inferiors) will be interrupted if the
‘—all’ option is specified. If the ‘—thread-group’
option is specified, all threads in that group will be interrupted.
GDB Command
The corresponding GDB command is ‘interrupt’.
Example
(gdb)
111-exec-continue
111^running
(gdb)
222-exec-interrupt
222^done
(gdb)
111*stopped,signal-name="SIGINT",signal-meaning="Interrupt",
frame={addr="0x00010140",func="foo",args=[],file="try.c",
fullname="/home/foo/bar/try.c",line="13",arch="i386:x86_64"}
(gdb)
(gdb)
-exec-interrupt
^error,msg="mi_cmd_exec_interrupt: Inferior not executing."
(gdb)
The -exec-jump Command
Synopsis
Resumes execution of the inferior program at the address to
which locspec resolves. See Location Specifications,
for a description of the different forms of locspec.
GDB Command
The corresponding GDB command is ‘jump’.
Example
-exec-jump foo.c:10 *running,thread-id="all" ^running
The -exec-next Command
Synopsis
Resumes execution of the inferior program, stopping when the beginning
of the next source line is reached.
If the ‘—reverse’ option is specified, resumes reverse execution
of the inferior program, stopping at the beginning of the previous
source line. If you issue this command on the first line of a
function, it will take you back to the caller of that function, to the
source line where the function was called.
GDB Command
The corresponding GDB command is ‘next’.
Example
-exec-next ^running (gdb) *stopped,reason="end-stepping-range",line="8",file="hello.c" (gdb)
The -exec-next-instruction Command
Synopsis
-exec-next-instruction [--reverse]
Executes one machine instruction. If the instruction is a function
call, continues until the function returns. If the program stops at an
instruction in the middle of a source line, the address will be
printed as well.
If the ‘—reverse’ option is specified, resumes reverse execution
of the inferior program, stopping at the previous instruction. If the
previously executed instruction was a return from another function,
it will continue to execute in reverse until the call to that function
(from the current stack frame) is reached.
GDB Command
The corresponding GDB command is ‘nexti’.
Example
(gdb) -exec-next-instruction ^running (gdb) *stopped,reason="end-stepping-range", addr="0x000100d4",line="5",file="hello.c" (gdb)
The -exec-return Command
Synopsis
Makes current function return immediately. Doesn’t execute the inferior.
Displays the new current frame.
GDB Command
The corresponding GDB command is ‘return’.
Example
(gdb)
200-break-insert callee4
200^done,bkpt={number="1",addr="0x00010734",
file="../../../devo/gdb/testsuite/gdb.mi/basics.c",line="8"}
(gdb)
000-exec-run
000^running
(gdb)
000*stopped,reason="breakpoint-hit",disp="keep",bkptno="1",
frame={func="callee4",args=[],
file="../../../devo/gdb/testsuite/gdb.mi/basics.c",
fullname="/home/foo/bar/devo/gdb/testsuite/gdb.mi/basics.c",line="8",
arch="i386:x86_64"}
(gdb)
205-break-delete
205^done
(gdb)
111-exec-return
111^done,frame={level="0",func="callee3",
args=[{name="strarg",
value="0x11940 "A string argument.""}],
file="../../../devo/gdb/testsuite/gdb.mi/basics.c",
fullname="/home/foo/bar/devo/gdb/testsuite/gdb.mi/basics.c",line="18",
arch="i386:x86_64"}
(gdb)
The -exec-run Command
Synopsis
-exec-run [ --all | --thread-group N ] [ --start ]
Starts execution of the inferior from the beginning. The inferior
executes until either a breakpoint is encountered or the program
exits. In the latter case the output will include an exit code, if
the program has exited exceptionally.
When neither the ‘—all’ nor the ‘—thread-group’ option
is specified, the current inferior is started. If the
‘—thread-group’ option is specified, it should refer to a thread
group of type ‘process’, and that thread group will be started.
If the ‘—all’ option is specified, then all inferiors will be started.
Using the ‘—start’ option instructs the debugger to stop
the execution at the start of the inferior’s main subprogram,
following the same behavior as the start command
(see Starting).
GDB Command
The corresponding GDB command is ‘run’.
Examples
(gdb)
-break-insert main
^done,bkpt={number="1",addr="0x0001072c",file="recursive2.c",line="4"}
(gdb)
-exec-run
^running
(gdb)
*stopped,reason="breakpoint-hit",disp="keep",bkptno="1",
frame={func="main",args=[],file="recursive2.c",
fullname="/home/foo/bar/recursive2.c",line="4",arch="i386:x86_64"}
(gdb)
Program exited normally:
(gdb) -exec-run ^running (gdb) x = 55 *stopped,reason="exited-normally" (gdb)
Program exited exceptionally:
(gdb) -exec-run ^running (gdb) x = 55 *stopped,reason="exited",exit-code="01" (gdb)
Another way the program can terminate is if it receives a signal such as
SIGINT. In this case, GDB/MI displays this:
(gdb) *stopped,reason="exited-signalled",signal-name="SIGINT", signal-meaning="Interrupt"
The -exec-step Command
Synopsis
Resumes execution of the inferior program, stopping when the beginning
of the next source line is reached, if the next source line is not a
function call. If it is, stop at the first instruction of the called
function. If the ‘—reverse’ option is specified, resumes reverse
execution of the inferior program, stopping at the beginning of the
previously executed source line.
GDB Command
The corresponding GDB command is ‘step’.
Example
Stepping into a function:
-exec-step
^running
(gdb)
*stopped,reason="end-stepping-range",
frame={func="foo",args=[{name="a",value="10"},
{name="b",value="0"}],file="recursive2.c",
fullname="/home/foo/bar/recursive2.c",line="11",arch="i386:x86_64"}
(gdb)
Regular stepping:
-exec-step ^running (gdb) *stopped,reason="end-stepping-range",line="14",file="recursive2.c" (gdb)
The -exec-step-instruction Command
Synopsis
-exec-step-instruction [--reverse]
Resumes the inferior which executes one machine instruction. If the
‘—reverse’ option is specified, resumes reverse execution of the
inferior program, stopping at the previously executed instruction.
The output, once GDB has stopped, will vary depending on
whether we have stopped in the middle of a source line or not. In the
former case, the address at which the program stopped will be printed
as well.
GDB Command
The corresponding GDB command is ‘stepi’.
Example
(gdb)
-exec-step-instruction
^running
(gdb)
*stopped,reason="end-stepping-range",
frame={func="foo",args=[],file="try.c",
fullname="/home/foo/bar/try.c",line="10",arch="i386:x86_64"}
(gdb)
-exec-step-instruction
^running
(gdb)
*stopped,reason="end-stepping-range",
frame={addr="0x000100f4",func="foo",args=[],file="try.c",
fullname="/home/foo/bar/try.c",line="10",arch="i386:x86_64"}
(gdb)
The -exec-until Command
Synopsis
Executes the inferior until it reaches the address to which
locspec resolves. If there is no argument, the inferior
executes until it reaches a source line greater than the current one.
The reason for stopping in this case will be ‘location-reached’.
GDB Command
The corresponding GDB command is ‘until’.
Example
(gdb)
-exec-until recursive2.c:6
^running
(gdb)
x = 55
*stopped,reason="location-reached",frame={func="main",args=[],
file="recursive2.c",fullname="/home/foo/bar/recursive2.c",line="6",
arch="i386:x86_64"}
(gdb)
27.14 GDB/MI Stack Manipulation Commands
The -enable-frame-filters Command
GDB allows Python-based frame filters to affect the output of
the MI commands relating to stack traces. As there is no way to
implement this in a fully backward-compatible way, a front end must
request that this functionality be enabled.
Once enabled, this feature cannot be disabled.
Note that if Python support has not been compiled into GDB,
this command will still succeed (and do nothing).
The -stack-info-frame Command
Synopsis
Get info on the selected frame.
GDB Command
The corresponding GDB command is ‘info frame’ or ‘frame’
(without arguments).
Example
(gdb)
-stack-info-frame
^done,frame={level="1",addr="0x0001076c",func="callee3",
file="../../../devo/gdb/testsuite/gdb.mi/basics.c",
fullname="/home/foo/bar/devo/gdb/testsuite/gdb.mi/basics.c",line="17",
arch="i386:x86_64"}
(gdb)
The -stack-info-depth Command
Synopsis
-stack-info-depth [ max-depth ]
Return the depth of the stack. If the integer argument max-depth
is specified, do not count beyond max-depth frames.
GDB Command
There’s no equivalent GDB command.
Example
For a stack with frame levels 0 through 11:
(gdb) -stack-info-depth ^done,depth="12" (gdb) -stack-info-depth 4 ^done,depth="4" (gdb) -stack-info-depth 12 ^done,depth="12" (gdb) -stack-info-depth 11 ^done,depth="11" (gdb) -stack-info-depth 13 ^done,depth="12" (gdb)
The -stack-list-arguments Command
Synopsis
-stack-list-arguments [ --no-frame-filters ] [ --skip-unavailable ] print-values
[ low-frame high-frame ]
Display a list of the arguments for the frames between low-frame
and high-frame (inclusive). If low-frame and
high-frame are not provided, list the arguments for the whole
call stack. If the two arguments are equal, show the single frame
at the corresponding level. It is an error if low-frame is
larger than the actual number of frames. On the other hand,
high-frame may be larger than the actual number of frames, in
which case only existing frames will be returned.
If print-values is 0 or --no-values, print only the names of
the variables; if it is 1 or --all-values, print also their
values; and if it is 2 or --simple-values, print the name,
type and value for simple data types, and the name and type for arrays,
structures and unions. If the option --no-frame-filters is
supplied, then Python frame filters will not be executed.
If the --skip-unavailable option is specified, arguments that
are not available are not listed. Partially available arguments
are still displayed, however.
Use of this command to obtain arguments in a single frame is
deprecated in favor of the ‘-stack-list-variables’ command.
GDB Command
GDB does not have an equivalent command. gdbtk has a
‘gdb_get_args’ command which partially overlaps with the
functionality of ‘-stack-list-arguments’.
Example
(gdb)
-stack-list-frames
^done,
stack=[
frame={level="0",addr="0x00010734",func="callee4",
file="../../../devo/gdb/testsuite/gdb.mi/basics.c",
fullname="/home/foo/bar/devo/gdb/testsuite/gdb.mi/basics.c",line="8",
arch="i386:x86_64"},
frame={level="1",addr="0x0001076c",func="callee3",
file="../../../devo/gdb/testsuite/gdb.mi/basics.c",
fullname="/home/foo/bar/devo/gdb/testsuite/gdb.mi/basics.c",line="17",
arch="i386:x86_64"},
frame={level="2",addr="0x0001078c",func="callee2",
file="../../../devo/gdb/testsuite/gdb.mi/basics.c",
fullname="/home/foo/bar/devo/gdb/testsuite/gdb.mi/basics.c",line="22",
arch="i386:x86_64"},
frame={level="3",addr="0x000107b4",func="callee1",
file="../../../devo/gdb/testsuite/gdb.mi/basics.c",
fullname="/home/foo/bar/devo/gdb/testsuite/gdb.mi/basics.c",line="27",
arch="i386:x86_64"},
frame={level="4",addr="0x000107e0",func="main",
file="../../../devo/gdb/testsuite/gdb.mi/basics.c",
fullname="/home/foo/bar/devo/gdb/testsuite/gdb.mi/basics.c",line="32",
arch="i386:x86_64"}]
(gdb)
-stack-list-arguments 0
^done,
stack-args=[
frame={level="0",args=[]},
frame={level="1",args=[name="strarg"]},
frame={level="2",args=[name="intarg",name="strarg"]},
frame={level="3",args=[name="intarg",name="strarg",name="fltarg"]},
frame={level="4",args=[]}]
(gdb)
-stack-list-arguments 1
^done,
stack-args=[
frame={level="0",args=[]},
frame={level="1",
args=[{name="strarg",value="0x11940 "A string argument.""}]},
frame={level="2",args=[
{name="intarg",value="2"},
{name="strarg",value="0x11940 "A string argument.""}]},
{frame={level="3",args=[
{name="intarg",value="2"},
{name="strarg",value="0x11940 "A string argument.""},
{name="fltarg",value="3.5"}]},
frame={level="4",args=[]}]
(gdb)
-stack-list-arguments 0 2 2
^done,stack-args=[frame={level="2",args=[name="intarg",name="strarg"]}]
(gdb)
-stack-list-arguments 1 2 2
^done,stack-args=[frame={level="2",
args=[{name="intarg",value="2"},
{name="strarg",value="0x11940 "A string argument.""}]}]
(gdb)
The -stack-list-frames Command
Synopsis
-stack-list-frames [ --no-frame-filters low-frame high-frame ]
List the frames currently on the stack. For each frame it displays the
following info:
- ‘level’
-
The frame number, 0 being the topmost frame, i.e., the innermost function.
- ‘addr’
-
The
$pcvalue for that frame. - ‘func’
-
Function name.
- ‘file’
-
File name of the source file where the function lives.
- ‘fullname’
-
The full file name of the source file where the function lives.
- ‘line’
-
Line number corresponding to the
$pc. - ‘from’
-
The shared library where this function is defined. This is only given
if the frame’s function is not known. - ‘arch’
-
Frame’s architecture.
If invoked without arguments, this command prints a backtrace for the
whole stack. If given two integer arguments, it shows the frames whose
levels are between the two arguments (inclusive). If the two arguments
are equal, it shows the single frame at the corresponding level. It is
an error if low-frame is larger than the actual number of
frames. On the other hand, high-frame may be larger than the
actual number of frames, in which case only existing frames will be
returned. If the option --no-frame-filters is supplied, then
Python frame filters will not be executed.
GDB Command
The corresponding GDB commands are ‘backtrace’ and ‘where’.
Example
Full stack backtrace:
(gdb)
-stack-list-frames
^done,stack=
[frame={level="0",addr="0x0001076c",func="foo",
file="recursive2.c",fullname="/home/foo/bar/recursive2.c",line="11",
arch="i386:x86_64"},
frame={level="1",addr="0x000107a4",func="foo",
file="recursive2.c",fullname="/home/foo/bar/recursive2.c",line="14",
arch="i386:x86_64"},
frame={level="2",addr="0x000107a4",func="foo",
file="recursive2.c",fullname="/home/foo/bar/recursive2.c",line="14",
arch="i386:x86_64"},
frame={level="3",addr="0x000107a4",func="foo",
file="recursive2.c",fullname="/home/foo/bar/recursive2.c",line="14",
arch="i386:x86_64"},
frame={level="4",addr="0x000107a4",func="foo",
file="recursive2.c",fullname="/home/foo/bar/recursive2.c",line="14",
arch="i386:x86_64"},
frame={level="5",addr="0x000107a4",func="foo",
file="recursive2.c",fullname="/home/foo/bar/recursive2.c",line="14",
arch="i386:x86_64"},
frame={level="6",addr="0x000107a4",func="foo",
file="recursive2.c",fullname="/home/foo/bar/recursive2.c",line="14",
arch="i386:x86_64"},
frame={level="7",addr="0x000107a4",func="foo",
file="recursive2.c",fullname="/home/foo/bar/recursive2.c",line="14",
arch="i386:x86_64"},
frame={level="8",addr="0x000107a4",func="foo",
file="recursive2.c",fullname="/home/foo/bar/recursive2.c",line="14",
arch="i386:x86_64"},
frame={level="9",addr="0x000107a4",func="foo",
file="recursive2.c",fullname="/home/foo/bar/recursive2.c",line="14",
arch="i386:x86_64"},
frame={level="10",addr="0x000107a4",func="foo",
file="recursive2.c",fullname="/home/foo/bar/recursive2.c",line="14",
arch="i386:x86_64"},
frame={level="11",addr="0x00010738",func="main",
file="recursive2.c",fullname="/home/foo/bar/recursive2.c",line="4",
arch="i386:x86_64"}]
(gdb)
Show frames between low_frame and high_frame:
(gdb)
-stack-list-frames 3 5
^done,stack=
[frame={level="3",addr="0x000107a4",func="foo",
file="recursive2.c",fullname="/home/foo/bar/recursive2.c",line="14",
arch="i386:x86_64"},
frame={level="4",addr="0x000107a4",func="foo",
file="recursive2.c",fullname="/home/foo/bar/recursive2.c",line="14",
arch="i386:x86_64"},
frame={level="5",addr="0x000107a4",func="foo",
file="recursive2.c",fullname="/home/foo/bar/recursive2.c",line="14",
arch="i386:x86_64"}]
(gdb)
Show a single frame:
(gdb)
-stack-list-frames 3 3
^done,stack=
[frame={level="3",addr="0x000107a4",func="foo",
file="recursive2.c",fullname="/home/foo/bar/recursive2.c",line="14",
arch="i386:x86_64"}]
(gdb)
The -stack-list-locals Command
Synopsis
-stack-list-locals [ --no-frame-filters ] [ --skip-unavailable ] print-values
Display the local variable names for the selected frame. If
print-values is 0 or --no-values, print only the names of
the variables; if it is 1 or --all-values, print also their
values; and if it is 2 or --simple-values, print the name,
type and value for simple data types, and the name and type for arrays,
structures and unions. In this last case, a frontend can immediately
display the value of simple data types and create variable objects for
other data types when the user wishes to explore their values in
more detail. If the option --no-frame-filters is supplied, then
Python frame filters will not be executed.
If the --skip-unavailable option is specified, local variables
that are not available are not listed. Partially available local
variables are still displayed, however.
This command is deprecated in favor of the
‘-stack-list-variables’ command.
GDB Command
‘info locals’ in GDB, ‘gdb_get_locals’ in gdbtk.
Example
(gdb)
-stack-list-locals 0
^done,locals=[name="A",name="B",name="C"]
(gdb)
-stack-list-locals --all-values
^done,locals=[{name="A",value="1"},{name="B",value="2"},
{name="C",value="{1, 2, 3}"}]
-stack-list-locals --simple-values
^done,locals=[{name="A",type="int",value="1"},
{name="B",type="int",value="2"},{name="C",type="int [3]"}]
(gdb)
The -stack-list-variables Command
Synopsis
-stack-list-variables [ --no-frame-filters ] [ --skip-unavailable ] print-values
Display the names of local variables and function arguments for the selected frame. If
print-values is 0 or --no-values, print only the names of
the variables; if it is 1 or --all-values, print also their
values; and if it is 2 or --simple-values, print the name,
type and value for simple data types, and the name and type for arrays,
structures and unions. If the option --no-frame-filters is
supplied, then Python frame filters will not be executed.
If the --skip-unavailable option is specified, local variables
and arguments that are not available are not listed. Partially
available arguments and local variables are still displayed, however.
Example
(gdb)
-stack-list-variables --thread 1 --frame 0 --all-values
^done,variables=[{name="x",value="11"},{name="s",value="{a = 1, b = 2}"}]
(gdb)
The -stack-select-frame Command
Synopsis
-stack-select-frame framenum
Change the selected frame. Select a different frame framenum on
the stack.
This command in deprecated in favor of passing the ‘—frame’
option to every command.
GDB Command
The corresponding GDB commands are ‘frame’, ‘up’,
‘down’, ‘select-frame’, ‘up-silent’, and ‘down-silent’.
Example
(gdb) -stack-select-frame 2 ^done (gdb)
27.15 GDB/MI Variable Objects
Introduction to Variable Objects
Variable objects are «object-oriented» MI interface for examining and
changing values of expressions. Unlike some other MI interfaces that
work with expressions, variable objects are specifically designed for
simple and efficient presentation in the frontend. A variable object
is identified by string name. When a variable object is created, the
frontend specifies the expression for that variable object. The
expression can be a simple variable, or it can be an arbitrary complex
expression, and can even involve CPU registers. After creating a
variable object, the frontend can invoke other variable object
operations—for example to obtain or change the value of a variable
object, or to change display format.
Variable objects have hierarchical tree structure. Any variable object
that corresponds to a composite type, such as structure in C, has
a number of child variable objects, for example corresponding to each
element of a structure. A child variable object can itself have
children, recursively. Recursion ends when we reach
leaf variable objects, which always have built-in types. Child variable
objects are created only by explicit request, so if a frontend
is not interested in the children of a particular variable object, no
child will be created.
For a leaf variable object it is possible to obtain its value as a
string, or set the value from a string. String value can be also
obtained for a non-leaf variable object, but it’s generally a string
that only indicates the type of the object, and does not list its
contents. Assignment to a non-leaf variable object is not allowed.
A frontend does not need to read the values of all variable objects each time
the program stops. Instead, MI provides an update command that lists all
variable objects whose values has changed since the last update
operation. This considerably reduces the amount of data that must
be transferred to the frontend. As noted above, children variable
objects are created on demand, and only leaf variable objects have a
real value. As result, gdb will read target memory only for leaf
variables that frontend has created.
The automatic update is not always desirable. For example, a frontend
might want to keep a value of some expression for future reference,
and never update it. For another example, fetching memory is
relatively slow for embedded targets, so a frontend might want
to disable automatic update for the variables that are either not
visible on the screen, or “closed”. This is possible using so
called “frozen variable objects”. Such variable objects are never
implicitly updated.
Variable objects can be either fixed or floating. For the
fixed variable object, the expression is parsed when the variable
object is created, including associating identifiers to specific
variables. The meaning of expression never changes. For a floating
variable object the values of variables whose names appear in the
expressions are re-evaluated every time in the context of the current
frame. Consider this example:
void do_work(...)
{
struct work_state state;
if (...)
do_work(...);
}
If a fixed variable object for the state variable is created in
this function, and we enter the recursive call, the variable
object will report the value of state in the top-level
do_work invocation. On the other hand, a floating variable
object will report the value of state in the current frame.
If an expression specified when creating a fixed variable object
refers to a local variable, the variable object becomes bound to the
thread and frame in which the variable object is created. When such
variable object is updated, GDB makes sure that the
thread/frame combination the variable object is bound to still exists,
and re-evaluates the variable object in context of that thread/frame.
The following is the complete set of GDB/MI operations defined to
access this functionality:
| Operation | Description |
-enable-pretty-printing |
enable Python-based pretty-printing |
-var-create |
create a variable object |
-var-delete |
delete the variable object and/or its children |
-var-set-format |
set the display format of this variable |
-var-show-format |
show the display format of this variable |
-var-info-num-children |
tells how many children this object has |
-var-list-children |
return a list of the object’s children |
-var-info-type |
show the type of this variable object |
-var-info-expression |
print parent-relative expression that this variable object represents |
-var-info-path-expression |
print full expression that this variable object represents |
-var-show-attributes |
is this variable editable? does it exist here? |
-var-evaluate-expression |
get the value of this variable |
-var-assign |
set the value of this variable |
-var-update |
update the variable and its children |
-var-set-frozen |
set frozenness attribute |
-var-set-update-range |
set range of children to display on update |
In the next subsection we describe each operation in detail and suggest
how it can be used.
Description And Use of Operations on Variable Objects
The -enable-pretty-printing Command
GDB allows Python-based visualizers to affect the output of the
MI variable object commands. However, because there was no way to
implement this in a fully backward-compatible way, a front end must
request that this functionality be enabled.
Once enabled, this feature cannot be disabled.
Note that if Python support has not been compiled into GDB,
this command will still succeed (and do nothing).
The -var-create Command
Synopsis
-var-create {name | "-"}
{frame-addr | "*" | "@"} expression
This operation creates a variable object, which allows the monitoring of
a variable, the result of an expression, a memory cell or a CPU
register.
The name parameter is the string by which the object can be
referenced. It must be unique. If ‘—’ is specified, the varobj
system will generate a string “varNNNNNN” automatically. It will be
unique provided that one does not specify name of that format.
The command fails if a duplicate name is found.
The frame under which the expression should be evaluated can be
specified by frame-addr. A ‘*’ indicates that the current
frame should be used. A ‘@’ indicates that a floating variable
object must be created.
expression is any expression valid on the current language set (must not
begin with a ‘*’), or one of the following:
- ‘*addr’, where addr is the address of a memory cell
- ‘*addr—addr’ — a memory address range (TBD)
- ‘$regname’ — a CPU register name
A varobj’s contents may be provided by a Python-based pretty-printer. In this
case the varobj is known as a dynamic varobj. Dynamic varobjs
have slightly different semantics in some cases. If the
-enable-pretty-printing command is not sent, then GDB
will never create a dynamic varobj. This ensures backward
compatibility for existing clients.
Result
This operation returns attributes of the newly-created varobj. These
are:
- ‘name’
-
The name of the varobj.
- ‘numchild’
-
The number of children of the varobj. This number is not necessarily
reliable for a dynamic varobj. Instead, you must examine the
‘has_more’ attribute. - ‘value’
-
The varobj’s scalar value. For a varobj whose type is some sort of
aggregate (e.g., astruct), or for a dynamic varobj, this value
will not be interesting. - ‘type’
-
The varobj’s type. This is a string representation of the type, as
would be printed by the GDB CLI. If ‘print object’
(see set print object) is set toon, the
actual (derived) type of the object is shown rather than the
declared one. - ‘thread-id’
-
If a variable object is bound to a specific thread, then this is the
thread’s global identifier. - ‘has_more’
-
For a dynamic varobj, this indicates whether there appear to be any
children available. For a non-dynamic varobj, this will be 0. - ‘dynamic’
-
This attribute will be present and have the value ‘1’ if the
varobj is a dynamic varobj. If the varobj is not a dynamic varobj,
then this attribute will not be present. - ‘displayhint’
-
A dynamic varobj can supply a display hint to the front end. The
value comes directly from the Python pretty-printer object’s
display_hintmethod. See Pretty Printing API.
Typical output will look like this:
name="name",numchild="N",type="type",thread-id="M", has_more="has_more"
The -var-delete Command
Synopsis
Deletes a previously created variable object and all of its children.
With the ‘-c’ option, just deletes the children.
Returns an error if the object name is not found.
The -var-set-format Command
Synopsis
-var-set-format name format-spec
Sets the output format for the value of the object name to be
format-spec.
The syntax for the format-spec is as follows:
format-spec →
{binary | decimal | hexadecimal | octal | natural | zero-hexadecimal}
The natural format is the default format choosen automatically
based on the variable type (like decimal for an int, hex
for pointers, etc.).
The zero-hexadecimal format has a representation similar to hexadecimal
but with padding zeroes to the left of the value. For example, a 32-bit
hexadecimal value of 0x1234 would be represented as 0x00001234 in the
zero-hexadecimal format.
For a variable with children, the format is set only on the
variable itself, and the children are not affected.
The -var-show-format Command
Synopsis
Returns the format used to display the value of the object name.
The -var-info-num-children Command
Synopsis
-var-info-num-children name
Returns the number of children of a variable object name:
Note that this number is not completely reliable for a dynamic varobj.
It will return the current number of children, but more children may
be available.
The -var-list-children Command
Synopsis
-var-list-children [print-values] name [from to]
Return a list of the children of the specified variable object and
create variable objects for them, if they do not already exist. With
a single argument or if print-values has a value of 0 or
--no-values, print only the names of the variables; if
print-values is 1 or --all-values, also print their
values; and if it is 2 or --simple-values print the name and
value for simple data types and just the name for arrays, structures
and unions.
from and to, if specified, indicate the range of children
to report. If from or to is less than zero, the range is
reset and all children will be reported. Otherwise, children starting
at from (zero-based) and up to and excluding to will be
reported.
If a child range is requested, it will only affect the current call to
-var-list-children, but not future calls to -var-update.
For this, you must instead use -var-set-update-range. The
intent of this approach is to enable a front end to implement any
update approach it likes; for example, scrolling a view may cause the
front end to request more children with -var-list-children, and
then the front end could call -var-set-update-range with a
different range to ensure that future updates are restricted to just
the visible items.
For each child the following results are returned:
- name
-
Name of the variable object created for this child.
- exp
-
The expression to be shown to the user by the front end to designate this child.
For example this may be the name of a structure member.For a dynamic varobj, this value cannot be used to form an
expression. There is no way to do this at all with a dynamic varobj.For C/C++ structures there are several pseudo children returned to
designate access qualifiers. For these pseudo children exp is
‘public’, ‘private’, or ‘protected’. In this case the
type and value are not present.A dynamic varobj will not report the access qualifying
pseudo-children, regardless of the language. This information is not
available at all with a dynamic varobj. - numchild
-
Number of children this child has. For a dynamic varobj, this will be
0. - type
-
The type of the child. If ‘print object’
(see set print object) is set toon, the
actual (derived) type of the object is shown rather than the
declared one. - value
-
If values were requested, this is the value.
- thread-id
-
If this variable object is associated with a thread, this is the
thread’s global thread id. Otherwise this result is not present. - frozen
-
If the variable object is frozen, this variable will be present with a value of 1.
- displayhint
-
A dynamic varobj can supply a display hint to the front end. The
value comes directly from the Python pretty-printer object’s
display_hintmethod. See Pretty Printing API. - dynamic
-
This attribute will be present and have the value ‘1’ if the
varobj is a dynamic varobj. If the varobj is not a dynamic varobj,
then this attribute will not be present.
The result may have its own attributes:
- ‘displayhint’
-
A dynamic varobj can supply a display hint to the front end. The
value comes directly from the Python pretty-printer object’s
display_hintmethod. See Pretty Printing API. - ‘has_more’
-
This is an integer attribute which is nonzero if there are children
remaining after the end of the selected range.
Example
(gdb)
-var-list-children n
^done,numchild=n,children=[child={name=name,exp=exp,
numchild=n,type=type},(repeats N times)]
(gdb)
-var-list-children --all-values n
^done,numchild=n,children=[child={name=name,exp=exp,
numchild=n,value=value,type=type},(repeats N times)]
The -var-info-type Command
Synopsis
Returns the type of the specified variable name. The type is
returned as a string in the same format as it is output by the
GDB CLI:
The -var-info-expression Command
Synopsis
-var-info-expression name
Returns a string that is suitable for presenting this
variable object in user interface. The string is generally
not valid expression in the current language, and cannot be evaluated.
For example, if a is an array, and variable object
A was created for a, then we’ll get this output:
(gdb) -var-info-expression A.1 ^done,lang="C",exp="1"
Here, the value of lang is the language name, which can be
found in Supported Languages.
Note that the output of the -var-list-children command also
includes those expressions, so the -var-info-expression command
is of limited use.
The -var-info-path-expression Command
Synopsis
-var-info-path-expression name
Returns an expression that can be evaluated in the current
context and will yield the same value that a variable object has.
Compare this with the -var-info-expression command, which
result can be used only for UI presentation. Typical use of
the -var-info-path-expression command is creating a
watchpoint from a variable object.
This command is currently not valid for children of a dynamic varobj,
and will give an error when invoked on one.
For example, suppose C is a C++ class, derived from class
Base, and that the Base class has a member called
m_size. Assume a variable c is has the type of
C and a variable object C was created for variable
c. Then, we’ll get this output:
(gdb) -var-info-path-expression C.Base.public.m_size ^done,path_expr=((Base)c).m_size)
The -var-show-attributes Command
Synopsis
-var-show-attributes name
List attributes of the specified variable object name:
status=attr [ ( ,attr )* ]
where attr is { { editable | noneditable } | TBD }.
The -var-evaluate-expression Command
Synopsis
-var-evaluate-expression [-f format-spec] name
Evaluates the expression that is represented by the specified variable
object and returns its value as a string. The format of the string
can be specified with the ‘-f’ option. The possible values of
this option are the same as for -var-set-format
(see -var-set-format). If the ‘-f’ option is not specified,
the current display format will be used. The current display format
can be changed using the -var-set-format command.
Note that one must invoke -var-list-children for a variable
before the value of a child variable can be evaluated.
The -var-assign Command
Synopsis
-var-assign name expression
Assigns the value of expression to the variable object specified
by name. The object must be ‘editable’. If the variable’s
value is altered by the assign, the variable will show up in any
subsequent -var-update list.
Example
(gdb)
-var-assign var1 3
^done,value="3"
(gdb)
-var-update *
^done,changelist=[{name="var1",in_scope="true",type_changed="false"}]
(gdb)
The -var-update Command
Synopsis
-var-update [print-values] {name | "*"}
Reevaluate the expressions corresponding to the variable object
name and all its direct and indirect children, and return the
list of variable objects whose values have changed; name must
be a root variable object. Here, “changed” means that the result of
-var-evaluate-expression before and after the
-var-update is different. If ‘*’ is used as the variable
object names, all existing variable objects are updated, except
for frozen ones (see -var-set-frozen). The option
print-values determines whether both names and values, or just
names are printed. The possible values of this option are the same
as for -var-list-children (see -var-list-children). It is
recommended to use the ‘—all-values’ option, to reduce the
number of MI commands needed on each program stop.
With the ‘*’ parameter, if a variable object is bound to a
currently running thread, it will not be updated, without any
diagnostic.
If -var-set-update-range was previously used on a varobj, then
only the selected range of children will be reported.
-var-update reports all the changed varobjs in a tuple named
‘changelist’.
Each item in the change list is itself a tuple holding:
- ‘name’
-
The name of the varobj.
- ‘value’
-
If values were requested for this update, then this field will be
present and will hold the value of the varobj. - ‘in_scope’
-
This field is a string which may take one of three values:
"true"-
The variable object’s current value is valid.
"false"-
The variable object does not currently hold a valid value but it may
hold one in the future if its associated expression comes back into
scope. "invalid"-
The variable object no longer holds a valid value.
This can occur when the executable file being debugged has changed,
either through recompilation or by using the GDBfile
command. The front end should normally choose to delete these variable
objects.
In the future new values may be added to this list so the front should
be prepared for this possibility. See GDB/MI Development and Front Ends. - ‘type_changed’
-
This is only present if the varobj is still valid. If the type
changed, then this will be the string ‘true’; otherwise it will
be ‘false’.When a varobj’s type changes, its children are also likely to have
become incorrect. Therefore, the varobj’s children are automatically
deleted when this attribute is ‘true’. Also, the varobj’s update
range, when set using the-var-set-update-rangecommand, is
unset. - ‘new_type’
-
If the varobj’s type changed, then this field will be present and will
hold the new type. - ‘new_num_children’
-
For a dynamic varobj, if the number of children changed, or if the
type changed, this will be the new number of children.The ‘numchild’ field in other varobj responses is generally not
valid for a dynamic varobj – it will show the number of children that
GDB knows about, but because dynamic varobjs lazily
instantiate their children, this will not reflect the number of
children which may be available.The ‘new_num_children’ attribute only reports changes to the
number of children known by GDB. This is the only way to
detect whether an update has removed children (which necessarily can
only happen at the end of the update range). - ‘displayhint’
-
The display hint, if any.
- ‘has_more’
-
This is an integer value, which will be 1 if there are more children
available outside the varobj’s update range. - ‘dynamic’
-
This attribute will be present and have the value ‘1’ if the
varobj is a dynamic varobj. If the varobj is not a dynamic varobj,
then this attribute will not be present. - ‘new_children’
-
If new children were added to a dynamic varobj within the selected
update range (as set by-var-set-update-range), then they will
be listed in this attribute.
Example
(gdb)
-var-assign var1 3
^done,value="3"
(gdb)
-var-update --all-values var1
^done,changelist=[{name="var1",value="3",in_scope="true",
type_changed="false"}]
(gdb)
The -var-set-frozen Command
Synopsis
-var-set-frozen name flag
Set the frozenness flag on the variable object name. The
flag parameter should be either ‘1’ to make the variable
frozen or ‘0’ to make it unfrozen. If a variable object is
frozen, then neither itself, nor any of its children, are
implicitly updated by -var-update of
a parent variable or by -var-update *. Only
-var-update of the variable itself will update its value and
values of its children. After a variable object is unfrozen, it is
implicitly updated by all subsequent -var-update operations.
Unfreezing a variable does not update it, only subsequent
-var-update does.
Example
(gdb) -var-set-frozen V 1 ^done (gdb)
The -var-set-update-range command
Synopsis
-var-set-update-range name from to
Set the range of children to be returned by future invocations of
-var-update.
from and to indicate the range of children to report. If
from or to is less than zero, the range is reset and all
children will be reported. Otherwise, children starting at from
(zero-based) and up to and excluding to will be reported.
Example
(gdb) -var-set-update-range V 1 2 ^done
The -var-set-visualizer command
Synopsis
-var-set-visualizer name visualizer
Set a visualizer for the variable object name.
visualizer is the visualizer to use. The special value
‘None’ means to disable any visualizer in use.
If not ‘None’, visualizer must be a Python expression.
This expression must evaluate to a callable object which accepts a
single argument. GDB will call this object with the value of
the varobj name as an argument (this is done so that the same
Python pretty-printing code can be used for both the CLI and MI).
When called, this object must return an object which conforms to the
pretty-printing interface (see Pretty Printing API).
The pre-defined function gdb.default_visualizer may be used to
select a visualizer by following the built-in process
(see Selecting Pretty-Printers). This is done automatically when
a varobj is created, and so ordinarily is not needed.
This feature is only available if Python support is enabled. The MI
command -list-features (see GDB/MI Support Commands)
can be used to check this.
Example
Resetting the visualizer:
(gdb) -var-set-visualizer V None ^done
Reselecting the default (type-based) visualizer:
(gdb) -var-set-visualizer V gdb.default_visualizer ^done
Suppose SomeClass is a visualizer class. A lambda expression
can be used to instantiate this class for a varobj:
(gdb) -var-set-visualizer V "lambda val: SomeClass()" ^done
27.16 GDB/MI Data Manipulation
This section describes the GDB/MI commands that manipulate data:
examine memory and registers, evaluate expressions, etc.
For details about what an addressable memory unit is,
see addressable memory unit.
The -data-disassemble Command
Synopsis
-data-disassemble ( -s start-addr -e end-addr | -a addr | -f filename -l linenum [ -n lines ] ) [ --opcodes opcodes-mode ] [ --source ] [ -- mode ]
Where:
- ‘start-addr’
-
is the beginning address (or
$pc) - ‘end-addr’
-
is the end address
- ‘addr’
-
is an address anywhere within (or the name of) the function to
disassemble. If an address is specified, the whole function
surrounding that address will be disassembled. If a name is
specified, the whole function with that name will be disassembled. - ‘filename’
-
is the name of the file to disassemble
- ‘linenum’
-
is the line number to disassemble around
- ‘lines’
-
is the number of disassembly lines to be produced. If it is -1,
the whole function will be disassembled, in case no end-addr is
specified. If end-addr is specified as a non-zero value, and
lines is lower than the number of disassembly lines between
start-addr and end-addr, only lines lines are
displayed; if lines is higher than the number of lines between
start-addr and end-addr, only the lines up to end-addr
are displayed. - ‘opcodes-mode’
-
can only be used with mode 0, and should be one of the following:
- ‘none’
-
no opcode information will be included in the result.
- ‘bytes’
-
opcodes will be included in the result, the opcodes will be formatted
as for disassemble /b. - ‘display’
-
opcodes will be included in the result, the opcodes will be formatted
as for disassemble /r.
- ‘mode’
-
the use of mode is deprecated in favour of using the
--opcodesand--sourceoptions. When no mode is
given, mode 0 will be assumed. However, the mode is still
available for backward compatibility. The mode should be one of:- ‘0’
-
disassembly only, this is the default mode if no mode is
specified. - ‘1’
-
mixed source and disassembly (deprecated), it is not possible
to recreate this mode using--opcodesand--source
options. - ‘2’
-
disassembly with raw opcodes, this mode is equivalent to using
mode 0 and passing--opcodes bytesto the command. - ‘3’
-
mixed source and disassembly with raw opcodes (deprecated), it
is not possible to recreate this mode using--opcodesand
--sourceoptions. - ‘4’
-
mixed source and disassembly, this mode is equivalent to using
mode 0 and passing--sourceto the command. - ‘5’
-
mixed source and disassembly with raw opcodes, this mode is
equivalent to using mode 0 and passing--opcodes bytes
and--sourceto the command.
Modes 1 and 3 are deprecated. The output is “source centric”
which hasn’t proved useful in practice.
See Machine Code, for a discussion of the difference between
/mand/soutput of thedisassemblecommand.
The --source can only be used with mode 0. Passing this
option will include the source code in the disassembly result as if
mode 4 or 5 had been used.
Result
The result of the -data-disassemble command will be a list named
‘asm_insns’, the contents of this list depend on the options used
with the -data-disassemble command.
For modes 0 and 2, and when the --source option is not used, the
‘asm_insns’ list contains tuples with the following fields:
address-
The address at which this instruction was disassembled.
func-name-
The name of the function this instruction is within.
offset-
The decimal offset in bytes from the start of ‘func-name’.
inst-
The text disassembly for this ‘address’.
opcodes-
This field is only present for modes 2, 3 and 5, or when the
--opcodesoption ‘bytes’ or ‘display’ is used. This
contains the raw opcode bytes for the ‘inst’ field.When the ‘—opcodes’ option is not passed to
-data-disassemble, or the ‘bytes’ value is passed to
‘—opcodes’, then the bytes are formatted as a series of single
bytes, in hex, in ascending address order, with a single space between
each byte. This format is equivalent to the ‘/b’ option being
used with the disassemble command
(see disassemble).When ‘—opcodes’ is passed the value ‘display’ then the bytes
are formatted in the natural instruction display order. This means
multiple bytes can be grouped together, and the bytes might be
byte-swapped. This format is equivalent to the ‘/r’ option being
used with the disassemble command.
For modes 1, 3, 4 and 5, or when the --source option is used, the
‘asm_insns’ list contains tuples named ‘src_and_asm_line’,
each of which has the following fields:
line-
The line number within ‘file’.
file-
The file name from the compilation unit. This might be an absolute
file name or a relative file name depending on the compile command
used. fullname-
Absolute file name of ‘file’. It is converted to a canonical form
using the source file search path
(see Specifying Source Directories)
and after resolving all the symbolic links.If the source file is not found this field will contain the path as
present in the debug information. line_asm_insn-
This is a list of tuples containing the disassembly for ‘line’ in
‘file’. The fields of each tuple are the same as for
-data-disassemblein mode 0 and 2, so ‘address’,
‘func-name’, ‘offset’, ‘inst’, and optionally
‘opcodes’.
Note that whatever included in the ‘inst’ field, is not
manipulated directly by GDB/MI, i.e., it is not possible to
adjust its format.
GDB Command
The corresponding GDB command is ‘disassemble’.
Example
Disassemble from the current value of $pc to $pc + 20:
(gdb)
-data-disassemble -s $pc -e "$pc + 20" -- 0
^done,
asm_insns=[
{address="0x000107c0",func-name="main",offset="4",
inst="mov 2, %o0"},
{address="0x000107c4",func-name="main",offset="8",
inst="sethi %hi(0x11800), %o2"},
{address="0x000107c8",func-name="main",offset="12",
inst="or %o2, 0x140, %o1t! 0x11940 <_lib_version+8>"},
{address="0x000107cc",func-name="main",offset="16",
inst="sethi %hi(0x11800), %o2"},
{address="0x000107d0",func-name="main",offset="20",
inst="or %o2, 0x168, %o4t! 0x11968 <_lib_version+48>"}]
(gdb)
Disassemble the whole main function. Line 32 is part of
main.
-data-disassemble -f basics.c -l 32 -- 0
^done,asm_insns=[
{address="0x000107bc",func-name="main",offset="0",
inst="save %sp, -112, %sp"},
{address="0x000107c0",func-name="main",offset="4",
inst="mov 2, %o0"},
{address="0x000107c4",func-name="main",offset="8",
inst="sethi %hi(0x11800), %o2"},
[…]
{address="0x0001081c",func-name="main",offset="96",inst="ret "},
{address="0x00010820",func-name="main",offset="100",inst="restore "}]
(gdb)
Disassemble 3 instructions from the start of main:
(gdb)
-data-disassemble -f basics.c -l 32 -n 3 -- 0
^done,asm_insns=[
{address="0x000107bc",func-name="main",offset="0",
inst="save %sp, -112, %sp"},
{address="0x000107c0",func-name="main",offset="4",
inst="mov 2, %o0"},
{address="0x000107c4",func-name="main",offset="8",
inst="sethi %hi(0x11800), %o2"}]
(gdb)
Disassemble 3 instructions from the start of main in mixed mode:
(gdb)
-data-disassemble -f basics.c -l 32 -n 3 -- 1
^done,asm_insns=[
src_and_asm_line={line="31",
file="../../../src/gdb/testsuite/gdb.mi/basics.c",
fullname="/absolute/path/to/src/gdb/testsuite/gdb.mi/basics.c",
line_asm_insn=[{address="0x000107bc",
func-name="main",offset="0",inst="save %sp, -112, %sp"}]},
src_and_asm_line={line="32",
file="../../../src/gdb/testsuite/gdb.mi/basics.c",
fullname="/absolute/path/to/src/gdb/testsuite/gdb.mi/basics.c",
line_asm_insn=[{address="0x000107c0",
func-name="main",offset="4",inst="mov 2, %o0"},
{address="0x000107c4",func-name="main",offset="8",
inst="sethi %hi(0x11800), %o2"}]}]
(gdb)
The -data-evaluate-expression Command
Synopsis
-data-evaluate-expression expr
Evaluate expr as an expression. The expression could contain an
inferior function call. The function call will execute synchronously.
If the expression contains spaces, it must be enclosed in double quotes.
GDB Command
The corresponding GDB commands are ‘print’, ‘output’, and
‘call’. In gdbtk only, there’s a corresponding
‘gdb_eval’ command.
Example
In the following example, the numbers that precede the commands are the
tokens described in GDB/MI
Command Syntax. Notice how GDB/MI returns the same tokens in its
output.
211-data-evaluate-expression A 211^done,value="1" (gdb) 311-data-evaluate-expression &A 311^done,value="0xefffeb7c" (gdb) 411-data-evaluate-expression A+3 411^done,value="4" (gdb) 511-data-evaluate-expression "A + 3" 511^done,value="4" (gdb)
The -data-list-changed-registers Command
Synopsis
-data-list-changed-registers
Display a list of the registers that have changed.
GDB Command
GDB doesn’t have a direct analog for this command; gdbtk
has the corresponding command ‘gdb_changed_register_list’.
Example
On a PPC MBX board:
(gdb)
-exec-continue
^running
(gdb)
*stopped,reason="breakpoint-hit",disp="keep",bkptno="1",frame={
func="main",args=[],file="try.c",fullname="/home/foo/bar/try.c",
line="5",arch="powerpc"}
(gdb)
-data-list-changed-registers
^done,changed-registers=["0","1","2","4","5","6","7","8","9",
"10","11","13","14","15","16","17","18","19","20","21","22","23",
"24","25","26","27","28","30","31","64","65","66","67","69"]
(gdb)
The -data-list-register-names Command
Synopsis
-data-list-register-names [ ( regno )+ ]
Show a list of register names for the current target. If no arguments
are given, it shows a list of the names of all the registers. If
integer numbers are given as arguments, it will print a list of the
names of the registers corresponding to the arguments. To ensure
consistency between a register name and its number, the output list may
include empty register names.
GDB Command
GDB does not have a command which corresponds to
‘-data-list-register-names’. In gdbtk there is a
corresponding command ‘gdb_regnames’.
Example
For the PPC MBX board:
(gdb) -data-list-register-names ^done,register-names=["r0","r1","r2","r3","r4","r5","r6","r7", "r8","r9","r10","r11","r12","r13","r14","r15","r16","r17","r18", "r19","r20","r21","r22","r23","r24","r25","r26","r27","r28","r29", "r30","r31","f0","f1","f2","f3","f4","f5","f6","f7","f8","f9", "f10","f11","f12","f13","f14","f15","f16","f17","f18","f19","f20", "f21","f22","f23","f24","f25","f26","f27","f28","f29","f30","f31", "", "pc","ps","cr","lr","ctr","xer"] (gdb) -data-list-register-names 1 2 3 ^done,register-names=["r1","r2","r3"] (gdb)
The -data-list-register-values Command
Synopsis
-data-list-register-values
[ --skip-unavailable ] fmt [ ( regno )*]
Display the registers’ contents. The format according to which the
registers’ contents are to be returned is given by fmt, followed
by an optional list of numbers specifying the registers to display. A
missing list of numbers indicates that the contents of all the
registers must be returned. The --skip-unavailable option
indicates that only the available registers are to be returned.
Allowed formats for fmt are:
x-
Hexadecimal
o-
Octal
t-
Binary
d-
Decimal
r-
Raw
N-
Natural
GDB Command
The corresponding GDB commands are ‘info reg’, ‘info
all-reg’, and (in gdbtk) ‘gdb_fetch_registers’.
Example
For a PPC MBX board (note: line breaks are for readability only, they
don’t appear in the actual output):
(gdb)
-data-list-register-values r 64 65
^done,register-values=[{number="64",value="0xfe00a300"},
{number="65",value="0x00029002"}]
(gdb)
-data-list-register-values x
^done,register-values=[{number="0",value="0xfe0043c8"},
{number="1",value="0x3fff88"},{number="2",value="0xfffffffe"},
{number="3",value="0x0"},{number="4",value="0xa"},
{number="5",value="0x3fff68"},{number="6",value="0x3fff58"},
{number="7",value="0xfe011e98"},{number="8",value="0x2"},
{number="9",value="0xfa202820"},{number="10",value="0xfa202808"},
{number="11",value="0x1"},{number="12",value="0x0"},
{number="13",value="0x4544"},{number="14",value="0xffdfffff"},
{number="15",value="0xffffffff"},{number="16",value="0xfffffeff"},
{number="17",value="0xefffffed"},{number="18",value="0xfffffffe"},
{number="19",value="0xffffffff"},{number="20",value="0xffffffff"},
{number="21",value="0xffffffff"},{number="22",value="0xfffffff7"},
{number="23",value="0xffffffff"},{number="24",value="0xffffffff"},
{number="25",value="0xffffffff"},{number="26",value="0xfffffffb"},
{number="27",value="0xffffffff"},{number="28",value="0xf7bfffff"},
{number="29",value="0x0"},{number="30",value="0xfe010000"},
{number="31",value="0x0"},{number="32",value="0x0"},
{number="33",value="0x0"},{number="34",value="0x0"},
{number="35",value="0x0"},{number="36",value="0x0"},
{number="37",value="0x0"},{number="38",value="0x0"},
{number="39",value="0x0"},{number="40",value="0x0"},
{number="41",value="0x0"},{number="42",value="0x0"},
{number="43",value="0x0"},{number="44",value="0x0"},
{number="45",value="0x0"},{number="46",value="0x0"},
{number="47",value="0x0"},{number="48",value="0x0"},
{number="49",value="0x0"},{number="50",value="0x0"},
{number="51",value="0x0"},{number="52",value="0x0"},
{number="53",value="0x0"},{number="54",value="0x0"},
{number="55",value="0x0"},{number="56",value="0x0"},
{number="57",value="0x0"},{number="58",value="0x0"},
{number="59",value="0x0"},{number="60",value="0x0"},
{number="61",value="0x0"},{number="62",value="0x0"},
{number="63",value="0x0"},{number="64",value="0xfe00a300"},
{number="65",value="0x29002"},{number="66",value="0x202f04b5"},
{number="67",value="0xfe0043b0"},{number="68",value="0xfe00b3e4"},
{number="69",value="0x20002b03"}]
(gdb)
The -data-read-memory Command
This command is deprecated, use -data-read-memory-bytes instead.
Synopsis
-data-read-memory [ -o byte-offset ] address word-format word-size nr-rows nr-cols [ aschar ]
where:
- ‘address’
-
An expression specifying the address of the first memory word to be
read. Complex expressions containing embedded white space should be
quoted using the C convention. - ‘word-format’
-
The format to be used to print the memory words. The notation is the
same as for GDB’sprintcommand (see Output Formats). - ‘word-size’
-
The size of each memory word in bytes.
- ‘nr-rows’
-
The number of rows in the output table.
- ‘nr-cols’
-
The number of columns in the output table.
- ‘aschar’
-
If present, indicates that each row should include an ASCII dump. The
value of aschar is used as a padding character when a byte is not a
member of the printable ASCII character set (printable ASCII
characters are those whose code is between 32 and 126, inclusively). - ‘byte-offset’
-
An offset to add to the address before fetching memory.
This command displays memory contents as a table of nr-rows by
nr-cols words, each word being word-size bytes. In total,
nr-rows * nr-cols * word-size bytes are read
(returned as ‘total-bytes’). Should less than the requested number
of bytes be returned by the target, the missing words are identified
using ‘N/A’. The number of bytes read from the target is returned
in ‘nr-bytes’ and the starting address used to read memory in
‘addr’.
The address of the next/previous row or page is available in
‘next-row’ and ‘prev-row’, ‘next-page’ and
‘prev-page’.
GDB Command
The corresponding GDB command is ‘x’. gdbtk has
‘gdb_get_mem’ memory read command.
Example
Read six bytes of memory starting at bytes+6 but then offset by
-6 bytes. Format as three rows of two columns. One byte per
word. Display each word in hex.
(gdb)
9-data-read-memory -o -6 -- bytes+6 x 1 3 2
9^done,addr="0x00001390",nr-bytes="6",total-bytes="6",
next-row="0x00001396",prev-row="0x0000138e",next-page="0x00001396",
prev-page="0x0000138a",memory=[
{addr="0x00001390",data=["0x00","0x01"]},
{addr="0x00001392",data=["0x02","0x03"]},
{addr="0x00001394",data=["0x04","0x05"]}]
(gdb)
Read two bytes of memory starting at address shorts + 64 and
display as a single word formatted in decimal.
(gdb)
5-data-read-memory shorts+64 d 2 1 1
5^done,addr="0x00001510",nr-bytes="2",total-bytes="2",
next-row="0x00001512",prev-row="0x0000150e",
next-page="0x00001512",prev-page="0x0000150e",memory=[
{addr="0x00001510",data=["128"]}]
(gdb)
Read thirty two bytes of memory starting at bytes+16 and format
as eight rows of four columns. Include a string encoding with ‘x’
used as the non-printable character.
(gdb)
4-data-read-memory bytes+16 x 1 8 4 x
4^done,addr="0x000013a0",nr-bytes="32",total-bytes="32",
next-row="0x000013c0",prev-row="0x0000139c",
next-page="0x000013c0",prev-page="0x00001380",memory=[
{addr="0x000013a0",data=["0x10","0x11","0x12","0x13"],ascii="xxxx"},
{addr="0x000013a4",data=["0x14","0x15","0x16","0x17"],ascii="xxxx"},
{addr="0x000013a8",data=["0x18","0x19","0x1a","0x1b"],ascii="xxxx"},
{addr="0x000013ac",data=["0x1c","0x1d","0x1e","0x1f"],ascii="xxxx"},
{addr="0x000013b0",data=["0x20","0x21","0x22","0x23"],ascii=" !"#"},
{addr="0x000013b4",data=["0x24","0x25","0x26","0x27"],ascii="$%&'"},
{addr="0x000013b8",data=["0x28","0x29","0x2a","0x2b"],ascii="()*+"},
{addr="0x000013bc",data=["0x2c","0x2d","0x2e","0x2f"],ascii=",-./"}]
(gdb)
The -data-read-memory-bytes Command
Synopsis
-data-read-memory-bytes [ -o offset ] address count
where:
- ‘address’
-
An expression specifying the address of the first addressable memory unit
to be read. Complex expressions containing embedded white space should be
quoted using the C convention. - ‘count’
-
The number of addressable memory units to read. This should be an integer
literal. - ‘offset’
-
The offset relative to address at which to start reading. This
should be an integer literal. This option is provided so that a frontend
is not required to first evaluate address and then perform address
arithmetics itself.
This command attempts to read all accessible memory regions in the
specified range. First, all regions marked as unreadable in the memory
map (if one is defined) will be skipped. See Memory Region Attributes. Second, GDB will attempt to read the remaining
regions. For each one, if reading full region results in an errors,
GDB will try to read a subset of the region.
In general, every single memory unit in the region may be readable or not,
and the only way to read every readable unit is to try a read at
every address, which is not practical. Therefore, GDB will
attempt to read all accessible memory units at either beginning or the end
of the region, using a binary division scheme. This heuristic works
well for reading across a memory map boundary. Note that if a region
has a readable range that is neither at the beginning or the end,
GDB will not read it.
The result record (see GDB/MI Result Records) that is output of
the command includes a field named ‘memory’ whose content is a
list of tuples. Each tuple represent a successfully read memory block
and has the following fields:
begin-
The start address of the memory block, as hexadecimal literal.
end-
The end address of the memory block, as hexadecimal literal.
offset-
The offset of the memory block, as hexadecimal literal, relative to
the start address passed to-data-read-memory-bytes. contents-
The contents of the memory block, in hex.
GDB Command
The corresponding GDB command is ‘x’.
Example
(gdb)
-data-read-memory-bytes &a 10
^done,memory=[{begin="0xbffff154",offset="0x00000000",
end="0xbffff15e",
contents="01000000020000000300"}]
(gdb)
The -data-write-memory-bytes Command
Synopsis
-data-write-memory-bytes address contents -data-write-memory-bytes address contents [count]
where:
- ‘address’
-
An expression specifying the address of the first addressable memory unit
to be written. Complex expressions containing embedded white space should
be quoted using the C convention. - ‘contents’
-
The hex-encoded data to write. It is an error if contents does
not represent an integral number of addressable memory units. - ‘count’
-
Optional argument indicating the number of addressable memory units to be
written. If count is greater than contents’ length,
GDB will repeatedly write contents until it fills
count memory units.
GDB Command
There’s no corresponding GDB command.
Example
(gdb) -data-write-memory-bytes &a "aabbccdd" ^done (gdb)
(gdb) -data-write-memory-bytes &a "aabbccdd" 16e ^done (gdb)
27.17 GDB/MI Tracepoint Commands
The commands defined in this section implement MI support for
tracepoints. For detailed introduction, see Tracepoints.
The -trace-find Command
Synopsis
-trace-find mode [parameters…]
Find a trace frame using criteria defined by mode and
parameters. The following table lists permissible
modes and their parameters. For details of operation, see tfind.
- ‘none’
-
No parameters are required. Stops examining trace frames.
- ‘frame-number’
-
An integer is required as parameter. Selects tracepoint frame with
that index. - ‘tracepoint-number’
-
An integer is required as parameter. Finds next
trace frame that corresponds to tracepoint with the specified number. - ‘pc’
-
An address is required as parameter. Finds
next trace frame that corresponds to any tracepoint at the specified
address. - ‘pc-inside-range’
-
Two addresses are required as parameters. Finds next trace
frame that corresponds to a tracepoint at an address inside the
specified range. Both bounds are considered to be inside the range. - ‘pc-outside-range’
-
Two addresses are required as parameters. Finds
next trace frame that corresponds to a tracepoint at an address outside
the specified range. Both bounds are considered to be inside the range. - ‘line’
-
Location specification is required as parameter. See Location Specifications.
Finds next trace frame that corresponds to a tracepoint at
the specified location.
If ‘none’ was passed as mode, the response does not
have fields. Otherwise, the response may have the following fields:
- ‘found’
-
This field has either ‘0’ or ‘1’ as the value, depending
on whether a matching tracepoint was found. - ‘traceframe’
-
The index of the found traceframe. This field is present iff
the ‘found’ field has value of ‘1’. - ‘tracepoint’
-
The index of the found tracepoint. This field is present iff
the ‘found’ field has value of ‘1’. - ‘frame’
-
The information about the frame corresponding to the found trace
frame. This field is present only if a trace frame was found.
See GDB/MI Frame Information, for description of this field.
GDB Command
The corresponding GDB command is ‘tfind’.
-trace-define-variable
Synopsis
-trace-define-variable name [ value ]
Create trace variable name if it does not exist. If
value is specified, sets the initial value of the specified
trace variable to that value. Note that the name should start
with the ‘$’ character.
GDB Command
The corresponding GDB command is ‘tvariable’.
The -trace-frame-collected Command
Synopsis
-trace-frame-collected
[--var-print-values var_pval]
[--comp-print-values comp_pval]
[--registers-format regformat]
[--memory-contents]
This command returns the set of collected objects, register names,
trace state variable names, memory ranges and computed expressions
that have been collected at a particular trace frame. The optional
parameters to the command affect the output format in different ways.
See the output description table below for more details.
The reported names can be used in the normal manner to create
varobjs and inspect the objects themselves. The items returned by
this command are categorized so that it is clear which is a variable,
which is a register, which is a trace state variable, which is a
memory range and which is a computed expression.
For instance, if the actions were
collect myVar, myArray[myIndex], myObj.field, myPtr->field, myCount + 2 collect *(int*)0xaf02bef0@40
the object collected in its entirety would be myVar. The
object myArray would be partially collected, because only the
element at index myIndex would be collected. The remaining
objects would be computed expressions.
An example output would be:
(gdb)
-trace-frame-collected
^done,
explicit-variables=[{name="myVar",value="1"}],
computed-expressions=[{name="myArray[myIndex]",value="0"},
{name="myObj.field",value="0"},
{name="myPtr->field",value="1"},
{name="myCount + 2",value="3"},
{name="$tvar1 + 1",value="43970027"}],
registers=[{number="0",value="0x7fe2c6e79ec8"},
{number="1",value="0x0"},
{number="2",value="0x4"},
...
{number="125",value="0x0"}],
tvars=[{name="$tvar1",current="43970026"}],
memory=[{address="0x0000000000602264",length="4"},
{address="0x0000000000615bc0",length="4"}]
(gdb)
Where:
explicit-variables-
The set of objects that have been collected in their entirety (as
opposed to collecting just a few elements of an array or a few struct
members). For each object, its name and value are printed.
The--var-print-valuesoption affects how or whether the value
field is output. If var_pval is 0, then print only the names;
if it is 1, print also their values; and if it is 2, print the name,
type and value for simple data types, and the name and type for
arrays, structures and unions. computed-expressions-
The set of computed expressions that have been collected at the
current trace frame. The--comp-print-valuesoption affects
this set like the--var-print-valuesoption affects the
explicit-variablesset. See above. registers-
The registers that have been collected at the current trace frame.
For each register collected, the name and current value are returned.
The value is formatted according to the--registers-format
option. See the-data-list-register-valuescommand for a
list of the allowed formats. The default is ‘x’. tvars-
The trace state variables that have been collected at the current
trace frame. For each trace state variable collected, the name and
current value are returned. memory-
The set of memory ranges that have been collected at the current trace
frame. Its content is a list of tuples. Each tuple represents a
collected memory range and has the following fields:address-
The start address of the memory range, as hexadecimal literal.
length-
The length of the memory range, as decimal literal.
contents-
The contents of the memory block, in hex. This field is only present
if the--memory-contentsoption is specified.
GDB Command
There is no corresponding GDB command.
Example
-trace-list-variables
Synopsis
Return a table of all defined trace variables. Each element of the
table has the following fields:
- ‘name’
-
The name of the trace variable. This field is always present.
- ‘initial’
-
The initial value. This is a 64-bit signed integer. This
field is always present. - ‘current’
-
The value the trace variable has at the moment. This is a 64-bit
signed integer. This field is absent iff current value is
not defined, for example if the trace was never run, or is
presently running.
GDB Command
The corresponding GDB command is ‘tvariables’.
Example
(gdb)
-trace-list-variables
^done,trace-variables={nr_rows="1",nr_cols="3",
hdr=[{width="15",alignment="-1",col_name="name",colhdr="Name"},
{width="11",alignment="-1",col_name="initial",colhdr="Initial"},
{width="11",alignment="-1",col_name="current",colhdr="Current"}],
body=[variable={name="$trace_timestamp",initial="0"}
variable={name="$foo",initial="10",current="15"}]}
(gdb)
-trace-save
Synopsis
-trace-save [ -r ] [ -ctf ] filename
Saves the collected trace data to filename. Without the
‘-r’ option, the data is downloaded from the target and saved
in a local file. With the ‘-r’ option the target is asked
to perform the save.
By default, this command will save the trace in the tfile format. You can
supply the optional ‘-ctf’ argument to save it the CTF format. See
Trace Files for more information about CTF.
GDB Command
The corresponding GDB command is ‘tsave’.
-trace-start
Synopsis
Starts a tracing experiment. The result of this command does not
have any fields.
GDB Command
The corresponding GDB command is ‘tstart’.
-trace-status
Synopsis
Obtains the status of a tracing experiment. The result may include
the following fields:
- ‘supported’
-
May have a value of either ‘0’, when no tracing operations are
supported, ‘1’, when all tracing operations are supported, or
‘file’ when examining trace file. In the latter case, examining
of trace frame is possible but new tracing experiement cannot be
started. This field is always present. - ‘running’
-
May have a value of either ‘0’ or ‘1’ depending on whether
tracing experiement is in progress on target. This field is present
if ‘supported’ field is not ‘0’. - ‘stop-reason’
-
Report the reason why the tracing was stopped last time. This field
may be absent iff tracing was never stopped on target yet. The
value of ‘request’ means the tracing was stopped as result of
the-trace-stopcommand. The value of ‘overflow’ means
the tracing buffer is full. The value of ‘disconnection’ means
tracing was automatically stopped when GDB has disconnected.
The value of ‘passcount’ means tracing was stopped when a
tracepoint was passed a maximal number of times for that tracepoint.
This field is present if ‘supported’ field is not ‘0’. - ‘stopping-tracepoint’
-
The number of tracepoint whose passcount as exceeded. This field is
present iff the ‘stop-reason’ field has the value of
‘passcount’. - ‘frames’
- ‘frames-created’
-
The ‘frames’ field is a count of the total number of trace frames
in the trace buffer, while ‘frames-created’ is the total created
during the run, including ones that were discarded, such as when a
circular trace buffer filled up. Both fields are optional. - ‘buffer-size’
- ‘buffer-free’
-
These fields tell the current size of the tracing buffer and the
remaining space. These fields are optional. - ‘circular’
-
The value of the circular trace buffer flag.
1means that the
trace buffer is circular and old trace frames will be discarded if
necessary to make room,0means that the trace buffer is linear
and may fill up. - ‘disconnected’
-
The value of the disconnected tracing flag.
1means that
tracing will continue after GDB disconnects,0means
that the trace run will stop. - ‘trace-file’
-
The filename of the trace file being examined. This field is
optional, and only present when examining a trace file.
GDB Command
The corresponding GDB command is ‘tstatus’.
-trace-stop
Synopsis
Stops a tracing experiment. The result of this command has the same
fields as -trace-status, except that the ‘supported’ and
‘running’ fields are not output.
GDB Command
The corresponding GDB command is ‘tstop’.
27.18 GDB/MI Symbol Query Commands
The -symbol-info-functions Command
Synopsis
-symbol-info-functions [--include-nondebug]
[--type type_regexp]
[--name name_regexp]
[--max-results limit]
Return a list containing the names and types for all global functions
taken from the debug information. The functions are grouped by source
file, and shown with the line number on which each function is
defined.
The --include-nondebug option causes the output to include
code symbols from the symbol table.
The options --type and --name allow the symbols returned
to be filtered based on either the name of the function, or the type
signature of the function.
The option --max-results restricts the command to return no
more than limit results. If exactly limit results are
returned then there might be additional results available if a higher
limit is used.
GDB Command
The corresponding GDB command is ‘info functions’.
Example
(gdb)
-symbol-info-functions
^done,symbols=
{debug=
[{filename="/project/gdb/testsuite/gdb.mi/mi-sym-info-1.c",
fullname="/project/gdb/testsuite/gdb.mi/mi-sym-info-1.c",
symbols=[{line="36", name="f4", type="void (int *)",
description="void f4(int *);"},
{line="42", name="main", type="int ()",
description="int main();"},
{line="30", name="f1", type="my_int_t (int, int)",
description="static my_int_t f1(int, int);"}]},
{filename="/project/gdb/testsuite/gdb.mi/mi-sym-info-2.c",
fullname="/project/gdb/testsuite/gdb.mi/mi-sym-info-2.c",
symbols=[{line="33", name="f2", type="float (another_float_t)",
description="float f2(another_float_t);"},
{line="39", name="f3", type="int (another_int_t)",
description="int f3(another_int_t);"},
{line="27", name="f1", type="another_float_t (int)",
description="static another_float_t f1(int);"}]}]}
(gdb)
-symbol-info-functions --name f1
^done,symbols=
{debug=
[{filename="/project/gdb/testsuite/gdb.mi/mi-sym-info-1.c",
fullname="/project/gdb/testsuite/gdb.mi/mi-sym-info-1.c",
symbols=[{line="30", name="f1", type="my_int_t (int, int)",
description="static my_int_t f1(int, int);"}]},
{filename="/project/gdb/testsuite/gdb.mi/mi-sym-info-2.c",
fullname="/project/gdb/testsuite/gdb.mi/mi-sym-info-2.c",
symbols=[{line="27", name="f1", type="another_float_t (int)",
description="static another_float_t f1(int);"}]}]}
(gdb)
-symbol-info-functions --type void
^done,symbols=
{debug=
[{filename="/project/gdb/testsuite/gdb.mi/mi-sym-info-1.c",
fullname="/project/gdb/testsuite/gdb.mi/mi-sym-info-1.c",
symbols=[{line="36", name="f4", type="void (int *)",
description="void f4(int *);"}]}]}
(gdb)
-symbol-info-functions --include-nondebug
^done,symbols=
{debug=
[{filename="/project/gdb/testsuite/gdb.mi/mi-sym-info-1.c",
fullname="/project/gdb/testsuite/gdb.mi/mi-sym-info-1.c",
symbols=[{line="36", name="f4", type="void (int *)",
description="void f4(int *);"},
{line="42", name="main", type="int ()",
description="int main();"},
{line="30", name="f1", type="my_int_t (int, int)",
description="static my_int_t f1(int, int);"}]},
{filename="/project/gdb/testsuite/gdb.mi/mi-sym-info-2.c",
fullname="/project/gdb/testsuite/gdb.mi/mi-sym-info-2.c",
symbols=[{line="33", name="f2", type="float (another_float_t)",
description="float f2(another_float_t);"},
{line="39", name="f3", type="int (another_int_t)",
description="int f3(another_int_t);"},
{line="27", name="f1", type="another_float_t (int)",
description="static another_float_t f1(int);"}]}],
nondebug=
[{address="0x0000000000400398",name="_init"},
{address="0x00000000004003b0",name="_start"},
...
]}
The -symbol-info-module-functions Command
Synopsis
-symbol-info-module-functions [--module module_regexp]
[--name name_regexp]
[--type type_regexp]
Return a list containing the names of all known functions within all
know Fortran modules. The functions are grouped by source file and
containing module, and shown with the line number on which each
function is defined.
The option --module only returns results for modules matching
module_regexp. The option --name only returns functions
whose name matches name_regexp, and --type only returns
functions whose type matches type_regexp.
GDB Command
The corresponding GDB command is ‘info module functions’.
Example
(gdb)
-symbol-info-module-functions
^done,symbols=
[{module="mod1",
files=[{filename="/project/gdb/testsuite/gdb.mi/mi-fortran-modules-2.f90",
fullname="/project/gdb/testsuite/gdb.mi/mi-fortran-modules-2.f90",
symbols=[{line="21",name="mod1::check_all",type="void (void)",
description="void mod1::check_all(void);"}]}]},
{module="mod2",
files=[{filename="/project/gdb/testsuite/gdb.mi/mi-fortran-modules-2.f90",
fullname="/project/gdb/testsuite/gdb.mi/mi-fortran-modules-2.f90",
symbols=[{line="30",name="mod2::check_var_i",type="void (void)",
description="void mod2::check_var_i(void);"}]}]},
{module="mod3",
files=[{filename="/projec/gdb/testsuite/gdb.mi/mi-fortran-modules.f90",
fullname="/projec/gdb/testsuite/gdb.mi/mi-fortran-modules.f90",
symbols=[{line="21",name="mod3::check_all",type="void (void)",
description="void mod3::check_all(void);"},
{line="27",name="mod3::check_mod2",type="void (void)",
description="void mod3::check_mod2(void);"}]}]},
{module="modmany",
files=[{filename="/project/gdb/testsuite/gdb.mi/mi-fortran-modules.f90",
fullname="/project/gdb/testsuite/gdb.mi/mi-fortran-modules.f90",
symbols=[{line="35",name="modmany::check_some",type="void (void)",
description="void modmany::check_some(void);"}]}]},
{module="moduse",
files=[{filename="/project/gdb/testsuite/gdb.mi/mi-fortran-modules.f90",
fullname="/project/gdb/testsuite/gdb.mi/mi-fortran-modules.f90",
symbols=[{line="44",name="moduse::check_all",type="void (void)",
description="void moduse::check_all(void);"},
{line="49",name="moduse::check_var_x",type="void (void)",
description="void moduse::check_var_x(void);"}]}]}]
The -symbol-info-module-variables Command
Synopsis
-symbol-info-module-variables [--module module_regexp]
[--name name_regexp]
[--type type_regexp]
Return a list containing the names of all known variables within all
know Fortran modules. The variables are grouped by source file and
containing module, and shown with the line number on which each
variable is defined.
The option --module only returns results for modules matching
module_regexp. The option --name only returns variables
whose name matches name_regexp, and --type only returns
variables whose type matches type_regexp.
GDB Command
The corresponding GDB command is ‘info module variables’.
Example
(gdb)
-symbol-info-module-variables
^done,symbols=
[{module="mod1",
files=[{filename="/project/gdb/testsuite/gdb.mi/mi-fortran-modules-2.f90",
fullname="/project/gdb/testsuite/gdb.mi/mi-fortran-modules-2.f90",
symbols=[{line="18",name="mod1::var_const",type="integer(kind=4)",
description="integer(kind=4) mod1::var_const;"},
{line="17",name="mod1::var_i",type="integer(kind=4)",
description="integer(kind=4) mod1::var_i;"}]}]},
{module="mod2",
files=[{filename="/project/gdb/testsuite/gdb.mi/mi-fortran-modules-2.f90",
fullname="/project/gdb/testsuite/gdb.mi/mi-fortran-modules-2.f90",
symbols=[{line="28",name="mod2::var_i",type="integer(kind=4)",
description="integer(kind=4) mod2::var_i;"}]}]},
{module="mod3",
files=[{filename="/project/gdb/testsuite/gdb.mi/mi-fortran-modules.f90",
fullname="/project/gdb/testsuite/gdb.mi/mi-fortran-modules.f90",
symbols=[{line="18",name="mod3::mod1",type="integer(kind=4)",
description="integer(kind=4) mod3::mod1;"},
{line="17",name="mod3::mod2",type="integer(kind=4)",
description="integer(kind=4) mod3::mod2;"},
{line="19",name="mod3::var_i",type="integer(kind=4)",
description="integer(kind=4) mod3::var_i;"}]}]},
{module="modmany",
files=[{filename="/project/gdb/testsuite/gdb.mi/mi-fortran-modules.f90",
fullname="/project/gdb/testsuite/gdb.mi/mi-fortran-modules.f90",
symbols=[{line="33",name="modmany::var_a",type="integer(kind=4)",
description="integer(kind=4) modmany::var_a;"},
{line="33",name="modmany::var_b",type="integer(kind=4)",
description="integer(kind=4) modmany::var_b;"},
{line="33",name="modmany::var_c",type="integer(kind=4)",
description="integer(kind=4) modmany::var_c;"},
{line="33",name="modmany::var_i",type="integer(kind=4)",
description="integer(kind=4) modmany::var_i;"}]}]},
{module="moduse",
files=[{filename="/project/gdb/testsuite/gdb.mi/mi-fortran-modules.f90",
fullname="/project/gdb/testsuite/gdb.mi/mi-fortran-modules.f90",
symbols=[{line="42",name="moduse::var_x",type="integer(kind=4)",
description="integer(kind=4) moduse::var_x;"},
{line="42",name="moduse::var_y",type="integer(kind=4)",
description="integer(kind=4) moduse::var_y;"}]}]}]
The -symbol-info-modules Command
Synopsis
-symbol-info-modules [--name name_regexp]
[--max-results limit]
Return a list containing the names of all known Fortran modules. The
modules are grouped by source file, and shown with the line number on
which each modules is defined.
The option --name allows the modules returned to be filtered
based the name of the module.
The option --max-results restricts the command to return no
more than limit results. If exactly limit results are
returned then there might be additional results available if a higher
limit is used.
GDB Command
The corresponding GDB command is ‘info modules’.
Example
(gdb)
-symbol-info-modules
^done,symbols=
{debug=
[{filename="/project/gdb/testsuite/gdb.mi/mi-fortran-modules-2.f90",
fullname="/project/gdb/testsuite/gdb.mi/mi-fortran-modules-2.f90",
symbols=[{line="16",name="mod1"},
{line="22",name="mod2"}]},
{filename="/project/gdb/testsuite/gdb.mi/mi-fortran-modules.f90",
fullname="/project/gdb/testsuite/gdb.mi/mi-fortran-modules.f90",
symbols=[{line="16",name="mod3"},
{line="22",name="modmany"},
{line="26",name="moduse"}]}]}
(gdb)
-symbol-info-modules --name mod[123]
^done,symbols=
{debug=
[{filename="/project/gdb/testsuite/gdb.mi/mi-fortran-modules-2.f90",
fullname="/project/gdb/testsuite/gdb.mi/mi-fortran-modules-2.f90",
symbols=[{line="16",name="mod1"},
{line="22",name="mod2"}]},
{filename="/project/gdb/testsuite/gdb.mi/mi-fortran-modules.f90",
fullname="/project/gdb/testsuite/gdb.mi/mi-fortran-modules.f90",
symbols=[{line="16",name="mod3"}]}]}
The -symbol-info-types Command
Synopsis
-symbol-info-types [--name name_regexp]
[--max-results limit]
Return a list of all defined types. The types are grouped by source
file, and shown with the line number on which each user defined type
is defined. Some base types are not defined in the source code but
are added to the debug information by the compiler, for example
int, float, etc.; these types do not have an associated
line number.
The option --name allows the list of types returned to be
filtered by name.
The option --max-results restricts the command to return no
more than limit results. If exactly limit results are
returned then there might be additional results available if a higher
limit is used.
GDB Command
The corresponding GDB command is ‘info types’.
Example
(gdb)
-symbol-info-types
^done,symbols=
{debug=
[{filename="gdb.mi/mi-sym-info-1.c",
fullname="/project/gdb/testsuite/gdb.mi/mi-sym-info-1.c",
symbols=[{name="float"},
{name="int"},
{line="27",name="typedef int my_int_t;"}]},
{filename="gdb.mi/mi-sym-info-2.c",
fullname="/project/gdb.mi/mi-sym-info-2.c",
symbols=[{line="24",name="typedef float another_float_t;"},
{line="23",name="typedef int another_int_t;"},
{name="float"},
{name="int"}]}]}
(gdb)
-symbol-info-types --name _int_
^done,symbols=
{debug=
[{filename="gdb.mi/mi-sym-info-1.c",
fullname="/project/gdb/testsuite/gdb.mi/mi-sym-info-1.c",
symbols=[{line="27",name="typedef int my_int_t;"}]},
{filename="gdb.mi/mi-sym-info-2.c",
fullname="/project/gdb.mi/mi-sym-info-2.c",
symbols=[{line="23",name="typedef int another_int_t;"}]}]}
The -symbol-info-variables Command
Synopsis
-symbol-info-variables [--include-nondebug]
[--type type_regexp]
[--name name_regexp]
[--max-results limit]
Return a list containing the names and types for all global variables
taken from the debug information. The variables are grouped by source
file, and shown with the line number on which each variable is
defined.
The --include-nondebug option causes the output to include
data symbols from the symbol table.
The options --type and --name allow the symbols returned
to be filtered based on either the name of the variable, or the type
of the variable.
The option --max-results restricts the command to return no
more than limit results. If exactly limit results are
returned then there might be additional results available if a higher
limit is used.
GDB Command
The corresponding GDB command is ‘info variables’.
Example
(gdb)
-symbol-info-variables
^done,symbols=
{debug=
[{filename="/project/gdb/testsuite/gdb.mi/mi-sym-info-1.c",
fullname="/project/gdb/testsuite/gdb.mi/mi-sym-info-1.c",
symbols=[{line="25",name="global_f1",type="float",
description="static float global_f1;"},
{line="24",name="global_i1",type="int",
description="static int global_i1;"}]},
{filename="/project/gdb/testsuite/gdb.mi/mi-sym-info-2.c",
fullname="/project/gdb/testsuite/gdb.mi/mi-sym-info-2.c",
symbols=[{line="21",name="global_f2",type="int",
description="int global_f2;"},
{line="20",name="global_i2",type="int",
description="int global_i2;"},
{line="19",name="global_f1",type="float",
description="static float global_f1;"},
{line="18",name="global_i1",type="int",
description="static int global_i1;"}]}]}
(gdb)
-symbol-info-variables --name f1
^done,symbols=
{debug=
[{filename="/project/gdb/testsuite/gdb.mi/mi-sym-info-1.c",
fullname="/project/gdb/testsuite/gdb.mi/mi-sym-info-1.c",
symbols=[{line="25",name="global_f1",type="float",
description="static float global_f1;"}]},
{filename="/project/gdb/testsuite/gdb.mi/mi-sym-info-2.c",
fullname="/project/gdb/testsuite/gdb.mi/mi-sym-info-2.c",
symbols=[{line="19",name="global_f1",type="float",
description="static float global_f1;"}]}]}
(gdb)
-symbol-info-variables --type float
^done,symbols=
{debug=
[{filename="/project/gdb/testsuite/gdb.mi/mi-sym-info-1.c",
fullname="/project/gdb/testsuite/gdb.mi/mi-sym-info-1.c",
symbols=[{line="25",name="global_f1",type="float",
description="static float global_f1;"}]},
{filename="/project/gdb/testsuite/gdb.mi/mi-sym-info-2.c",
fullname="/project/gdb/testsuite/gdb.mi/mi-sym-info-2.c",
symbols=[{line="19",name="global_f1",type="float",
description="static float global_f1;"}]}]}
(gdb)
-symbol-info-variables --include-nondebug
^done,symbols=
{debug=
[{filename="/project/gdb/testsuite/gdb.mi/mi-sym-info-1.c",
fullname="/project/gdb/testsuite/gdb.mi/mi-sym-info-1.c",
symbols=[{line="25",name="global_f1",type="float",
description="static float global_f1;"},
{line="24",name="global_i1",type="int",
description="static int global_i1;"}]},
{filename="/project/gdb/testsuite/gdb.mi/mi-sym-info-2.c",
fullname="/project/gdb/testsuite/gdb.mi/mi-sym-info-2.c",
symbols=[{line="21",name="global_f2",type="int",
description="int global_f2;"},
{line="20",name="global_i2",type="int",
description="int global_i2;"},
{line="19",name="global_f1",type="float",
description="static float global_f1;"},
{line="18",name="global_i1",type="int",
description="static int global_i1;"}]}],
nondebug=
[{address="0x00000000004005d0",name="_IO_stdin_used"},
{address="0x00000000004005d8",name="__dso_handle"}
...
]}
The -symbol-list-lines Command
Synopsis
-symbol-list-lines filename
Print the list of lines that contain code and their associated program
addresses for the given source filename. The entries are sorted in
ascending PC order.
GDB Command
There is no corresponding GDB command.
Example
(gdb)
-symbol-list-lines basics.c
^done,lines=[{pc="0x08048554",line="7"},{pc="0x0804855a",line="8"}]
(gdb)
27.19 GDB/MI File Commands
This section describes the GDB/MI commands to specify executable file names
and to read in and obtain symbol table information.
The -file-exec-and-symbols Command
Synopsis
-file-exec-and-symbols file
Specify the executable file to be debugged. This file is the one from
which the symbol table is also read. If no file is specified, the
command clears the executable and symbol information. If breakpoints
are set when using this command with no arguments, GDB will produce
error messages. Otherwise, no output is produced, except a completion
notification.
GDB Command
The corresponding GDB command is ‘file’.
Example
(gdb) -file-exec-and-symbols /kwikemart/marge/ezannoni/TRUNK/mbx/hello.mbx ^done (gdb)
The -file-exec-file Command
Synopsis
Specify the executable file to be debugged. Unlike
‘-file-exec-and-symbols’, the symbol table is not read
from this file. If used without argument, GDB clears the information
about the executable file. No output is produced, except a completion
notification.
GDB Command
The corresponding GDB command is ‘exec-file’.
Example
(gdb) -file-exec-file /kwikemart/marge/ezannoni/TRUNK/mbx/hello.mbx ^done (gdb)
The -file-list-exec-source-file Command
Synopsis
-file-list-exec-source-file
List the line number, the current source file, and the absolute path
to the current source file for the current executable. The macro
information field has a value of ‘1’ or ‘0’ depending on
whether or not the file includes preprocessor macro information.
GDB Command
The GDB equivalent is ‘info source’
Example
(gdb) 123-file-list-exec-source-file 123^done,line="1",file="foo.c",fullname="/home/bar/foo.c,macro-info="1" (gdb)
The -file-list-exec-source-files Command
Synopsis
-file-list-exec-source-files [ --group-by-objfile ] [ --dirname | --basename ] [ -- ] [ regexp ]
This command returns information about the source files GDB
knows about, it will output both the filename and fullname (absolute
file name) of a source file, though the fullname can be elided if this
information is not known to GDB.
With no arguments this command returns a list of source files. Each
source file is represented by a tuple with the fields; file,
fullname, and debug-fully-read. The file is the
display name for the file, while fullname is the absolute name
of the file. The fullname field can be elided if the absolute
name of the source file can’t be computed. The field
debug-fully-read will be a string, either true or
false. When true, this indicates the full debug
information for the compilation unit describing this file has been
read in. When false, the full debug information has not yet
been read in. While reading in the full debug information it is
possible that GDB could become aware of additional source
files.
The optional regexp can be used to filter the list of source
files returned. The regexp will be matched against the full
source file name. The matching is case-sensitive, except on operating
systems that have case-insensitive filesystem (e.g.,
MS-Windows). ‘—’ can be used before regexp to prevent
GDB interpreting regexp as a command option (e.g. if
regexp starts with ‘—’).
If --dirname is provided, then regexp is matched only
against the directory name of each source file. If --basename
is provided, then regexp is matched against the basename of each
source file. Only one of --dirname or --basename may be
given, and if either is given then regexp is required.
If --group-by-objfile is used then the format of the results is
changed. The results will now be a list of tuples, with each tuple
representing an object file (executable or shared library) loaded into
GDB. The fields of these tuples are; filename,
debug-info, and sources. The filename is the
absolute name of the object file, debug-info is a string with
one of the following values:
none-
This object file has no debug information.
partially-read-
This object file has debug information, but it is not fully read in
yet. When it is read in later, GDB might become aware of additional
source files. fully-read-
This object file has debug information, and this information is fully
read into GDB. The list of source files is complete.
The sources is a list or tuples, with each tuple describing a
single source file with the same fields as described previously. The
sources list can be empty for object files that have no debug
information.
GDB Command
The GDB equivalent is ‘info sources’.
gdbtk has an analogous command ‘gdb_listfiles’.
Example
(gdb)
-file-list-exec-source-files
^done,files=[{file="foo.c",fullname="/home/foo.c",debug-fully-read="true"},
{file="/home/bar.c",fullname="/home/bar.c",debug-fully-read="true"},
{file="gdb_could_not_find_fullpath.c",debug-fully-read="true"}]
(gdb)
-file-list-exec-source-files
^done,files=[{file="test.c",
fullname="/tmp/info-sources/test.c",
debug-fully-read="true"},
{file="/usr/include/stdc-predef.h",
fullname="/usr/include/stdc-predef.h",
debug-fully-read="true"},
{file="header.h",
fullname="/tmp/info-sources/header.h",
debug-fully-read="true"},
{file="helper.c",
fullname="/tmp/info-sources/helper.c",
debug-fully-read="true"}]
(gdb)
-file-list-exec-source-files -- \.c
^done,files=[{file="test.c",
fullname="/tmp/info-sources/test.c",
debug-fully-read="true"},
{file="helper.c",
fullname="/tmp/info-sources/helper.c",
debug-fully-read="true"}]
(gdb)
-file-list-exec-source-files --group-by-objfile
^done,files=[{filename="/tmp/info-sources/test.x",
debug-info="fully-read",
sources=[{file="test.c",
fullname="/tmp/info-sources/test.c",
debug-fully-read="true"},
{file="/usr/include/stdc-predef.h",
fullname="/usr/include/stdc-predef.h",
debug-fully-read="true"},
{file="header.h",
fullname="/tmp/info-sources/header.h",
debug-fully-read="true"}]},
{filename="/lib64/ld-linux-x86-64.so.2",
debug-info="none",
sources=[]},
{filename="system-supplied DSO at 0x7ffff7fcf000",
debug-info="none",
sources=[]},
{filename="/tmp/info-sources/libhelper.so",
debug-info="fully-read",
sources=[{file="helper.c",
fullname="/tmp/info-sources/helper.c",
debug-fully-read="true"},
{file="/usr/include/stdc-predef.h",
fullname="/usr/include/stdc-predef.h",
debug-fully-read="true"},
{file="header.h",
fullname="/tmp/info-sources/header.h",
debug-fully-read="true"}]},
{filename="/lib64/libc.so.6",
debug-info="none",
sources=[]}]
The -file-list-shared-libraries Command
Synopsis
-file-list-shared-libraries [ regexp ]
List the shared libraries in the program.
With a regular expression regexp, only those libraries whose
names match regexp are listed.
GDB Command
The corresponding GDB command is ‘info shared’. The fields
have a similar meaning to the =library-loaded notification.
The ranges field specifies the multiple segments belonging to this
library. Each range has the following fields:
- ‘from’
-
The address defining the inclusive lower bound of the segment.
- ‘to’
-
The address defining the exclusive upper bound of the segment.
Example
(gdb)
-file-list-exec-source-files
^done,shared-libraries=[
{id="/lib/libfoo.so",target-name="/lib/libfoo.so",host-name="/lib/libfoo.so",symbols-loaded="1",thread-group="i1",ranges=[{from="0x72815989",to="0x728162c0"}]},
{id="/lib/libbar.so",target-name="/lib/libbar.so",host-name="/lib/libbar.so",symbols-loaded="1",thread-group="i1",ranges=[{from="0x76ee48c0",to="0x76ee9160"}]}]
(gdb)
The -file-symbol-file Command
Synopsis
Read symbol table info from the specified file argument. When
used without arguments, clears GDB’s symbol table info. No output is
produced, except for a completion notification.
GDB Command
The corresponding GDB command is ‘symbol-file’.
Example
(gdb) -file-symbol-file /kwikemart/marge/ezannoni/TRUNK/mbx/hello.mbx ^done (gdb)
27.20 GDB/MI Target Manipulation Commands
The -target-attach Command
Synopsis
-target-attach pid | gid | file
Attach to a process pid or a file file outside of
GDB, or a thread group gid. If attaching to a thread
group, the id previously returned by
‘-list-thread-groups —available’ must be used.
GDB Command
The corresponding GDB command is ‘attach’.
Example
(gdb)
-target-attach 34
=thread-created,id="1"
*stopped,thread-id="1",frame={addr="0xb7f7e410",func="bar",args=[]}
^done
(gdb)
The -target-detach Command
Synopsis
-target-detach [ pid | gid ]
Detach from the remote target which normally resumes its execution.
If either pid or gid is specified, detaches from either
the specified process, or specified thread group. There’s no output.
GDB Command
The corresponding GDB command is ‘detach’.
Example
(gdb) -target-detach ^done (gdb)
The -target-disconnect Command
Synopsis
Disconnect from the remote target. There’s no output and the target is
generally not resumed.
GDB Command
The corresponding GDB command is ‘disconnect’.
Example
(gdb) -target-disconnect ^done (gdb)
The -target-download Command
Synopsis
Loads the executable onto the remote target.
It prints out an update message every half second, which includes the fields:
- ‘section’
-
The name of the section.
- ‘section-sent’
-
The size of what has been sent so far for that section.
- ‘section-size’
-
The size of the section.
- ‘total-sent’
-
The total size of what was sent so far (the current and the previous sections).
- ‘total-size’
-
The size of the overall executable to download.
Each message is sent as status record (see GDB/MI Output Syntax).
In addition, it prints the name and size of the sections, as they are
downloaded. These messages include the following fields:
- ‘section’
-
The name of the section.
- ‘section-size’
-
The size of the section.
- ‘total-size’
-
The size of the overall executable to download.
At the end, a summary is printed.
GDB Command
The corresponding GDB command is ‘load’.
Example
Note: each status message appears on a single line. Here the messages
have been broken down so that they can fit onto a page.
(gdb)
-target-download
+download,{section=".text",section-size="6668",total-size="9880"}
+download,{section=".text",section-sent="512",section-size="6668",
total-sent="512",total-size="9880"}
+download,{section=".text",section-sent="1024",section-size="6668",
total-sent="1024",total-size="9880"}
+download,{section=".text",section-sent="1536",section-size="6668",
total-sent="1536",total-size="9880"}
+download,{section=".text",section-sent="2048",section-size="6668",
total-sent="2048",total-size="9880"}
+download,{section=".text",section-sent="2560",section-size="6668",
total-sent="2560",total-size="9880"}
+download,{section=".text",section-sent="3072",section-size="6668",
total-sent="3072",total-size="9880"}
+download,{section=".text",section-sent="3584",section-size="6668",
total-sent="3584",total-size="9880"}
+download,{section=".text",section-sent="4096",section-size="6668",
total-sent="4096",total-size="9880"}
+download,{section=".text",section-sent="4608",section-size="6668",
total-sent="4608",total-size="9880"}
+download,{section=".text",section-sent="5120",section-size="6668",
total-sent="5120",total-size="9880"}
+download,{section=".text",section-sent="5632",section-size="6668",
total-sent="5632",total-size="9880"}
+download,{section=".text",section-sent="6144",section-size="6668",
total-sent="6144",total-size="9880"}
+download,{section=".text",section-sent="6656",section-size="6668",
total-sent="6656",total-size="9880"}
+download,{section=".init",section-size="28",total-size="9880"}
+download,{section=".fini",section-size="28",total-size="9880"}
+download,{section=".data",section-size="3156",total-size="9880"}
+download,{section=".data",section-sent="512",section-size="3156",
total-sent="7236",total-size="9880"}
+download,{section=".data",section-sent="1024",section-size="3156",
total-sent="7748",total-size="9880"}
+download,{section=".data",section-sent="1536",section-size="3156",
total-sent="8260",total-size="9880"}
+download,{section=".data",section-sent="2048",section-size="3156",
total-sent="8772",total-size="9880"}
+download,{section=".data",section-sent="2560",section-size="3156",
total-sent="9284",total-size="9880"}
+download,{section=".data",section-sent="3072",section-size="3156",
total-sent="9796",total-size="9880"}
^done,address="0x10004",load-size="9880",transfer-rate="6586",
write-rate="429"
(gdb)
GDB Command
No equivalent.
Example
N.A.
The -target-flash-erase Command
Synopsis
Erases all known flash memory regions on the target.
The corresponding GDB command is ‘flash-erase’.
The output is a list of flash regions that have been erased, with starting
addresses and memory region sizes.
(gdb)
-target-flash-erase
^done,erased-regions={address="0x0",size="0x40000"}
(gdb)
The -target-select Command
Synopsis
-target-select type parameters …
Connect GDB to the remote target. This command takes two args:
- ‘type’
-
The type of target, for instance ‘remote’, etc.
- ‘parameters’
-
Device names, host names and the like. See Commands for Managing Targets, for more details.
The output is a connection notification, followed by the address at
which the target program is, in the following form:
^connected,addr="address",func="function name", args=[arg list]
GDB Command
The corresponding GDB command is ‘target’.
Example
(gdb) -target-select remote /dev/ttya ^connected,addr="0xfe00a300",func="??",args=[] (gdb)
27.21 GDB/MI File Transfer Commands
The -target-file-put Command
Synopsis
-target-file-put hostfile targetfile
Copy file hostfile from the host system (the machine running
GDB) to targetfile on the target system.
GDB Command
The corresponding GDB command is ‘remote put’.
Example
(gdb) -target-file-put localfile remotefile ^done (gdb)
The -target-file-get Command
Synopsis
-target-file-get targetfile hostfile
Copy file targetfile from the target system to hostfile
on the host system.
GDB Command
The corresponding GDB command is ‘remote get’.
Example
(gdb) -target-file-get remotefile localfile ^done (gdb)
The -target-file-delete Command
Synopsis
-target-file-delete targetfile
Delete targetfile from the target system.
GDB Command
The corresponding GDB command is ‘remote delete’.
Example
(gdb) -target-file-delete remotefile ^done (gdb)
27.22 Ada Exceptions GDB/MI Commands
The -info-ada-exceptions Command
Synopsis
-info-ada-exceptions [ regexp]
List all Ada exceptions defined within the program being debugged.
With a regular expression regexp, only those exceptions whose
names match regexp are listed.
GDB Command
The corresponding GDB command is ‘info exceptions’.
Result
The result is a table of Ada exceptions. The following columns are
defined for each exception:
- ‘name’
-
The name of the exception.
- ‘address’
-
The address of the exception.
Example
-info-ada-exceptions aint
^done,ada-exceptions={nr_rows="2",nr_cols="2",
hdr=[{width="1",alignment="-1",col_name="name",colhdr="Name"},
{width="1",alignment="-1",col_name="address",colhdr="Address"}],
body=[{name="constraint_error",address="0x0000000000613da0"},
{name="const.aint_global_e",address="0x0000000000613b00"}]}
Catching Ada Exceptions
The commands describing how to ask GDB to stop when a program
raises an exception are described at Ada Exception GDB/MI Catchpoint Commands.
27.23 GDB/MI Support Commands
Since new commands and features get regularly added to GDB/MI,
some commands are available to help front-ends query the debugger
about support for these capabilities. Similarly, it is also possible
to query GDB about target support of certain features.
The -info-gdb-mi-command Command
Synopsis
-info-gdb-mi-command cmd_name
Query support for the GDB/MI command named cmd_name.
Note that the dash (-) starting all GDB/MI commands
is technically not part of the command name (see GDB/MI Input Syntax), and thus should be omitted in cmd_name. However,
for ease of use, this command also accepts the form with the leading
dash.
GDB Command
There is no corresponding GDB command.
Result
The result is a tuple. There is currently only one field:
- ‘exists’
-
This field is equal to
"true"if the GDB/MI command exists,
"false"otherwise.
Example
Here is an example where the GDB/MI command does not exist:
-info-gdb-mi-command unsupported-command
^done,command={exists="false"}
And here is an example where the GDB/MI command is known
to the debugger:
-info-gdb-mi-command symbol-list-lines
^done,command={exists="true"}
The -list-features Command
Returns a list of particular features of the MI protocol that
this version of gdb implements. A feature can be a command,
or a new field in an output of some command, or even an
important bugfix. While a frontend can sometimes detect presence
of a feature at runtime, it is easier to perform detection at debugger
startup.
The command returns a list of strings, with each string naming an
available feature. Each returned string is just a name, it does not
have any internal structure. The list of possible feature names
is given below.
Example output:
(gdb) -list-features ^done,result=["feature1","feature2"]
The current list of features is:
- ‘frozen-varobjs’
-
Indicates support for the
-var-set-frozencommand, as well
as possible presence of thefrozenfield in the output
of-varobj-create. - ‘pending-breakpoints’
-
Indicates support for the -f option to the
-break-insert
command. - ‘python’
-
Indicates Python scripting support, Python-based
pretty-printing commands, and possible presence of the
‘display_hint’ field in the output of-var-list-children - ‘thread-info’
-
Indicates support for the
-thread-infocommand. - ‘data-read-memory-bytes’
-
Indicates support for the
-data-read-memory-bytesand the
-data-write-memory-bytescommands. - ‘breakpoint-notifications’
-
Indicates that changes to breakpoints and breakpoints created via the
CLI will be announced via async records. - ‘ada-task-info’
-
Indicates support for the
-ada-task-infocommand. - ‘language-option’
-
Indicates that all GDB/MI commands accept the —language
option (see Context management). - ‘info-gdb-mi-command’
-
Indicates support for the
-info-gdb-mi-commandcommand. - ‘undefined-command-error-code’
-
Indicates support for the «undefined-command» error code in error result
records, produced when trying to execute an undefined GDB/MI command
(see GDB/MI Result Records). - ‘exec-run-start-option’
-
Indicates that the
-exec-runcommand supports the —start
option (see GDB/MI Program Execution). - ‘data-disassemble-a-option’
-
Indicates that the
-data-disassemblecommand supports the -a
option (see GDB/MI Data Manipulation).
The -list-target-features Command
Returns a list of particular features that are supported by the
target. Those features affect the permitted MI commands, but
unlike the features reported by the -list-features command, the
features depend on which target GDB is using at the moment. Whenever
a target can change, due to commands such as -target-select,
-target-attach or -exec-run, the list of target features
may change, and the frontend should obtain it again.
Example output:
(gdb) -list-target-features ^done,result=["async"]
The current list of features is:
- ‘async’
-
Indicates that the target is capable of asynchronous command
execution, which means that GDB will accept further commands
while the target is running. - ‘reverse’
-
Indicates that the target is capable of reverse execution.
See Reverse Execution, for more information.
27.24 Miscellaneous GDB/MI Commands
The -gdb-exit Command
Synopsis
Exit GDB immediately.
GDB Command
Approximately corresponds to ‘quit’.
Example
The -gdb-set Command
Synopsis
Set an internal GDB variable.
GDB Command
The corresponding GDB command is ‘set’.
Example
(gdb) -gdb-set $foo=3 ^done (gdb)
The -gdb-show Command
Synopsis
Show the current value of a GDB variable.
GDB Command
The corresponding GDB command is ‘show’.
Example
(gdb) -gdb-show annotate ^done,value="0" (gdb)
The -gdb-version Command
Synopsis
Show version information for GDB. Used mostly in testing.
GDB Command
The GDB equivalent is ‘show version’. GDB by
default shows this information when you start an interactive session.
Example
(gdb) -gdb-version ~GNU gdb 5.2.1 ~Copyright 2000 Free Software Foundation, Inc. ~GDB is free software, covered by the GNU General Public License, and ~you are welcome to change it and/or distribute copies of it under ~ certain conditions. ~Type "show copying" to see the conditions. ~There is absolutely no warranty for GDB. Type "show warranty" for ~ details. ~This GDB was configured as "--host=sparc-sun-solaris2.5.1 --target=ppc-eabi". ^done (gdb)
The -list-thread-groups Command
Synopsis
-list-thread-groups [ --available ] [ --recurse 1 ] [ group ... ]
Lists thread groups (see Thread groups). When a single thread
group is passed as the argument, lists the children of that group.
When several thread group are passed, lists information about those
thread groups. Without any parameters, lists information about all
top-level thread groups.
Normally, thread groups that are being debugged are reported.
With the ‘—available’ option, GDB reports thread groups
available on the target.
The output of this command may have either a ‘threads’ result or
a ‘groups’ result. The ‘thread’ result has a list of tuples
as value, with each tuple describing a thread (see GDB/MI Thread Information). The ‘groups’ result has a list of tuples as value,
each tuple describing a thread group. If top-level groups are
requested (that is, no parameter is passed), or when several groups
are passed, the output always has a ‘groups’ result. The format
of the ‘group’ result is described below.
To reduce the number of roundtrips it’s possible to list thread groups
together with their children, by passing the ‘—recurse’ option
and the recursion depth. Presently, only recursion depth of 1 is
permitted. If this option is present, then every reported thread group
will also include its children, either as ‘group’ or
‘threads’ field.
In general, any combination of option and parameters is permitted, with
the following caveats:
- When a single thread group is passed, the output will typically
be the ‘threads’ result. Because threads may not contain
anything, the ‘recurse’ option will be ignored. - When the ‘—available’ option is passed, limited information may
be available. In particular, the list of threads of a process might
be inaccessible. Further, specifying specific thread groups might
not give any performance advantage over listing all thread groups.
The frontend should assume that ‘-list-thread-groups —available’
is always an expensive operation and cache the results.
The ‘groups’ result is a list of tuples, where each tuple may
have the following fields:
id-
Identifier of the thread group. This field is always present.
The identifier is an opaque string; frontends should not try to
convert it to an integer, even though it might look like one. type-
The type of the thread group. At present, only ‘process’ is a
valid type. pid-
The target-specific process identifier. This field is only present
for thread groups of type ‘process’ and only if the process exists. exit-code-
The exit code of this group’s last exited thread, formatted in octal.
This field is only present for thread groups of type ‘process’ and
only if the process is not running. num_children-
The number of children this thread group has. This field may be
absent for an available thread group. threads-
This field has a list of tuples as value, each tuple describing a
thread. It may be present if the ‘—recurse’ option is
specified, and it’s actually possible to obtain the threads. cores-
This field is a list of integers, each identifying a core that one
thread of the group is running on. This field may be absent if
such information is not available. executable-
The name of the executable file that corresponds to this thread group.
The field is only present for thread groups of type ‘process’,
and only if there is a corresponding executable file.
Example
(gdb)
-list-thread-groups
^done,groups=[{id="17",type="process",pid="yyy",num_children="2"}]
-list-thread-groups 17
^done,threads=[{id="2",target-id="Thread 0xb7e14b90 (LWP 21257)",
frame={level="0",addr="0xffffe410",func="__kernel_vsyscall",args=[]},state="running"},
{id="1",target-id="Thread 0xb7e156b0 (LWP 21254)",
frame={level="0",addr="0x0804891f",func="foo",args=[{name="i",value="10"}],
file="/tmp/a.c",fullname="/tmp/a.c",line="158",arch="i386:x86_64"},state="running"}]]
-list-thread-groups --available
^done,groups=[{id="17",type="process",pid="yyy",num_children="2",cores=[1,2]}]
-list-thread-groups --available --recurse 1
^done,groups=[{id="17", types="process",pid="yyy",num_children="2",cores=[1,2],
threads=[{id="1",target-id="Thread 0xb7e14b90",cores=[1]},
{id="2",target-id="Thread 0xb7e14b90",cores=[2]}]},..]
-list-thread-groups --available --recurse 1 17 18
^done,groups=[{id="17", types="process",pid="yyy",num_children="2",cores=[1,2],
threads=[{id="1",target-id="Thread 0xb7e14b90",cores=[1]},
{id="2",target-id="Thread 0xb7e14b90",cores=[2]}]},...]
The -info-os Command
Synopsis
If no argument is supplied, the command returns a table of available
operating-system-specific information types. If one of these types is
supplied as an argument type, then the command returns a table
of data of that type.
The types of information available depend on the target operating
system.
GDB Command
The corresponding GDB command is ‘info os’.
Example
When run on a GNU/Linux system, the output will look something
like this:
(gdb)
-info-os
^done,OSDataTable={nr_rows="10",nr_cols="3",
hdr=[{width="10",alignment="-1",col_name="col0",colhdr="Type"},
{width="10",alignment="-1",col_name="col1",colhdr="Description"},
{width="10",alignment="-1",col_name="col2",colhdr="Title"}],
body=[item={col0="cpus",col1="Listing of all cpus/cores on the system",
col2="CPUs"},
item={col0="files",col1="Listing of all file descriptors",
col2="File descriptors"},
item={col0="modules",col1="Listing of all loaded kernel modules",
col2="Kernel modules"},
item={col0="msg",col1="Listing of all message queues",
col2="Message queues"},
item={col0="processes",col1="Listing of all processes",
col2="Processes"},
item={col0="procgroups",col1="Listing of all process groups",
col2="Process groups"},
item={col0="semaphores",col1="Listing of all semaphores",
col2="Semaphores"},
item={col0="shm",col1="Listing of all shared-memory regions",
col2="Shared-memory regions"},
item={col0="sockets",col1="Listing of all internet-domain sockets",
col2="Sockets"},
item={col0="threads",col1="Listing of all threads",
col2="Threads"}]
(gdb)
-info-os processes
^done,OSDataTable={nr_rows="190",nr_cols="4",
hdr=[{width="10",alignment="-1",col_name="col0",colhdr="pid"},
{width="10",alignment="-1",col_name="col1",colhdr="user"},
{width="10",alignment="-1",col_name="col2",colhdr="command"},
{width="10",alignment="-1",col_name="col3",colhdr="cores"}],
body=[item={col0="1",col1="root",col2="/sbin/init",col3="0"},
item={col0="2",col1="root",col2="[kthreadd]",col3="1"},
item={col0="3",col1="root",col2="[ksoftirqd/0]",col3="0"},
...
item={col0="26446",col1="stan",col2="bash",col3="0"},
item={col0="28152",col1="stan",col2="bash",col3="1"}]}
(gdb)
(Note that the MI output here includes a "Title" column that
does not appear in command-line info os; this column is useful
for MI clients that want to enumerate the types of data, such as in a
popup menu, but is needless clutter on the command line, and
info os omits it.)
The -add-inferior Command
Synopsis
-add-inferior [ --no-connection ]
Creates a new inferior (see Inferiors Connections and Programs). The created
inferior is not associated with any executable. Such association may
be established with the ‘-file-exec-and-symbols’ command
(see GDB/MI File Commands).
By default, the new inferior begins connected to the same target
connection as the current inferior. For example, if the current
inferior was connected to gdbserver with target remote,
then the new inferior will be connected to the same gdbserver
instance. The ‘—no-connection’ option starts the new inferior
with no connection yet. You can then for example use the
-target-select remote command to connect to some other
gdbserver instance, use -exec-run to spawn a local
program, etc.
The command response always has a field, inferior, whose value
is the identifier of the thread group corresponding to the new
inferior.
An additional section field, connection, is optional. This
field will only exist if the new inferior has a target connection. If
this field exists, then its value will be a tuple containing the
following fields:
- ‘number’
-
The number of the connection used for the new inferior.
- ‘name’
-
The name of the connection type used for the new inferior.
GDB Command
The corresponding GDB command is ‘add-inferior’
(see ‘add-inferior’).
Example
(gdb) -add-inferior ^done,inferior="i3"
The -interpreter-exec Command
Synopsis
-interpreter-exec interpreter command
Execute the specified command in the given interpreter.
GDB Command
The corresponding GDB command is ‘interpreter-exec’.
Example
(gdb) -interpreter-exec console "break main" &"During symbol reading, couldn't parse type; debugger out of date?.n" &"During symbol reading, bad structure-type format.n" ~"Breakpoint 1 at 0x8074fc6: file ../../src/gdb/main.c, line 743.n" ^done (gdb)
The -inferior-tty-set Command
Synopsis
-inferior-tty-set /dev/pts/1
Set terminal for future runs of the program being debugged.
GDB Command
The corresponding GDB command is ‘set inferior-tty’ /dev/pts/1.
Example
(gdb) -inferior-tty-set /dev/pts/1 ^done (gdb)
The -inferior-tty-show Command
Synopsis
Show terminal for future runs of program being debugged.
GDB Command
The corresponding GDB command is ‘show inferior-tty’.
Example
(gdb) -inferior-tty-set /dev/pts/1 ^done (gdb) -inferior-tty-show ^done,inferior_tty_terminal="/dev/pts/1" (gdb)
The -enable-timings Command
Synopsis
-enable-timings [yes | no]
Toggle the printing of the wallclock, user and system times for an MI
command as a field in its output. This command is to help frontend
developers optimize the performance of their code. No argument is
equivalent to ‘yes’.
GDB Command
No equivalent.
Example
(gdb)
-enable-timings
^done
(gdb)
-break-insert main
^done,bkpt={number="1",type="breakpoint",disp="keep",enabled="y",
addr="0x080484ed",func="main",file="myprog.c",
fullname="/home/nickrob/myprog.c",line="73",thread-groups=["i1"],
times="0"},
time={wallclock="0.05185",user="0.00800",system="0.00000"}
(gdb)
-enable-timings no
^done
(gdb)
-exec-run
^running
(gdb)
*stopped,reason="breakpoint-hit",disp="keep",bkptno="1",thread-id="0",
frame={addr="0x080484ed",func="main",args=[{name="argc",value="1"},
{name="argv",value="0xbfb60364"}],file="myprog.c",
fullname="/home/nickrob/myprog.c",line="73",arch="i386:x86_64"}
(gdb)
The -complete Command
Synopsis
Show a list of completions for partially typed CLI command.
This command is intended for GDB/MI frontends that cannot use two separate
CLI and MI channels — for example: because of lack of PTYs like on Windows or
because GDB is used remotely via a SSH connection.
Result
The result consists of two or three fields:
- ‘completion’
-
This field contains the completed command. If command
has no known completions, this field is omitted. - ‘matches’
-
This field contains a (possibly empty) array of matches. It is always present.
- ‘max_completions_reached’
-
This field contains
1if number of known completions is above
max-completionslimit (see Completion), otherwise it contains
0. It is always present.
GDB Command
The corresponding GDB command is ‘complete’.
Example
(gdb)
-complete br
^done,completion="break",
matches=["break","break-range"],
max_completions_reached="0"
(gdb)
-complete "b ma"
^done,completion="b ma",
matches=["b madvise","b main"],max_completions_reached="0"
(gdb)
-complete "b push_b"
^done,completion="b push_back(",
matches=[
"b A::push_back(void*)",
"b std::string::push_back(char)",
"b std::vector<int, std::allocator<int> >::push_back(int&&)"],
max_completions_reached="0"
(gdb)
-complete "nonexist"
^done,matches=[],max_completions_reached="0"
(gdb)
28 GDB Annotations
This chapter describes annotations in GDB. Annotations were
designed to interface GDB to graphical user interfaces or other
similar programs which want to interact with GDB at a
relatively high level.
The annotation mechanism has largely been superseded by GDB/MI
(see GDB/MI).
28.1 What is an Annotation?
Annotations start with a newline character, two ‘control-z’
characters, and the name of the annotation. If there is no additional
information associated with this annotation, the name of the annotation
is followed immediately by a newline. If there is additional
information, the name of the annotation is followed by a space, the
additional information, and a newline. The additional information
cannot contain newline characters.
Any output not beginning with a newline and two ‘control-z’
characters denotes literal output from GDB. Currently there is
no need for GDB to output a newline followed by two
‘control-z’ characters, but if there was such a need, the
annotations could be extended with an ‘escape’ annotation which
means those three characters as output.
The annotation level, which is specified using the
—annotate command line option (see Mode Options), controls
how much information GDB prints together with its prompt,
values of expressions, source lines, and other types of output. Level 0
is for no annotations, level 1 is for use when GDB is run as a
subprocess of GNU Emacs, level 3 is the maximum annotation suitable
for programs that control GDB, and level 2 annotations have
been made obsolete (see Limitations of the Annotation
Interface in GDB’s Obsolete Annotations).
set annotate level-
The GDB command
set annotatesets the level of
annotations to the specified level. show annotate-
Show the current annotation level.
This chapter describes level 3 annotations.
A simple example of starting up GDB with annotations is:
$ gdb --annotate=3 GNU gdb 6.0 Copyright 2003 Free Software Foundation, Inc. GDB is free software, covered by the GNU General Public License, and you are welcome to change it and/or distribute copies of it under certain conditions. Type "show copying" to see the conditions. There is absolutely no warranty for GDB. Type "show warranty" for details. This GDB was configured as "i386-pc-linux-gnu" ^Z^Zpre-prompt (gdb) ^Z^Zprompt quit ^Z^Zpost-prompt $
Here ‘quit’ is input to GDB; the rest is output from
GDB. The three lines beginning ‘^Z^Z’ (where ‘^Z’
denotes a ‘control-z’ character) are annotations; the rest is
output from GDB.
28.2 The Server Prefix
If you prefix a command with ‘server ’ then it will not affect
the command history, nor will it affect GDB’s notion of which
command to repeat if RET is pressed on a line by itself. This
means that commands can be run behind a user’s back by a front-end in
a transparent manner.
The server prefix does not affect the recording of values into
the value history; to print a value without recording it into the
value history, use the output command instead of the
print command.
Using this prefix also disables confirmation requests
(see confirmation requests).
28.3 Annotation for GDB Input
When GDB prompts for input, it annotates this fact so it is possible
to know when to send output, when the output from a given command is
over, etc.
Different kinds of input each have a different input type. Each
input type has three annotations: a pre- annotation, which
denotes the beginning of any prompt which is being output, a plain
annotation, which denotes the end of the prompt, and then a post-
annotation which denotes the end of any echo which may (or may not) be
associated with the input. For example, the prompt input type
features the following annotations:
^Z^Zpre-prompt ^Z^Zprompt ^Z^Zpost-prompt
The input types are
prompt-
When GDB is prompting for a command (the main GDB prompt).
commands-
When GDB prompts for a set of commands, like in the
commands
command. The annotations are repeated for each command which is input. overload-choice-
When GDB wants the user to select between various overloaded functions.
query-
When GDB wants the user to confirm a potentially dangerous operation.
prompt-for-continue-
When GDB is asking the user to press return to continue. Note: Don’t
expect this to work well; instead useset height 0to disable
prompting. This is because the counting of lines is buggy in the
presence of annotations.
28.4 Errors
This annotation occurs right before GDB responds to an interrupt.
This annotation occurs right before GDB responds to an error.
Quit and error annotations indicate that any annotations which GDB was
in the middle of may end abruptly. For example, if a
value-history-begin annotation is followed by a error, one
cannot expect to receive the matching value-history-end. One
cannot expect not to receive it either, however; an error annotation
does not necessarily mean that GDB is immediately returning all the way
to the top level.
A quit or error annotation may be preceded by
Any output between that and the quit or error annotation is the error
message.
Warning messages are not yet annotated.
28.5 Invalidation Notices
The following annotations say that certain pieces of state may have
changed.
^Z^Zframes-invalid-
The frames (for example, output from the
backtracecommand) may
have changed. ^Z^Zbreakpoints-invalid-
The breakpoints may have changed. For example, the user just added or
deleted a breakpoint.
28.6 Running the Program
When the program starts executing due to a GDB command such as
step or continue,
is output. When the program stops,
is output. Before the stopped annotation, a variety of
annotations describe how the program stopped.
^Z^Zexited exit-status-
The program exited, and exit-status is the exit status (zero for
successful exit, otherwise nonzero). ^Z^Zsignalled-
The program exited with a signal. After the
^Z^Zsignalled, the
annotation continues:intro-text ^Z^Zsignal-name name ^Z^Zsignal-name-end middle-text ^Z^Zsignal-string string ^Z^Zsignal-string-end end-text
where name is the name of the signal, such as
SIGILLor
SIGSEGV, and string is the explanation of the signal, such
asIllegal InstructionorSegmentation fault. The arguments
intro-text, middle-text, and end-text are for the
user’s benefit and have no particular format. ^Z^Zsignal-
The syntax of this annotation is just like
signalled, but GDB is
just saying that the program received the signal, not that it was
terminated with it. ^Z^Zbreakpoint number-
The program hit breakpoint number number.
^Z^Zwatchpoint number-
The program hit watchpoint number number.
28.7 Displaying Source
The following annotation is used instead of displaying source code:
^Z^Zsource filename:line:character:middle:addr
where filename is an absolute file name indicating which source
file, line is the line number within that file (where 1 is the
first line in the file), character is the character position
within the file (where 0 is the first character in the file) (for most
debug formats this will necessarily point to the beginning of a line),
middle is ‘middle’ if addr is in the middle of the
line, or ‘beg’ if addr is at the beginning of the line, and
addr is the address in the target program associated with the
source which is being displayed. The addr is in the form ‘0x’
followed by one or more lowercase hex digits (note that this does not
depend on the language).
29 JIT Compilation Interface
This chapter documents GDB’s just-in-time (JIT) compilation
interface. A JIT compiler is a program or library that generates native
executable code at runtime and executes it, usually in order to achieve good
performance while maintaining platform independence.
Programs that use JIT compilation are normally difficult to debug because
portions of their code are generated at runtime, instead of being loaded from
object files, which is where GDB normally finds the program’s symbols
and debug information. In order to debug programs that use JIT compilation,
GDB has an interface that allows the program to register in-memory
symbol files with GDB at runtime.
If you are using GDB to debug a program that uses this interface, then
it should work transparently so long as you have not stripped the binary. If
you are developing a JIT compiler, then the interface is documented in the rest
of this chapter. At this time, the only known client of this interface is the
LLVM JIT.
Broadly speaking, the JIT interface mirrors the dynamic loader interface. The
JIT compiler communicates with GDB by writing data into a global
variable and calling a function at a well-known symbol. When GDB
attaches, it reads a linked list of symbol files from the global variable to
find existing code, and puts a breakpoint in the function so that it can find
out about additional code.
29.1 JIT Declarations
These are the relevant struct declarations that a C program should include to
implement the interface:
typedef enum
{
JIT_NOACTION = 0,
JIT_REGISTER_FN,
JIT_UNREGISTER_FN
} jit_actions_t;
struct jit_code_entry
{
struct jit_code_entry *next_entry;
struct jit_code_entry *prev_entry;
const char *symfile_addr;
uint64_t symfile_size;
};
struct jit_descriptor
{
uint32_t version;
/* This type should be jit_actions_t, but we use uint32_t
to be explicit about the bitwidth. */
uint32_t action_flag;
struct jit_code_entry *relevant_entry;
struct jit_code_entry *first_entry;
};
/* GDB puts a breakpoint in this function. */
void __attribute__((noinline)) __jit_debug_register_code() { };
/* Make sure to specify the version statically, because the
debugger may check the version before we can set it. */
struct jit_descriptor __jit_debug_descriptor = { 1, 0, 0, 0 };
If the JIT is multi-threaded, then it is important that the JIT synchronize any
modifications to this global data properly, which can easily be done by putting
a global mutex around modifications to these structures.
29.2 Registering Code
To register code with GDB, the JIT should follow this protocol:
- Generate an object file in memory with symbols and other desired debug
information. The file must include the virtual addresses of the sections. - Create a code entry for the file, which gives the start and size of the symbol
file. - Add it to the linked list in the JIT descriptor.
- Point the relevant_entry field of the descriptor at the entry.
- Set
action_flagtoJIT_REGISTERand call
__jit_debug_register_code.
When GDB is attached and the breakpoint fires, GDB uses the
relevant_entry pointer so it doesn’t have to walk the list looking for
new code. However, the linked list must still be maintained in order to allow
GDB to attach to a running process and still find the symbol files.
29.3 Unregistering Code
If code is freed, then the JIT should use the following protocol:
- Remove the code entry corresponding to the code from the linked list.
- Point the
relevant_entryfield of the descriptor at the code entry. - Set
action_flagtoJIT_UNREGISTERand call
__jit_debug_register_code.
If the JIT frees or recompiles code without unregistering it, then GDB
and the JIT will leak the memory used for the associated symbol files.
29.4 Custom Debug Info
Generating debug information in platform-native file formats (like ELF
or COFF) may be an overkill for JIT compilers; especially if all the
debug info is used for is displaying a meaningful backtrace. The
issue can be resolved by having the JIT writers decide on a debug info
format and also provide a reader that parses the debug info generated
by the JIT compiler. This section gives a brief overview on writing
such a parser. More specific details can be found in the source file
gdb/jit-reader.in, which is also installed as a header at
includedir/gdb/jit-reader.h for easy inclusion.
The reader is implemented as a shared object (so this functionality is
not available on platforms which don’t allow loading shared objects at
runtime). Two GDB commands, jit-reader-load and
jit-reader-unload are provided, to be used to load and unload
the readers from a preconfigured directory. Once loaded, the shared
object is used the parse the debug information emitted by the JIT
compiler.
29.4.1 Using JIT Debug Info Readers
Readers can be loaded and unloaded using the jit-reader-load
and jit-reader-unload commands.
jit-reader-load reader-
Load the JIT reader named reader, which is a shared
object specified as either an absolute or a relative file name. In
the latter case, GDB will try to load the reader from a
pre-configured directory, usually libdir/gdb/ on a UNIX
system (here libdir is the system library directory, often
/usr/local/lib).Only one reader can be active at a time; trying to load a second
reader when one is already loaded will result in GDB
reporting an error. A new JIT reader can be loaded by first unloading
the current one usingjit-reader-unloadand then invoking
jit-reader-load. jit-reader-unload-
Unload the currently loaded JIT reader.
29.4.2 Writing JIT Debug Info Readers
As mentioned, a reader is essentially a shared object conforming to a
certain ABI. This ABI is described in jit-reader.h.
jit-reader.h defines the structures, macros and functions
required to write a reader. It is installed (along with
GDB), in includedir/gdb where includedir is
the system include directory.
Readers need to be released under a GPL compatible license. A reader
can be declared as released under such a license by placing the macro
GDB_DECLARE_GPL_COMPATIBLE_READER in a source file.
The entry point for readers is the symbol gdb_init_reader,
which is expected to be a function with the prototype
extern struct gdb_reader_funcs *gdb_init_reader (void);
struct gdb_reader_funcs contains a set of pointers to callback
functions. These functions are executed to read the debug info
generated by the JIT compiler (read), to unwind stack frames
(unwind) and to create canonical frame IDs
(get_frame_id). It also has a callback that is called when the
reader is being unloaded (destroy). The struct looks like this
struct gdb_reader_funcs
{
/* Must be set to GDB_READER_INTERFACE_VERSION. */
int reader_version;
/* For use by the reader. */
void *priv_data;
gdb_read_debug_info *read;
gdb_unwind_frame *unwind;
gdb_get_frame_id *get_frame_id;
gdb_destroy_reader *destroy;
};
The callbacks are provided with another set of callbacks by
GDB to do their job. For read, these callbacks are
passed in a struct gdb_symbol_callbacks and for unwind
and get_frame_id, in a struct gdb_unwind_callbacks.
struct gdb_symbol_callbacks has callbacks to create new object
files and new symbol tables inside those object files. struct has callbacks to read registers off the current
gdb_unwind_callbacks
frame and to write out the values of the registers in the previous
frame. Both have a callback (target_read) to read bytes off the
target’s address space.
30 In-Process Agent
The traditional debugging model is conceptually low-speed, but works fine,
because most bugs can be reproduced in debugging-mode execution. However,
as multi-core or many-core processors are becoming mainstream, and
multi-threaded programs become more and more popular, there should be more
and more bugs that only manifest themselves at normal-mode execution, for
example, thread races, because debugger’s interference with the program’s
timing may conceal the bugs. On the other hand, in some applications,
it is not feasible for the debugger to interrupt the program’s execution
long enough for the developer to learn anything helpful about its behavior.
If the program’s correctness depends on its real-time behavior, delays
introduced by a debugger might cause the program to fail, even when the
code itself is correct. It is useful to be able to observe the program’s
behavior without interrupting it.
Therefore, traditional debugging model is too intrusive to reproduce
some bugs. In order to reduce the interference with the program, we can
reduce the number of operations performed by debugger. The
In-Process Agent, a shared library, is running within the same
process with inferior, and is able to perform some debugging operations
itself. As a result, debugger is only involved when necessary, and
performance of debugging can be improved accordingly. Note that
interference with program can be reduced but can’t be removed completely,
because the in-process agent will still stop or slow down the program.
The in-process agent can interpret and execute Agent Expressions
(see Agent Expressions) during performing debugging operations. The
agent expressions can be used for different purposes, such as collecting
data in tracepoints, and condition evaluation in breakpoints.
You can control whether the in-process agent is used as an aid for
debugging with the following commands:
set agent on-
Causes the in-process agent to perform some operations on behalf of the
debugger. Just which operations requested by the user will be done
by the in-process agent depends on the its capabilities. For example,
if you request to evaluate breakpoint conditions in the in-process agent,
and the in-process agent has such capability as well, then breakpoint
conditions will be evaluated in the in-process agent. set agent off-
Disables execution of debugging operations by the in-process agent. All
of the operations will be performed by GDB. show agent-
Display the current setting of execution of debugging operations by
the in-process agent.
30.1 In-Process Agent Protocol
The in-process agent is able to communicate with both GDB and
GDBserver (see In-Process Agent). This section documents the protocol
used for communications between GDB or GDBserver and the IPA.
In general, GDB or GDBserver sends commands
(see IPA Protocol Commands) and data to in-process agent, and then
in-process agent replies back with the return result of the command, or
some other information. The data sent to in-process agent is composed
of primitive data types, such as 4-byte or 8-byte type, and composite
types, which are called objects (see IPA Protocol Objects).
30.1.1 IPA Protocol Objects
The commands sent to and results received from agent may contain some
complex data types called objects.
The in-process agent is running on the same machine with GDB
or GDBserver, so it doesn’t have to handle as much differences between
two ends as remote protocol (see Remote Protocol) tries to handle.
However, there are still some differences of two ends in two processes:
- word size. On some 64-bit machines, GDB or GDBserver can be
compiled as a 64-bit executable, while in-process agent is a 32-bit one. - ABI. Some machines may have multiple types of ABI, GDB or
GDBserver is compiled with one, and in-process agent is compiled with
the other one.
Here are the IPA Protocol Objects:
- agent expression object. It represents an agent expression
(see Agent Expressions). - tracepoint action object. It represents a tracepoint action
(see Tracepoint Action Lists) to collect registers,
memory, static trace data and to evaluate expression. - tracepoint object. It represents a tracepoint (see Tracepoints).
The following table describes important attributes of each IPA protocol
object:
| Name | Size | Description |
|---|---|---|
| agent expression object | ||
| length | 4 | length of bytes code |
| byte code | length | contents of byte code |
| tracepoint action for collecting memory | ||
| ’M’ | 1 | type of tracepoint action |
| addr | 8 | if basereg is ‘-1’, addr is the address of the lowest byte to collect, otherwise addr is the offset of basereg for memory collecting. |
| len | 8 | length of memory for collecting |
| basereg | 4 | the register number containing the starting memory address for collecting. |
| tracepoint action for collecting registers | ||
| ’R’ | 1 | type of tracepoint action |
| tracepoint action for collecting static trace data | ||
| ’L’ | 1 | type of tracepoint action |
| tracepoint action for expression evaluation | ||
| ’X’ | 1 | type of tracepoint action |
| agent expression | length of | agent expression object |
| tracepoint object | ||
| number | 4 | number of tracepoint |
| address | 8 | address of tracepoint inserted on |
| type | 4 | type of tracepoint |
| enabled | 1 | enable or disable of tracepoint |
| step_count | 8 | step |
| pass_count | 8 | pass |
| numactions | 4 | number of tracepoint actions |
| hit count | 8 | hit count |
| trace frame usage | 8 | trace frame usage |
| compiled_cond | 8 | compiled condition |
| orig_size | 8 | orig size |
| condition | 4 if condition is NULL otherwise length of agent expression object |
zero if condition is NULL, otherwise is agent expression object |
| actions | variable | numactions number of tracepoint action object |
30.1.2 IPA Protocol Commands
The spaces in each command are delimiters to ease reading this commands
specification. They don’t exist in real commands.
- ‘FastTrace:tracepoint_object gdb_jump_pad_head’
-
Installs a new fast tracepoint described by tracepoint_object
(see tracepoint object). The gdb_jump_pad_head, 8-byte long, is the
head of jumppad, which is used to jump to data collection routine
in IPA finally.Replies:
- ‘OK target_address gdb_jump_pad_head fjump_size fjump’
-
target_address is address of tracepoint in the inferior.
The gdb_jump_pad_head is updated head of jumppad. Both of
target_address and gdb_jump_pad_head are 8-byte long.
The fjump contains a sequence of instructions jump to jumppad entry.
The fjump_size, 4-byte long, is the size of fjump. - ‘E NN’
-
for an error
- ‘close’
-
Closes the in-process agent. This command is sent when GDB or GDBserver
is about to kill inferiors. - ‘qTfSTM’
-
See qTfSTM.
- ‘qTsSTM’
-
See qTsSTM.
- ‘qTSTMat’
-
See qTSTMat.
- ‘probe_marker_at:address’
-
Asks in-process agent to probe the marker at address.
Replies:
- ‘E NN’
-
for an error
- ‘unprobe_marker_at:address’
-
Asks in-process agent to unprobe the marker at address.
31 Reporting Bugs in GDB
Your bug reports play an essential role in making GDB reliable.
Reporting a bug may help you by bringing a solution to your problem, or it
may not. But in any case the principal function of a bug report is to help
the entire community by making the next version of GDB work better. Bug
reports are your contribution to the maintenance of GDB.
In order for a bug report to serve its purpose, you must include the
information that enables us to fix the bug.
31.1 Have You Found a Bug?
If you are not sure whether you have found a bug, here are some guidelines:
-
If the debugger gets a fatal signal, for any input whatever, that is a
GDB bug. Reliable debuggers never crash. -
If GDB produces an error message for valid input, that is a
bug. (Note that if you’re cross debugging, the problem may also be
somewhere in the connection to the target.) -
If GDB does not produce an error message for invalid input,
that is a bug. However, you should note that your idea of
“invalid input” might be our idea of “an extension” or “support
for traditional practice”. - If you are an experienced user of debugging tools, your suggestions
for improvement of GDB are welcome in any case.
31.2 How to Report Bugs
A number of companies and individuals offer support for GNU products.
If you obtained GDB from a support organization, we recommend you
contact that organization first.
You can find contact information for many support companies and
individuals in the file etc/SERVICE in the GNU Emacs
distribution.
In any event, we also recommend that you submit bug reports for
GDB to https://www.gnu.org/software/gdb/bugs/.
The fundamental principle of reporting bugs usefully is this:
report all the facts. If you are not sure whether to state a
fact or leave it out, state it!
Often people omit facts because they think they know what causes the
problem and assume that some details do not matter. Thus, you might
assume that the name of the variable you use in an example does not matter.
Well, probably it does not, but one cannot be sure. Perhaps the bug is a
stray memory reference which happens to fetch from the location where that
name is stored in memory; perhaps, if the name were different, the contents
of that location would fool the debugger into doing the right thing despite
the bug. Play it safe and give a specific, complete example. That is the
easiest thing for you to do, and the most helpful.
Keep in mind that the purpose of a bug report is to enable us to fix the
bug. It may be that the bug has been reported previously, but neither
you nor we can know that unless your bug report is complete and
self-contained.
Sometimes people give a few sketchy facts and ask, “Does this ring a
bell?” Those bug reports are useless, and we urge everyone to
refuse to respond to them except to chide the sender to report
bugs properly.
To enable us to fix the bug, you should include all these things:
- The version of GDB. GDB announces it if you start
with no arguments; you can also print it at any time usingshow.
versionWithout this, we will not know whether there is any point in looking for
the bug in the current version of GDB. - The type of machine you are using, and the operating system name and
version number. - The details of the GDB build-time configuration.
GDB shows these details if you invoke it with the
—configuration command-line option, or if you type
show configurationat GDB’s prompt. - What compiler (and its version) was used to compile GDB—e.g.
“gcc–2.8.1”. - What compiler (and its version) was used to compile the program you are
debugging—e.g. “gcc–2.8.1”, or “HP92453-01 A.10.32.03 HP
C Compiler”. For GCC, you can say gcc --version
to get this information; for other compilers, see the documentation for
those compilers. - The command arguments you gave the compiler to compile your example and
observe the bug. For example, did you use ‘-O’? To guarantee
you will not omit something important, list them all. A copy of the
Makefile (or the output from make) is sufficient.If we were to try to guess the arguments, we would probably guess wrong
and then we might not encounter the bug. - A complete input script, and all necessary source files, that will
reproduce the bug. - A description of what behavior you observe that you believe is
incorrect. For example, “It gets a fatal signal.”Of course, if the bug is that GDB gets a fatal signal, then we
will certainly notice it. But if the bug is incorrect output, we might
not notice unless it is glaringly wrong. You might as well not give us
a chance to make a mistake.Even if the problem you experience is a fatal signal, you should still
say so explicitly. Suppose something strange is going on, such as, your
copy of GDB is out of synch, or you have encountered a bug in
the C library on your system. (This has happened!) Your copy might
crash and ours would not. If you told us to expect a crash, then when
ours fails to crash, we would know that the bug was not happening for
us. If you had not told us to expect a crash, then we would not be able
to draw any conclusion from our observations.To collect all this information, you can use a session recording program
such asscript, which is available on many Unix systems.
Just run your GDB session insidescriptand then
include the typescript file with your bug report.Another way to record a GDB session is to run GDB
inside Emacs and then save the entire buffer to a file. - If you wish to suggest changes to the GDB source, send us context
diffs. If you even discuss something in the GDB source, refer to
it by context, not by line number.The line numbers in our development sources will not match those in your
sources. Your line numbers would convey no useful information to us.
Here are some things that are not necessary:
- A description of the envelope of the bug.
Often people who encounter a bug spend a lot of time investigating
which changes to the input file will make the bug go away and which
changes will not affect it.This is often time consuming and not very useful, because the way we
will find the bug is by running a single example under the debugger
with breakpoints, not by pure deduction from a series of examples.
We recommend that you save your time for something else.Of course, if you can find a simpler example to report instead
of the original one, that is a convenience for us. Errors in the
output will be easier to spot, running under the debugger will take
less time, and so on.However, simplification is not vital; if you do not want to do this,
report the bug anyway and send us the entire test case you used. - A patch for the bug.
A patch for the bug does help us if it is a good one. But do not omit
the necessary information, such as the test case, on the assumption that
a patch is all we need. We might see problems with your patch and decide
to fix the problem another way, or we might not understand it at all.Sometimes with a program as complicated as GDB it is very hard to
construct an example that will make the program follow a certain path
through the code. If you do not send us the example, we will not be able
to construct one, so we will not be able to verify that the bug is fixed.And if we cannot understand what bug you are trying to fix, or why your
patch should be an improvement, we will not install it. A test case will
help us to understand. - A guess about what the bug is or what it depends on.
Such guesses are usually wrong. Even we cannot guess right about such
things without first using the debugger to find the facts.
32 Command Line Editing
This chapter describes the basic features of the GNU
command line editing interface.
32.1 Introduction to Line Editing
The following paragraphs describe the notation used to represent
keystrokes.
The text C-k is read as ‘Control-K’ and describes the character
produced when the k key is pressed while the Control key
is depressed.
The text M-k is read as ‘Meta-K’ and describes the character
produced when the Meta key (if you have one) is depressed, and the k
key is pressed.
The Meta key is labeled ALT on many keyboards.
On keyboards with two keys labeled ALT (usually to either side of
the space bar), the ALT on the left side is generally set to
work as a Meta key.
The ALT key on the right may also be configured to work as a
Meta key or may be configured as some other modifier, such as a
Compose key for typing accented characters.
If you do not have a Meta or ALT key, or another key working as
a Meta key, the identical keystroke can be generated by typing ESC
first, and then typing k.
Either process is known as metafying the k key.
The text M-C-k is read as ‘Meta-Control-k’ and describes the
character produced by metafying C-k.
In addition, several keys have their own names. Specifically,
DEL, ESC, LFD, SPC, RET, and TAB all
stand for themselves when seen in this text, or in an init file
(see Readline Init File).
If your keyboard lacks a LFD key, typing C-j will
produce the desired character.
The RET key may be labeled Return or Enter on
some keyboards.
32.2 Readline Interaction
Often during an interactive session you type in a long line of text,
only to notice that the first word on the line is misspelled. The
Readline library gives you a set of commands for manipulating the text
as you type it in, allowing you to just fix your typo, and not forcing
you to retype the majority of the line. Using these editing commands,
you move the cursor to the place that needs correction, and delete or
insert the text of the corrections. Then, when you are satisfied with
the line, you simply press RET. You do not have to be at the
end of the line to press RET; the entire line is accepted
regardless of the location of the cursor within the line.
32.2.1 Readline Bare Essentials
In order to enter characters into the line, simply type them. The typed
character appears where the cursor was, and then the cursor moves one
space to the right. If you mistype a character, you can use your
erase character to back up and delete the mistyped character.
Sometimes you may mistype a character, and
not notice the error until you have typed several other characters. In
that case, you can type C-b to move the cursor to the left, and then
correct your mistake. Afterwards, you can move the cursor to the right
with C-f.
When you add text in the middle of a line, you will notice that characters
to the right of the cursor are ‘pushed over’ to make room for the text
that you have inserted. Likewise, when you delete text behind the cursor,
characters to the right of the cursor are ‘pulled back’ to fill in the
blank space created by the removal of the text. A list of the bare
essentials for editing the text of an input line follows.
- C-b
-
Move back one character.
- C-f
-
Move forward one character.
- DEL or Backspace
-
Delete the character to the left of the cursor.
- C-d
-
Delete the character underneath the cursor.
- Printing characters
-
Insert the character into the line at the cursor.
- C-_ or C-x C-u
-
Undo the last editing command. You can undo all the way back to an
empty line.
(Depending on your configuration, the Backspace key be set to
delete the character to the left of the cursor and the DEL key set
to delete the character underneath the cursor, like C-d, rather
than the character to the left of the cursor.)
32.2.2 Readline Movement Commands
The above table describes the most basic keystrokes that you need
in order to do editing of the input line. For your convenience, many
other commands have been added in addition to C-b, C-f,
C-d, and DEL. Here are some commands for moving more rapidly
about the line.
- C-a
-
Move to the start of the line.
- C-e
-
Move to the end of the line.
- M-f
-
Move forward a word, where a word is composed of letters and digits.
- M-b
-
Move backward a word.
- C-l
-
Clear the screen, reprinting the current line at the top.
Notice how C-f moves forward a character, while M-f moves
forward a word. It is a loose convention that control keystrokes
operate on characters while meta keystrokes operate on words.
32.2.3 Readline Killing Commands
Killing text means to delete the text from the line, but to save
it away for later use, usually by yanking (re-inserting)
it back into the line.
(‘Cut’ and ‘paste’ are more recent jargon for ‘kill’ and ‘yank’.)
If the description for a command says that it ‘kills’ text, then you can
be sure that you can get the text back in a different (or the same)
place later.
When you use a kill command, the text is saved in a kill-ring.
Any number of consecutive kills save all of the killed text together, so
that when you yank it back, you get it all. The kill
ring is not line specific; the text that you killed on a previously
typed line is available to be yanked back later, when you are typing
another line.
Here is the list of commands for killing text.
- C-k
-
Kill the text from the current cursor position to the end of the line.
- M-d
-
Kill from the cursor to the end of the current word, or, if between
words, to the end of the next word.
Word boundaries are the same as those used by M-f. - M-DEL
-
Kill from the cursor the start of the current word, or, if between
words, to the start of the previous word.
Word boundaries are the same as those used by M-b. - C-w
-
Kill from the cursor to the previous whitespace. This is different than
M-DEL because the word boundaries differ.
Here is how to yank the text back into the line. Yanking
means to copy the most-recently-killed text from the kill buffer.
- C-y
-
Yank the most recently killed text back into the buffer at the cursor.
- M-y
-
Rotate the kill-ring, and yank the new top. You can only do this if
the prior command is C-y or M-y.
32.2.4 Readline Arguments
You can pass numeric arguments to Readline commands. Sometimes the
argument acts as a repeat count, other times it is the sign of the
argument that is significant. If you pass a negative argument to a
command which normally acts in a forward direction, that command will
act in a backward direction. For example, to kill text back to the
start of the line, you might type ‘M— C-k’.
The general way to pass numeric arguments to a command is to type meta
digits before the command. If the first ‘digit’ typed is a minus
sign (‘—’), then the sign of the argument will be negative. Once
you have typed one meta digit to get the argument started, you can type
the remainder of the digits, and then the command. For example, to give
the C-d command an argument of 10, you could type ‘M-1 0 C-d’,
which will delete the next ten characters on the input line.
32.2.5 Searching for Commands in the History
Readline provides commands for searching through the command history
for lines containing a specified string.
There are two search modes: incremental and non-incremental.
Incremental searches begin before the user has finished typing the
search string.
As each character of the search string is typed, Readline displays
the next entry from the history matching the string typed so far.
An incremental search requires only as many characters as needed to
find the desired history entry.
To search backward in the history for a particular string, type
C-r. Typing C-s searches forward through the history.
The characters present in the value of the isearch-terminators variable
are used to terminate an incremental search.
If that variable has not been assigned a value, the ESC and
C-J characters will terminate an incremental search.
C-g will abort an incremental search and restore the original line.
When the search is terminated, the history entry containing the
search string becomes the current line.
To find other matching entries in the history list, type C-r or
C-s as appropriate.
This will search backward or forward in the history for the next
entry matching the search string typed so far.
Any other key sequence bound to a Readline command will terminate
the search and execute that command.
For instance, a RET will terminate the search and accept
the line, thereby executing the command from the history list.
A movement command will terminate the search, make the last line found
the current line, and begin editing.
Readline remembers the last incremental search string. If two
C-rs are typed without any intervening characters defining a new
search string, any remembered search string is used.
Non-incremental searches read the entire search string before starting
to search for matching history lines. The search string may be
typed by the user or be part of the contents of the current line.
32.3 Readline Init File
Although the Readline library comes with a set of Emacs-like
keybindings installed by default, it is possible to use a different set
of keybindings.
Any user can customize programs that use Readline by putting
commands in an inputrc file, conventionally in his home directory.
The name of this
file is taken from the value of the environment variable INPUTRC. If
that variable is unset, the default is ~/.inputrc. If that
file does not exist or cannot be read, the ultimate default is
/etc/inputrc.
When a program which uses the Readline library starts up, the
init file is read, and the key bindings are set.
In addition, the C-x C-r command re-reads this init file, thus
incorporating any changes that you might have made to it.
32.3.1 Readline Init File Syntax
There are only a few basic constructs allowed in the
Readline init file. Blank lines are ignored.
Lines beginning with a ‘#’ are comments.
Lines beginning with a ‘$’ indicate conditional
constructs (see Conditional Init Constructs). Other lines
denote variable settings and key bindings.
- Variable Settings
-
You can modify the run-time behavior of Readline by
altering the values of variables in Readline
using thesetcommand within the init file.
The syntax is simple:Here, for example, is how to
change from the default Emacs-like key binding to use
viline editing commands:Variable names and values, where appropriate, are recognized without regard
to case. Unrecognized variable names are ignored.Boolean variables (those that can be set to on or off) are set to on if
the value is null or empty, on (case-insensitive), or 1. Any other
value results in the variable being set to off.A great deal of run-time behavior is changeable with the following
variables.bell-style-
Controls what happens when Readline wants to ring the terminal bell.
If set to ‘none’, Readline never rings the bell. If set to
‘visible’, Readline uses a visible bell if one is available.
If set to ‘audible’ (the default), Readline attempts to ring
the terminal’s bell. bind-tty-special-chars-
If set to ‘on’ (the default), Readline attempts to bind the control
characters treated specially by the kernel’s terminal driver to their
Readline equivalents. blink-matching-paren-
If set to ‘on’, Readline attempts to briefly move the cursor to an
opening parenthesis when a closing parenthesis is inserted. The default
is ‘off’. colored-completion-prefix-
If set to ‘on’, when listing completions, Readline displays the
common prefix of the set of possible completions using a different color.
The color definitions are taken from the value of theLS_COLORS
environment variable.
The default is ‘off’. colored-stats-
If set to ‘on’, Readline displays possible completions using different
colors to indicate their file type.
The color definitions are taken from the value of theLS_COLORS
environment variable.
The default is ‘off’. comment-begin-
The string to insert at the beginning of the line when the
insert-commentcommand is executed. The default value
is"#". completion-display-width-
The number of screen columns used to display possible matches
when performing completion.
The value is ignored if it is less than 0 or greater than the terminal
screen width.
A value of 0 will cause matches to be displayed one per line.
The default value is -1. completion-ignore-case-
If set to ‘on’, Readline performs filename matching and completion
in a case-insensitive fashion.
The default value is ‘off’. completion-map-case-
If set to ‘on’, and completion-ignore-case is enabled, Readline
treats hyphens (‘—’) and underscores (‘_’) as equivalent when
performing case-insensitive filename matching and completion.
The default value is ‘off’. completion-prefix-display-length-
The length in characters of the common prefix of a list of possible
completions that is displayed without modification. When set to a
value greater than zero, common prefixes longer than this value are
replaced with an ellipsis when displaying possible completions. completion-query-items-
The number of possible completions that determines when the user is
asked whether the list of possibilities should be displayed.
If the number of possible completions is greater than or equal to this value,
Readline will ask whether or not the user wishes to view them;
otherwise, they are simply listed.
This variable must be set to an integer value greater than or equal to 0.
A negative value means Readline should never ask.
The default limit is100. convert-meta-
If set to ‘on’, Readline will convert characters with the
eighth bit set to an ASCII key sequence by stripping the eighth
bit and prefixing an ESC character, converting them to a
meta-prefixed key sequence. The default value is ‘on’, but
will be set to ‘off’ if the locale is one that contains
eight-bit characters. disable-completion-
If set to ‘On’, Readline will inhibit word completion.
Completion characters will be inserted into the line as if they had
been mapped toself-insert. The default is ‘off’. echo-control-characters-
When set to ‘on’, on operating systems that indicate they support it,
readline echoes a character corresponding to a signal generated from the
keyboard. The default is ‘on’. editing-mode-
The
editing-modevariable controls which default set of
key bindings is used. By default, Readline starts up in Emacs editing
mode, where the keystrokes are most similar to Emacs. This variable can be
set to either ‘emacs’ or ‘vi’. emacs-mode-string-
If the show-mode-in-prompt variable is enabled,
this string is displayed immediately before the last line of the primary
prompt when emacs editing mode is active. The value is expanded like a
key binding, so the standard set of meta- and control prefixes and
backslash escape sequences is available.
Use the ‘1’ and ‘2’ escapes to begin and end sequences of
non-printing characters, which can be used to embed a terminal control
sequence into the mode string.
The default is ‘@’. enable-bracketed-paste-
When set to ‘On’, Readline will configure the terminal in a way
that will enable it to insert each paste into the editing buffer as a
single string of characters, instead of treating each character as if
it had been read from the keyboard. This can prevent pasted characters
from being interpreted as editing commands. The default is ‘On’. enable-keypad-
When set to ‘on’, Readline will try to enable the application
keypad when it is called. Some systems need this to enable the
arrow keys. The default is ‘off’. enable-meta-key-
When set to ‘on’, Readline will try to enable any meta modifier
key the terminal claims to support when it is called. On many terminals,
the meta key is used to send eight-bit characters.
The default is ‘on’. expand-tilde-
If set to ‘on’, tilde expansion is performed when Readline
attempts word completion. The default is ‘off’. history-preserve-point-
If set to ‘on’, the history code attempts to place the point (the
current cursor position) at the
same location on each history line retrieved withprevious-history
ornext-history. The default is ‘off’. history-size-
Set the maximum number of history entries saved in the history list.
If set to zero, any existing history entries are deleted and no new entries
are saved.
If set to a value less than zero, the number of history entries is not
limited.
By default, the number of history entries is not limited.
If an attempt is made to set history-size to a non-numeric value,
the maximum number of history entries will be set to 500. horizontal-scroll-mode-
This variable can be set to either ‘on’ or ‘off’. Setting it
to ‘on’ means that the text of the lines being edited will scroll
horizontally on a single screen line when they are longer than the width
of the screen, instead of wrapping onto a new screen line.
This variable is automatically set to ‘on’ for terminals of height 1.
By default, this variable is set to ‘off’. input-meta-
If set to ‘on’, Readline will enable eight-bit input (it
will not clear the eighth bit in the characters it reads),
regardless of what the terminal claims it can support. The
default value is ‘off’, but Readline will set it to ‘on’ if the
locale contains eight-bit characters.
The namemeta-flagis a synonym for this variable. isearch-terminators-
The string of characters that should terminate an incremental search without
subsequently executing the character as a command (see Searching).
If this variable has not been given a value, the characters ESC and
C-J will terminate an incremental search. keymap-
Sets Readline’s idea of the current keymap for key binding commands.
Built-inkeymapnames are
emacs,
emacs-standard,
emacs-meta,
emacs-ctlx,
vi,
vi-move,
vi-command, and
vi-insert.
viis equivalent tovi-command(vi-moveis also a
synonym);emacsis equivalent toemacs-standard.
Applications may add additional names.
The default value isemacs.
The value of theediting-modevariable also affects the
default keymap. keyseq-timeout-
Specifies the duration Readline will wait for a character when reading an
ambiguous key sequence (one that can form a complete key sequence using
the input read so far, or can take additional input to complete a longer
key sequence).
If no input is received within the timeout, Readline will use the shorter
but complete key sequence.
Readline uses this value to determine whether or not input is
available on the current input source (rl_instreamby default).
The value is specified in milliseconds, so a value of 1000 means that
Readline will wait one second for additional input.
If this variable is set to a value less than or equal to zero, or to a
non-numeric value, Readline will wait until another key is pressed to
decide which key sequence to complete.
The default value is500. mark-directories-
If set to ‘on’, completed directory names have a slash
appended. The default is ‘on’. mark-modified-lines-
This variable, when set to ‘on’, causes Readline to display an
asterisk (‘*’) at the start of history lines which have been modified.
This variable is ‘off’ by default. mark-symlinked-directories-
If set to ‘on’, completed names which are symbolic links
to directories have a slash appended (subject to the value of
mark-directories).
The default is ‘off’. match-hidden-files-
This variable, when set to ‘on’, causes Readline to match files whose
names begin with a ‘.’ (hidden files) when performing filename
completion.
If set to ‘off’, the leading ‘.’ must be
supplied by the user in the filename to be completed.
This variable is ‘on’ by default. menu-complete-display-prefix-
If set to ‘on’, menu completion displays the common prefix of the
list of possible completions (which may be empty) before cycling through
the list. The default is ‘off’. output-meta-
If set to ‘on’, Readline will display characters with the
eighth bit set directly rather than as a meta-prefixed escape
sequence.
The default is ‘off’, but Readline will set it to ‘on’ if the
locale contains eight-bit characters. page-completions-
If set to ‘on’, Readline uses an internal
more-like pager
to display a screenful of possible completions at a time.
This variable is ‘on’ by default. print-completions-horizontally-
If set to ‘on’, Readline will display completions with matches
sorted horizontally in alphabetical order, rather than down the screen.
The default is ‘off’. revert-all-at-newline-
If set to ‘on’, Readline will undo all changes to history lines
before returning whenaccept-lineis executed. By default,
history lines may be modified and retain individual undo lists across
calls toreadline. The default is ‘off’. show-all-if-ambiguous-
This alters the default behavior of the completion functions. If
set to ‘on’,
words which have more than one possible completion cause the
matches to be listed immediately instead of ringing the bell.
The default value is ‘off’. show-all-if-unmodified-
This alters the default behavior of the completion functions in
a fashion similar to show-all-if-ambiguous.
If set to ‘on’,
words which have more than one possible completion without any
possible partial completion (the possible completions don’t share
a common prefix) cause the matches to be listed immediately instead
of ringing the bell.
The default value is ‘off’. show-mode-in-prompt-
If set to ‘on’, add a string to the beginning of the prompt
indicating the editing mode: emacs, vi command, or vi insertion.
The mode strings are user-settable (e.g., emacs-mode-string).
The default value is ‘off’. skip-completed-text-
If set to ‘on’, this alters the default completion behavior when
inserting a single match into the line. It’s only active when
performing completion in the middle of a word. If enabled, readline
does not insert characters from the completion that match characters
after point in the word being completed, so portions of the word
following the cursor are not duplicated.
For instance, if this is enabled, attempting completion when the cursor
is after the ‘e’ in ‘Makefile’ will result in ‘Makefile’
rather than ‘Makefilefile’, assuming there is a single possible
completion.
The default value is ‘off’. vi-cmd-mode-string-
If the show-mode-in-prompt variable is enabled,
this string is displayed immediately before the last line of the primary
prompt when vi editing mode is active and in command mode.
The value is expanded like a
key binding, so the standard set of meta- and control prefixes and
backslash escape sequences is available.
Use the ‘1’ and ‘2’ escapes to begin and end sequences of
non-printing characters, which can be used to embed a terminal control
sequence into the mode string.
The default is ‘(cmd)’. vi-ins-mode-string-
If the show-mode-in-prompt variable is enabled,
this string is displayed immediately before the last line of the primary
prompt when vi editing mode is active and in insertion mode.
The value is expanded like a
key binding, so the standard set of meta- and control prefixes and
backslash escape sequences is available.
Use the ‘1’ and ‘2’ escapes to begin and end sequences of
non-printing characters, which can be used to embed a terminal control
sequence into the mode string.
The default is ‘(ins)’. visible-stats-
If set to ‘on’, a character denoting a file’s type
is appended to the filename when listing possible
completions. The default is ‘off’.
- Key Bindings
-
The syntax for controlling key bindings in the init file is
simple. First you need to find the name of the command that you
want to change. The following sections contain tables of the command
name, the default keybinding, if any, and a short description of what
the command does.Once you know the name of the command, simply place on a line
in the init file the name of the key
you wish to bind the command to, a colon, and then the name of the
command.
There can be no space between the key name and the colon – that will be
interpreted as part of the key name.
The name of the key can be expressed in different ways, depending on
what you find most comfortable.In addition to command names, readline allows keys to be bound
to a string that is inserted when the key is pressed (a macro).- keyname: function-name or macro
-
keyname is the name of a key spelled out in English. For example:
Control-u: universal-argument Meta-Rubout: backward-kill-word Control-o: "> output"
In the example above, C-u is bound to the function
universal-argument,
M-DEL is bound to the functionbackward-kill-word, and
C-o is bound to run the macro
expressed on the right hand side (that is, to insert the text
‘> output’ into the line).A number of symbolic character names are recognized while
processing this key binding syntax:
DEL,
ESC,
ESCAPE,
LFD,
NEWLINE,
RET,
RETURN,
RUBOUT,
SPACE,
SPC,
and
TAB. - «keyseq«: function-name or macro
-
keyseq differs from keyname above in that strings
denoting an entire key sequence can be specified, by placing
the key sequence in double quotes. Some GNU Emacs style key
escapes can be used, as in the following example, but the
special character names are not recognized."C-u": universal-argument "C-xC-r": re-read-init-file "e[11~": "Function Key 1"
In the above example, C-u is again bound to the function
universal-argument(just as it was in the first example),
‘C-x C-r’ is bound to the functionre-read-init-file,
and ‘ESC [ 1 1 ~’ is bound to insert
the text ‘Function Key 1’.
The following GNU Emacs style escape sequences are available when
specifying key sequences:C--
control prefix
M--
meta prefix
e-
an escape character
\-
backslash
"-
«, a double quotation mark
'-
‘, a single quote or apostrophe
In addition to the GNU Emacs style escape sequences, a second
set of backslash escapes is available:a-
alert (bell)
b-
backspace
d-
delete
f-
form feed
n-
newline
r-
carriage return
t-
horizontal tab
v-
vertical tab
nnn-
the eight-bit character whose value is the octal value nnn
(one to three digits) xHH-
the eight-bit character whose value is the hexadecimal value HH
(one or two hex digits)
When entering the text of a macro, single or double quotes must
be used to indicate a macro definition.
Unquoted text is assumed to be a function name.
In the macro body, the backslash escapes described above are expanded.
Backslash will quote any other character in the macro text,
including ‘«’ and ‘‘’.
For example, the following binding will make ‘C-x ’
insert a single ‘’ into the line:
32.3.2 Conditional Init Constructs
Readline implements a facility similar in spirit to the conditional
compilation features of the C preprocessor which allows key
bindings and variable settings to be performed as the result
of tests. There are four parser directives used.
$if-
The
$ifconstruct allows bindings to be made based on the
editing mode, the terminal being used, or the application using
Readline. The text of the test, after any comparison operator,
extends to the end of the line;
unless otherwise noted, no characters are required to isolate it.mode-
The
mode=form of the$ifdirective is used to test
whether Readline is inemacsorvimode.
This may be used in conjunction
with the ‘set keymap’ command, for instance, to set bindings in
theemacs-standardandemacs-ctlxkeymaps only if
Readline is starting out inemacsmode. term-
The
term=form may be used to include terminal-specific
key bindings, perhaps to bind the key sequences output by the
terminal’s function keys. The word on the right side of the
‘=’ is tested against both the full name of the terminal and
the portion of the terminal name before the first ‘—’. This
allowssunto match bothsunandsun-cmd,
for instance. version-
The
versiontest may be used to perform comparisons against
specific Readline versions.
Theversionexpands to the current Readline version.
The set of comparison operators includes
‘=’ (and ‘==’), ‘!=’, ‘<=’, ‘>=’, ‘<’,
and ‘>’.
The version number supplied on the right side of the operator consists
of a major version number, an optional decimal point, and an optional
minor version (e.g., ‘7.1’). If the minor version is omitted, it
is assumed to be ‘0’.
The operator may be separated from the stringversionand
from the version number argument by whitespace.
The following example sets a variable if the Readline version being used
is 7.0 or newer:$if version >= 7.0 set show-mode-in-prompt on $endif
application-
The application construct is used to include
application-specific settings. Each program using the Readline
library sets the application name, and you can test for
a particular value.
This could be used to bind key sequences to functions useful for
a specific program. For instance, the following command adds a
key sequence that quotes the current or previous word in Bash:$if Bash # Quote the current or previous word "C-xq": "eb"ef"" $endif
variable-
The variable construct provides simple equality tests for Readline
variables and values.
The permitted comparison operators are ‘=’, ‘==’, and ‘!=’.
The variable name must be separated from the comparison operator by
whitespace; the operator may be separated from the value on the right hand
side by whitespace.
Both string and boolean variables may be tested. Boolean variables must be
tested against the values on and off.
The following example is equivalent to themode=emacstest described
above:$if editing-mode == emacs set show-mode-in-prompt on $endif
$endif-
This command, as seen in the previous example, terminates an
$ifcommand. $else-
Commands in this branch of the
$ifdirective are executed if
the test fails. $include-
This directive takes a single filename as an argument and reads commands
and bindings from that file.
For example, the following directive reads from /etc/inputrc:
32.3.3 Sample Init File
Here is an example of an inputrc file. This illustrates key
binding, variable assignment, and conditional syntax.
# This file controls the behaviour of line input editing for
# programs that use the GNU Readline library. Existing
# programs include FTP, Bash, and GDB.
#
# You can re-read the inputrc file with C-x C-r.
# Lines beginning with '#' are comments.
#
# First, include any system-wide bindings and variable
# assignments from /etc/Inputrc
$include /etc/Inputrc
#
# Set various bindings for emacs mode.
set editing-mode emacs
$if mode=emacs
Meta-Control-h: backward-kill-word Text after the function name is ignored
#
# Arrow keys in keypad mode
#
#"M-OD": backward-char
#"M-OC": forward-char
#"M-OA": previous-history
#"M-OB": next-history
#
# Arrow keys in ANSI mode
#
"M-[D": backward-char
"M-[C": forward-char
"M-[A": previous-history
"M-[B": next-history
#
# Arrow keys in 8 bit keypad mode
#
#"M-C-OD": backward-char
#"M-C-OC": forward-char
#"M-C-OA": previous-history
#"M-C-OB": next-history
#
# Arrow keys in 8 bit ANSI mode
#
#"M-C-[D": backward-char
#"M-C-[C": forward-char
#"M-C-[A": previous-history
#"M-C-[B": next-history
C-q: quoted-insert
$endif
# An old-style binding. This happens to be the default.
TAB: complete
# Macros that are convenient for shell interaction
$if Bash
# edit the path
"C-xp": "PATH=${PATH}eC-eC-aefC-f"
# prepare to type a quoted word --
# insert open and close double quotes
# and move to just after the open quote
"C-x"": """C-b"
# insert a backslash (testing backslash escapes
# in sequences and macros)
"C-x\": "\"
# Quote the current or previous word
"C-xq": "eb"ef""
# Add a binding to refresh the line, which is unbound
"C-xr": redraw-current-line
# Edit variable on current line.
"M-C-v": "C-aC-k$C-yM-C-eC-aC-y="
$endif
# use a visible bell if one is available
set bell-style visible
# don't strip characters to 7 bits when reading
set input-meta on
# allow iso-latin1 characters to be inserted rather
# than converted to prefix-meta sequences
set convert-meta off
# display characters with the eighth bit set directly
# rather than as meta-prefixed characters
set output-meta on
# if there are 150 or more possible completions for a word,
# ask whether or not the user wants to see all of them
set completion-query-items 150
# For FTP
$if Ftp
"C-xg": "get M-?"
"C-xt": "put M-?"
"M-.": yank-last-arg
$endif
32.4 Bindable Readline Commands
This section describes Readline commands that may be bound to key
sequences.
Command names without an accompanying key sequence are unbound by default.
In the following descriptions, point refers to the current cursor
position, and mark refers to a cursor position saved by the
set-mark command.
The text between the point and mark is referred to as the region.
32.4.1 Commands For Moving
beginning-of-line (C-a)-
Move to the start of the current line.
end-of-line (C-e)-
Move to the end of the line.
forward-char (C-f)-
Move forward a character.
backward-char (C-b)-
Move back a character.
forward-word (M-f)-
Move forward to the end of the next word.
Words are composed of letters and digits. backward-word (M-b)-
Move back to the start of the current or previous word.
Words are composed of letters and digits. previous-screen-line ()-
Attempt to move point to the same physical screen column on the previous
physical screen line. This will not have the desired effect if the current
Readline line does not take up more than one physical line or if point is not
greater than the length of the prompt plus the screen width. next-screen-line ()-
Attempt to move point to the same physical screen column on the next
physical screen line. This will not have the desired effect if the current
Readline line does not take up more than one physical line or if the length
of the current Readline line is not greater than the length of the prompt
plus the screen width. clear-display (M-C-l)-
Clear the screen and, if possible, the terminal’s scrollback buffer,
then redraw the current line,
leaving the current line at the top of the screen. clear-screen (C-l)-
Clear the screen,
then redraw the current line,
leaving the current line at the top of the screen. redraw-current-line ()-
Refresh the current line. By default, this is unbound.
32.4.2 Commands For Manipulating The History
accept-line (Newline or Return)-
Accept the line regardless of where the cursor is.
If this line is
non-empty, it may be added to the history list for future recall with
add_history().
If this line is a modified history line, the history line is restored
to its original state. previous-history (C-p)-
Move ‘back’ through the history list, fetching the previous command.
next-history (C-n)-
Move ‘forward’ through the history list, fetching the next command.
beginning-of-history (M-<)-
Move to the first line in the history.
end-of-history (M->)-
Move to the end of the input history, i.e., the line currently
being entered. reverse-search-history (C-r)-
Search backward starting at the current line and moving ‘up’ through
the history as necessary. This is an incremental search.
This command sets the region to the matched text and activates the mark. forward-search-history (C-s)-
Search forward starting at the current line and moving ‘down’ through
the history as necessary. This is an incremental search.
This command sets the region to the matched text and activates the mark. non-incremental-reverse-search-history (M-p)-
Search backward starting at the current line and moving ‘up’
through the history as necessary using a non-incremental search
for a string supplied by the user.
The search string may match anywhere in a history line. non-incremental-forward-search-history (M-n)-
Search forward starting at the current line and moving ‘down’
through the history as necessary using a non-incremental search
for a string supplied by the user.
The search string may match anywhere in a history line. history-search-forward ()-
Search forward through the history for the string of characters
between the start of the current line and the point.
The search string must match at the beginning of a history line.
This is a non-incremental search.
By default, this command is unbound. history-search-backward ()-
Search backward through the history for the string of characters
between the start of the current line and the point.
The search string must match at the beginning of a history line.
This is a non-incremental search.
By default, this command is unbound. history-substring-search-forward ()-
Search forward through the history for the string of characters
between the start of the current line and the point.
The search string may match anywhere in a history line.
This is a non-incremental search.
By default, this command is unbound. history-substring-search-backward ()-
Search backward through the history for the string of characters
between the start of the current line and the point.
The search string may match anywhere in a history line.
This is a non-incremental search.
By default, this command is unbound. yank-nth-arg (M-C-y)-
Insert the first argument to the previous command (usually
the second word on the previous line) at point.
With an argument n,
insert the nth word from the previous command (the words
in the previous command begin with word 0). A negative argument
inserts the nth word from the end of the previous command.
Once the argument n is computed, the argument is extracted
as if the ‘!n’ history expansion had been specified. yank-last-arg (M-. or M-_)-
Insert last argument to the previous command (the last word of the
previous history entry).
With a numeric argument, behave exactly likeyank-nth-arg.
Successive calls toyank-last-argmove back through the history
list, inserting the last word (or the word specified by the argument to
the first call) of each line in turn.
Any numeric argument supplied to these successive calls determines
the direction to move through the history. A negative argument switches
the direction through the history (back or forward).
The history expansion facilities are used to extract the last argument,
as if the ‘!$’ history expansion had been specified. operate-and-get-next (C-o)-
Accept the current line for return to the calling application as if a
newline had been entered,
and fetch the next line relative to the current line from the history
for editing.
A numeric argument, if supplied, specifies the history entry to use instead
of the current line.
32.4.3 Commands For Changing Text
end-of-file (usually C-d)-
The character indicating end-of-file as set, for example, by
stty. If this character is read when there are no characters
on the line, and point is at the beginning of the line, Readline
interprets it as the end of input and returns EOF. delete-char (C-d)-
Delete the character at point. If this function is bound to the
same character as the tty EOF character, as C-d
commonly is, see above for the effects. backward-delete-char (Rubout)-
Delete the character behind the cursor. A numeric argument means
to kill the characters instead of deleting them. forward-backward-delete-char ()-
Delete the character under the cursor, unless the cursor is at the
end of the line, in which case the character behind the cursor is
deleted. By default, this is not bound to a key. quoted-insert (C-q or C-v)-
Add the next character typed to the line verbatim. This is
how to insert key sequences like C-q, for example. tab-insert (M-TAB)-
Insert a tab character.
self-insert (a, b, A, 1, !, …)-
Insert yourself.
bracketed-paste-begin ()-
This function is intended to be bound to the «bracketed paste» escape
sequence sent by some terminals, and such a binding is assigned by default.
It allows Readline to insert the pasted text as a single unit without treating
each character as if it had been read from the keyboard. The characters
are inserted as if each one was bound toself-insertinstead of
executing any editing commands.Bracketed paste sets the region (the characters between point and the mark)
to the inserted text. It uses the concept of an active mark: when the
mark is active, Readline redisplay uses the terminal’s standout mode to
denote the region. transpose-chars (C-t)-
Drag the character before the cursor forward over
the character at the cursor, moving the
cursor forward as well. If the insertion point
is at the end of the line, then this
transposes the last two characters of the line.
Negative arguments have no effect. transpose-words (M-t)-
Drag the word before point past the word after point,
moving point past that word as well.
If the insertion point is at the end of the line, this transposes
the last two words on the line. upcase-word (M-u)-
Uppercase the current (or following) word. With a negative argument,
uppercase the previous word, but do not move the cursor. downcase-word (M-l)-
Lowercase the current (or following) word. With a negative argument,
lowercase the previous word, but do not move the cursor. capitalize-word (M-c)-
Capitalize the current (or following) word. With a negative argument,
capitalize the previous word, but do not move the cursor. overwrite-mode ()-
Toggle overwrite mode. With an explicit positive numeric argument,
switches to overwrite mode. With an explicit non-positive numeric
argument, switches to insert mode. This command affects only
emacsmode;vimode does overwrite differently.
Each call toreadline()starts in insert mode.In overwrite mode, characters bound to
self-insertreplace
the text at point rather than pushing the text to the right.
Characters bound tobackward-delete-charreplace the character
before point with a space.By default, this command is unbound.
32.4.4 Killing And Yanking
kill-line (C-k)-
Kill the text from point to the end of the line.
With a negative numeric argument, kill backward from the cursor to the
beginning of the current line. backward-kill-line (C-x Rubout)-
Kill backward from the cursor to the beginning of the current line.
With a negative numeric argument, kill forward from the cursor to the
end of the current line. unix-line-discard (C-u)-
Kill backward from the cursor to the beginning of the current line.
kill-whole-line ()-
Kill all characters on the current line, no matter where point is.
By default, this is unbound. kill-word (M-d)-
Kill from point to the end of the current word, or if between
words, to the end of the next word.
Word boundaries are the same asforward-word. backward-kill-word (M-DEL)-
Kill the word behind point.
Word boundaries are the same asbackward-word. shell-transpose-words (M-C-t)-
Drag the word before point past the word after point,
moving point past that word as well.
If the insertion point is at the end of the line, this transposes
the last two words on the line.
Word boundaries are the same asshell-forward-wordand
shell-backward-word. unix-word-rubout (C-w)-
Kill the word behind point, using white space as a word boundary.
The killed text is saved on the kill-ring. unix-filename-rubout ()-
Kill the word behind point, using white space and the slash character
as the word boundaries.
The killed text is saved on the kill-ring. delete-horizontal-space ()-
Delete all spaces and tabs around point. By default, this is unbound.
kill-region ()-
Kill the text in the current region.
By default, this command is unbound. copy-region-as-kill ()-
Copy the text in the region to the kill buffer, so it can be yanked
right away. By default, this command is unbound. copy-backward-word ()-
Copy the word before point to the kill buffer.
The word boundaries are the same asbackward-word.
By default, this command is unbound. copy-forward-word ()-
Copy the word following point to the kill buffer.
The word boundaries are the same asforward-word.
By default, this command is unbound. yank (C-y)-
Yank the top of the kill ring into the buffer at point.
yank-pop (M-y)-
Rotate the kill-ring, and yank the new top. You can only do this if
the prior command isyankoryank-pop.
32.4.5 Specifying Numeric Arguments
digit-argument (M-0, M-1, … M--)-
Add this digit to the argument already accumulating, or start a new
argument. M-- starts a negative argument. universal-argument ()-
This is another way to specify an argument.
If this command is followed by one or more digits, optionally with a
leading minus sign, those digits define the argument.
If the command is followed by digits, executinguniversal-argument
again ends the numeric argument, but is otherwise ignored.
As a special case, if this command is immediately followed by a
character that is neither a digit nor minus sign, the argument count
for the next command is multiplied by four.
The argument count is initially one, so executing this function the
first time makes the argument count four, a second time makes the
argument count sixteen, and so on.
By default, this is not bound to a key.
32.4.6 Letting Readline Type For You
complete (TAB)-
Attempt to perform completion on the text before point.
The actual completion performed is application-specific.
The default is filename completion. possible-completions (M-?)-
List the possible completions of the text before point.
When displaying completions, Readline sets the number of columns used
for display to the value ofcompletion-display-width, the value of
the environment variableCOLUMNS, or the screen width, in that order. insert-completions (M-*)-
Insert all completions of the text before point that would have
been generated bypossible-completions. menu-complete ()-
Similar to
complete, but replaces the word to be completed
with a single match from the list of possible completions.
Repeated execution ofmenu-completesteps through the list
of possible completions, inserting each match in turn.
At the end of the list of completions, the bell is rung
(subject to the setting ofbell-style)
and the original text is restored.
An argument of n moves n positions forward in the list
of matches; a negative argument may be used to move backward
through the list.
This command is intended to be bound to TAB, but is unbound
by default. menu-complete-backward ()-
Identical to
menu-complete, but moves backward through the list
of possible completions, as ifmenu-completehad been given a
negative argument. delete-char-or-list ()-
Deletes the character under the cursor if not at the beginning or
end of the line (likedelete-char).
If at the end of the line, behaves identically to
possible-completions.
This command is unbound by default.
32.4.7 Keyboard Macros
start-kbd-macro (C-x ()-
Begin saving the characters typed into the current keyboard macro.
end-kbd-macro (C-x ))-
Stop saving the characters typed into the current keyboard macro
and save the definition. call-last-kbd-macro (C-x e)-
Re-execute the last keyboard macro defined, by making the characters
in the macro appear as if typed at the keyboard. print-last-kbd-macro ()-
Print the last keboard macro defined in a format suitable for the
inputrc file.
32.4.8 Some Miscellaneous Commands
re-read-init-file (C-x C-r)-
Read in the contents of the inputrc file, and incorporate
any bindings or variable assignments found there. abort (C-g)-
Abort the current editing command and
ring the terminal’s bell (subject to the setting of
bell-style). do-lowercase-version (M-A, M-B, M-x, …)-
If the metafied character x is upper case, run the command
that is bound to the corresponding metafied lower case character.
The behavior is undefined if x is already lower case. prefix-meta (ESC)-
Metafy the next character typed. This is for keyboards
without a meta key. Typing ‘ESC f’ is equivalent to typing
M-f. undo (C-_ or C-x C-u)-
Incremental undo, separately remembered for each line.
revert-line (M-r)-
Undo all changes made to this line. This is like executing the
undo
command enough times to get back to the beginning. tilde-expand (M-~)-
Perform tilde expansion on the current word.
set-mark (C-@)-
Set the mark to the point. If a
numeric argument is supplied, the mark is set to that position. exchange-point-and-mark (C-x C-x)-
Swap the point with the mark. The current cursor position is set to
the saved position, and the old cursor position is saved as the mark. character-search (C-])-
A character is read and point is moved to the next occurrence of that
character. A negative count searches for previous occurrences. character-search-backward (M-C-])-
A character is read and point is moved to the previous occurrence
of that character. A negative count searches for subsequent
occurrences. skip-csi-sequence ()-
Read enough characters to consume a multi-key sequence such as those
defined for keys like Home and End. Such sequences begin with a
Control Sequence Indicator (CSI), usually ESC-[. If this sequence is
bound to «e[«, keys producing such sequences will have no effect
unless explicitly bound to a readline command, instead of inserting
stray characters into the editing buffer. This is unbound by default,
but usually bound to ESC-[. insert-comment (M-#)-
Without a numeric argument, the value of the
comment-begin
variable is inserted at the beginning of the current line.
If a numeric argument is supplied, this command acts as a toggle: if
the characters at the beginning of the line do not match the value
ofcomment-begin, the value is inserted, otherwise
the characters incomment-beginare deleted from the beginning of
the line.
In either case, the line is accepted as if a newline had been typed. dump-functions ()-
Print all of the functions and their key bindings to the
Readline output stream. If a numeric argument is supplied,
the output is formatted in such a way that it can be made part
of an inputrc file. This command is unbound by default. dump-variables ()-
Print all of the settable variables and their values to the
Readline output stream. If a numeric argument is supplied,
the output is formatted in such a way that it can be made part
of an inputrc file. This command is unbound by default. dump-macros ()-
Print all of the Readline key sequences bound to macros and the
strings they output. If a numeric argument is supplied,
the output is formatted in such a way that it can be made part
of an inputrc file. This command is unbound by default. emacs-editing-mode (C-e)-
When in
vicommand mode, this causes a switch toemacs
editing mode. vi-editing-mode (M-C-j)-
When in
emacsediting mode, this causes a switch tovi
editing mode.
32.5 Readline vi Mode
While the Readline library does not have a full set of vi
editing functions, it does contain enough to allow simple editing
of the line. The Readline vi mode behaves as specified in
the POSIX standard.
In order to switch interactively between emacs and vi
editing modes, use the command M-C-j (bound to emacs-editing-mode
when in vi mode and to vi-editing-mode in emacs mode).
The Readline default is emacs mode.
When you enter a line in vi mode, you are already placed in
‘insertion’ mode, as if you had typed an ‘i’. Pressing ESC
switches you into ‘command’ mode, where you can edit the text of the
line with the standard vi movement keys, move to previous
history lines with ‘k’ and subsequent lines with ‘j’, and
so forth.
33 Using History Interactively
This chapter describes how to use the GNU History Library interactively,
from a user’s standpoint. It should be considered a user’s guide. For
information on using the GNU History Library in your own programs,
see Programming with GNU History in GNU History Library.
33.1 History Expansion
The History library provides a history expansion feature that is similar
to the history expansion provided by csh. This section
describes the syntax used to manipulate the history information.
History expansions introduce words from the history list into
the input stream, making it easy to repeat commands, insert the
arguments to a previous command into the current input line, or
fix errors in previous commands quickly.
History expansion takes place in two parts. The first is to determine
which line from the history list should be used during substitution.
The second is to select portions of that line for inclusion into the
current one. The line selected from the history is called the
event, and the portions of that line that are acted upon are
called words. Various modifiers are available to manipulate
the selected words. The line is broken into words in the same fashion
that Bash does, so that several words
surrounded by quotes are considered one word.
History expansions are introduced by the appearance of the
history expansion character, which is ‘!’ by default.
History expansion implements shell-like quoting conventions:
a backslash can be used to remove the special handling for the next character;
single quotes enclose verbatim sequences of characters, and can be used to
inhibit history expansion;
and characters enclosed within double quotes may be subject to history
expansion, since backslash can escape the history expansion character,
but single quotes may not, since they are not treated specially within
double quotes.
33.1.1 Event Designators
An event designator is a reference to a command line entry in the
history list.
Unless the reference is absolute, events are relative to the current
position in the history list.
!-
Start a history substitution, except when followed by a space, tab,
the end of the line, or ‘=’. !n-
Refer to command line n.
!-n-
Refer to the command n lines back.
!!-
Refer to the previous command. This is a synonym for ‘!-1’.
!string-
Refer to the most recent command
preceding the current position in the history list
starting with string. !?string[?]-
Refer to the most recent command
preceding the current position in the history list
containing string.
The trailing
‘?’ may be omitted if the string is followed immediately by
a newline.
If string is missing, the string from the most recent search is used;
it is an error if there is no previous search string. ^string1^string2^-
Quick Substitution. Repeat the last command, replacing string1
with string2. Equivalent to
!!:s^string1^string2^. !#-
The entire command line typed so far.
33.1.2 Word Designators
Word designators are used to select desired words from the event.
A ‘:’ separates the event specification from the word designator. It
may be omitted if the word designator begins with a ‘^’, ‘$’,
‘*’, ‘—’, or ‘%’. Words are numbered from the beginning
of the line, with the first word being denoted by 0 (zero). Words are
inserted into the current line separated by single spaces.
For example,
!!-
designates the preceding command. When you type this, the preceding
command is repeated in toto. !!:$-
designates the last argument of the preceding command. This may be
shortened to!$. !fi:2-
designates the second argument of the most recent command starting with
the lettersfi.
Here are the word designators:
0 (zero)-
The
0th word. For many applications, this is the command word. n-
The nth word.
^-
The first argument; that is, word 1.
$-
The last argument.
%-
The first word matched by the most recent ‘?string?’ search,
if the search string begins with a character that is part of a word. x-y-
A range of words; ‘—y’ abbreviates ‘0-y’.
*-
All of the words, except the
0th. This is a synonym for ‘1-$’.
It is not an error to use ‘*’ if there is just one word in the event;
the empty string is returned in that case. x*-
Abbreviates ‘x-$’
x--
Abbreviates ‘x-$’ like ‘x*’, but omits the last word.
If ‘x’ is missing, it defaults to 0.
If a word designator is supplied without an event specification, the
previous command is used as the event.
33.1.3 Modifiers
After the optional word designator, you can add a sequence of one or more
of the following modifiers, each preceded by a ‘:’.
These modify, or edit, the word or words selected from the history event.
h-
Remove a trailing pathname component, leaving only the head.
t-
Remove all leading pathname components, leaving the tail.
r-
Remove a trailing suffix of the form ‘.suffix’, leaving
the basename. e-
Remove all but the trailing suffix.
p-
Print the new command but do not execute it.
s/old/new/-
Substitute new for the first occurrence of old in the
event line.
Any character may be used as the delimiter in place of ‘/’.
The delimiter may be quoted in old and new
with a single backslash. If ‘&’ appears in new,
it is replaced by old. A single backslash will quote
the ‘&’.
If old is null, it is set to the last old
substituted, or, if no previous history substitutions took place,
the last string
in a !?string[?]
search.
If new is is null, each matching old is deleted.
The final delimiter is optional if it is the last
character on the input line. &-
Repeat the previous substitution.
ga-
Cause changes to be applied over the entire event line. Used in
conjunction with ‘s’, as ings/old/new/,
or with ‘&’. G-
Apply the following ‘s’ or ‘&’ modifier once to each word
in the event.
Appendix A In Memoriam
The GDB project mourns the loss of the following long-time
contributors:
Fred Fish-
Fred was a long-standing contributor to GDB (1991-2006), and
to Free Software in general. Outside of GDB, he was known in
the Amiga world for his series of Fish Disks, and the GeekGadget project. Michael Snyder-
Michael was one of the Global Maintainers of the GDB project,
with contributions recorded as early as 1996, until 2011. In addition
to his day to day participation, he was a large driving force behind
adding Reverse Debugging to GDB.
Beyond their technical contributions to the project, they were also
enjoyable members of the Free Software Community. We will miss them.
Appendix B Formatting Documentation
The GDB 4 release includes an already-formatted reference card, ready
for printing with PostScript or Ghostscript, in the gdb
subdirectory of the main source directory21. If you can use PostScript or Ghostscript with your printer,
you can print the reference card immediately with refcard.ps.
The release also includes the source for the reference card. You
can format it, using TeX, by typing:
The GDB reference card is designed to print in landscape
mode on US “letter” size paper;
that is, on a sheet 11 inches wide by 8.5 inches
high. You will need to specify this form of printing as an option to
your DVI output program.
All the documentation for GDB comes as part of the machine-readable
distribution. The documentation is written in Texinfo format, which is
a documentation system that uses a single source file to produce both
on-line information and a printed manual. You can use one of the Info
formatting commands to create the on-line version of the documentation
and TeX (or texi2roff) to typeset the printed version.
GDB includes an already formatted copy of the on-line Info
version of this manual in the gdb subdirectory. The main Info
file is gdb-13.1.90.20230516-git/gdb/gdb.info, and it refers to
subordinate files matching ‘gdb.info*’ in the same directory. If
necessary, you can print out these files, or read them with any editor;
but they are easier to read using the info subsystem in GNU
Emacs or the standalone info program, available as part of the
GNU Texinfo distribution.
If you want to format these Info files yourself, you need one of the
Info formatting programs, such as texinfo-format-buffer or
makeinfo.
If you have makeinfo installed, and are in the top level
GDB source directory (gdb-13.1.90.20230516-git, in the case of
version 13.1.90.20230516-git), you can make the Info file by typing:
If you want to typeset and print copies of this manual, you need TeX,
a program to print its DVI output files, and texinfo.tex, the
Texinfo definitions file.
TeX is a typesetting program; it does not print files directly, but
produces output files called DVI files. To print a typeset
document, you need a program to print DVI files. If your system
has TeX installed, chances are it has such a program. The precise
command to use depends on your system; lpr -d is common; another
(for PostScript devices) is dvips. The DVI print command may
require a file name without any extension or a ‘.dvi’ extension.
TeX also requires a macro definitions file called
texinfo.tex. This file tells TeX how to typeset a document
written in Texinfo format. On its own, TeX cannot either read or
typeset a Texinfo file. texinfo.tex is distributed with GDB
and is located in the gdb-version-number/texinfo
directory.
If you have TeX and a DVI printer program installed, you can
typeset and print this manual. First switch to the gdb
subdirectory of the main source directory (for example, to
gdb-13.1.90.20230516-git/gdb) and type:
Then give gdb.dvi to your DVI printing program.
Appendix C Installing GDB
C.1 Requirements for Building GDB
Building GDB requires various tools and packages to be available.
Other packages will be used only if they are found.
Tools/Packages Necessary for Building GDB
- C++11 compiler
-
GDB is written in C++11. It should be buildable with any
recent C++11 compiler, e.g. GCC. - GNU make
-
GDB’s build system relies on features only found in the GNU
make program. Other variants ofmakewill not work. - GMP (The GNU Multiple Precision Arithmetic Library)
-
GDB now uses GMP to perform some of its arithmetics.
This library may be included with your operating system distribution;
if it is not, you can get the latest version from
https://gmplib.org/. If GMP is installed at an unusual path,
you can use the —with-libgmp-prefix option to specify
its location.
Tools/Packages Optional for Building GDB
- Expat
-
GDB can use the Expat XML parsing library. This library may be
included with your operating system distribution; if it is not, you
can get the latest version from http://expat.sourceforge.net.
The configure script will search for this library in several
standard locations; if it is installed in an unusual path, you can
use the —with-libexpat-prefix option to specify its location.Expat is used for:
- Remote protocol memory maps (see Memory Map Format)
- Target descriptions (see Target Descriptions)
- Remote shared library lists (See Library List Format,
or alternatively see Library List Format for SVR4 Targets) - MS-Windows shared libraries (see Shared Libraries)
- Traceframe info (see Traceframe Info Format)
- Branch trace (see Branch Trace Format,
see Branch Trace Configuration Format)
- Guile
-
GDB can be scripted using GNU Guile. See Guile. By
default, GDB will be compiled if the Guile libraries are
installed and are found by configure. You can use the
--with-guileoption to request Guile, and pass either the Guile
version number or the file name of the relevantpkg-config
program to choose a particular version of Guile. - iconv
-
GDB’s features related to character sets (see Character Sets) require a functioning
iconvimplementation. If you are
on a GNU system, then this is provided by the GNU C Library. Some
other systems also provide a workingiconv.If GDB is using the
iconvprogram which is installed
in a non-standard place, you will need to tell GDB where to
find it. This is done with —with-iconv-bin which specifies
the directory that contains theiconvprogram. This program is
run in order to make a list of the available character sets.On systems without
iconv, you can install GNU Libiconv. If
Libiconv is installed in a standard place, GDB will
automatically use it if it is needed. If you have previously
installed Libiconv in a non-standard place, you can use the
—with-libiconv-prefix option to configure.GDB’s top-level configure and Makefile will
arrange to build Libiconv if a directory named libiconv appears
in the top-most source directory. If Libiconv is built this way, and
if the operating system does not provide a suitableiconv
implementation, then the just-built library will automatically be used
by GDB. One easy way to set this up is to download GNU
Libiconv, unpack it inside the top-level directory of the GDB
source tree, and then rename the directory holding the Libiconv source
code to ‘libiconv’. - lzma
-
GDB can support debugging sections that are compressed with
the LZMA library. See MiniDebugInfo. If this library is not
included with your operating system, you can find it in the xz package
at http://tukaani.org/xz/. If the LZMA library is available in
the usual place, then the configure script will use it
automatically. If it is installed in an unusual path, you can use the
—with-liblzma-prefix option to specify its location. - MPFR
-
GDB can use the GNU MPFR multiple-precision floating-point
library. This library may be included with your operating system
distribution; if it is not, you can get the latest version from
http://www.mpfr.org. The configure script will search
for this library in several standard locations; if it is installed
in an unusual path, you can use the —with-libmpfr-prefix
option to specify its location.GNU MPFR is used to emulate target floating-point arithmetic during
expression evaluation when the target uses different floating-point
formats than the host. If GNU MPFR it is not available, GDB
will fall back to using host floating-point arithmetic. - Python
-
GDB can be scripted using Python language. See Python.
By default, GDB will be compiled if the Python libraries are
installed and are found by configure. You can use the
--with-pythonoption to request Python, and pass either the
file name of the relevantpythonexecutable, or the name of the
directory in which Python is installed, to choose a particular
installation of Python. - zlib
-
GDB will use the ‘zlib’ library, if available, to read
compressed debug sections. Some linkers, such as GNU gold, are capable
of producing binaries with compressed debug sections. If GDB
is compiled with ‘zlib’, it will be able to read the debug
information in such binaries.The ‘zlib’ library is likely included with your operating system
distribution; if it is not, you can get the latest version from
http://zlib.net.
C.2 Invoking the GDB configure Script
GDB comes with a configure script that automates the process
of preparing GDB for installation; you can then use make to
build the gdb program.
The GDB distribution includes all the source code you need for
GDB in a single directory, whose name is usually composed by
appending the version number to ‘gdb’.
For example, the GDB version 13.1.90.20230516-git distribution is in the
gdb-13.1.90.20230516-git directory. That directory contains:
gdb-13.1.90.20230516-git/configure (and supporting files)-
script for configuring GDB and all its supporting libraries
gdb-13.1.90.20230516-git/gdb-
the source specific to GDB itself
gdb-13.1.90.20230516-git/bfd-
source for the Binary File Descriptor library
gdb-13.1.90.20230516-git/include-
GNU include files
gdb-13.1.90.20230516-git/libiberty-
source for the ‘-liberty’ free software library
gdb-13.1.90.20230516-git/opcodes-
source for the library of opcode tables and disassemblers
gdb-13.1.90.20230516-git/readline-
source for the GNU command-line interface
There may be other subdirectories as well.
The simplest way to configure and build GDB is to run configure
from the gdb-version-number source directory, which in
this example is the gdb-13.1.90.20230516-git directory.
First switch to the gdb-version-number source directory
if you are not already in it; then run configure. Pass the
identifier for the platform on which GDB will run as an
argument.
For example:
cd gdb-13.1.90.20230516-git ./configure make
Running ‘configure’ and then running make builds the
included supporting libraries, then gdb itself. The configured
source files, and the binaries, are left in the corresponding source
directories.
configure is a Bourne-shell (/bin/sh) script; if your
system does not recognize this automatically when you run a different
shell, you may need to run sh on it explicitly:
You should run the configure script from the top directory in the
source tree, the gdb-version-number directory. If you run
configure from one of the subdirectories, you will configure only
that subdirectory. That is usually not what you want. In particular,
if you run the first configure from the gdb subdirectory
of the gdb-version-number directory, you will omit the
configuration of bfd, readline, and other sibling
directories of the gdb subdirectory. This leads to build errors
about missing include files such as bfd/bfd.h.
You can install GDB anywhere. The best way to do this
is to pass the --prefix option to configure, and then
install it with make install.
C.3 Compiling GDB in Another Directory
If you want to run GDB versions for several host or target machines,
you need a different gdb compiled for each combination of
host and target. configure is designed to make this easy by
allowing you to generate each configuration in a separate subdirectory,
rather than in the source directory. If your make program
handles the ‘VPATH’ feature (GNU make does), running
make in each of these directories builds the gdb
program specified there.
To build gdb in a separate directory, run configure
with the ‘—srcdir’ option to specify where to find the source.
(You also need to specify a path to find configure
itself from your working directory. If the path to configure
would be the same as the argument to ‘—srcdir’, you can leave out
the ‘—srcdir’ option; it is assumed.)
For example, with version 13.1.90.20230516-git, you can build GDB in a
separate directory for a Sun 4 like this:
cd gdb-13.1.90.20230516-git mkdir ../gdb-sun4 cd ../gdb-sun4 ../gdb-13.1.90.20230516-git/configure make
When configure builds a configuration using a remote source
directory, it creates a tree for the binaries with the same structure
(and using the same names) as the tree under the source directory. In
the example, you’d find the Sun 4 library libiberty.a in the
directory gdb-sun4/libiberty, and GDB itself in
gdb-sun4/gdb.
Make sure that your path to the configure script has just one
instance of gdb in it. If your path to configure looks
like ../gdb-13.1.90.20230516-git/gdb/configure, you are configuring only
one subdirectory of GDB, not the whole package. This leads to
build errors about missing include files such as bfd/bfd.h.
One popular reason to build several GDB configurations in separate
directories is to configure GDB for cross-compiling (where
GDB runs on one machine—the host—while debugging
programs that run on another machine—the target).
You specify a cross-debugging target by
giving the ‘—target=target’ option to configure.
When you run make to build a program or library, you must run
it in a configured directory—whatever directory you were in when you
called configure (or one of its subdirectories).
The Makefile that configure generates in each source
directory also runs recursively. If you type make in a source
directory such as gdb-13.1.90.20230516-git (or in a separate configured
directory configured with ‘—srcdir=dirname/gdb-13.1.90.20230516-git’), you
will build all the required libraries, and then build GDB.
When you have multiple hosts or targets configured in separate
directories, you can run make on them in parallel (for example,
if they are NFS-mounted on each of the hosts); they will not interfere
with each other.
C.4 Specifying Names for Hosts and Targets
The specifications used for hosts and targets in the configure
script are based on a three-part naming scheme, but some short predefined
aliases are also supported. The full naming scheme encodes three pieces
of information in the following pattern:
For example, you can use the alias sun4 as a host argument,
or as the value for target in a --target=target
option. The equivalent full name is ‘sparc-sun-sunos4’.
The configure script accompanying GDB does not provide
any query facility to list all supported host and target names or
aliases. configure calls the Bourne shell script
config.sub to map abbreviations to full names; you can read the
script, if you wish, or you can use it to test your guesses on
abbreviations—for example:
% sh config.sub i386-linux i386-pc-linux-gnu % sh config.sub alpha-linux alpha-unknown-linux-gnu % sh config.sub hp9k700 hppa1.1-hp-hpux % sh config.sub sun4 sparc-sun-sunos4.1.1 % sh config.sub sun3 m68k-sun-sunos4.1.1 % sh config.sub i986v Invalid configuration `i986v': machine `i986v' not recognized
config.sub is also distributed in the GDB source
directory (gdb-13.1.90.20230516-git, for version 13.1.90.20230516-git).
C.5 configure Options
Here is a summary of the configure options and arguments that
are most often useful for building GDB. configure
also has several other options not listed here. See (autoconf)Running
configure Scripts, for a full
explanation of configure.
configure [--help] [--prefix=dir] [--exec-prefix=dir] [--srcdir=dirname] [--target=target]
You may introduce options with a single ‘—’ rather than
‘—’ if you prefer; but you may abbreviate option names if you use
‘—’.
--help-
Display a quick summary of how to invoke configure.
--prefix=dir-
Configure the source to install programs and files under directory
dir. --exec-prefix=dir-
Configure the source to install programs under directory
dir. --srcdir=dirname-
Use this option to make configurations in directories separate from the
GDB source directories. Among other things, you can use this to
build (or maintain) several configurations simultaneously, in separate
directories. configure writes configuration-specific files in
the current directory, but arranges for them to use the source in the
directory dirname. configure creates directories under
the working directory in parallel to the source directories below
dirname. --target=target-
Configure GDB for cross-debugging programs running on the specified
target. Without this option, GDB is configured to debug
programs that run on the same machine (host) as GDB itself.There is no convenient way to generate a list of all available
targets. Also see the--enable-targetsoption, below.
There are many other options that are specific to GDB. This
lists just the most common ones; there are some very specialized
options not described here.
--enable-targets=[target]…--enable-targets=all-
Configure GDB for cross-debugging programs running on the
specified list of targets. The special value ‘all’ configures
GDB for debugging programs running on any target it supports. --with-gdb-datadir=path-
Set the GDB-specific data directory. GDB will look
here for certain supporting files or scripts. This defaults to the
gdb subdirectory of ‘datadir’ (which can be set using
--datadir). --with-relocated-sources=dir-
Sets up the default source path substitution rule so that directory
names recorded in debug information will be automatically adjusted for
any directory under dir. dir should be a subdirectory of
GDB’s configured prefix, the one mentioned in the
--prefixor--exec-prefixoptions to configure. This
option is useful if GDB is supposed to be moved to a different place
after it is built. --enable-64-bit-bfd-
Enable 64-bit support in BFD on 32-bit hosts.
--disable-gdbmi-
Build GDB without the GDB/MI machine interface
(see GDB/MI). --enable-tui-
Build GDB with the text-mode full-screen user interface
(TUI). Requires a curses library (ncurses and cursesX are also
supported). --with-curses-
Use the curses library instead of the termcap library, for text-mode
terminal operations. --with-debuginfod-
Build GDB with libdebuginfod, the
debuginfodclient
library. Used to automatically fetch ELF, DWARF and source files from
debuginfodservers using build IDs associated with any missing
files. Enabled by default if libdebuginfod is installed and found
at configure time. For more information regardingdebuginfodsee
Debuginfod. --with-libunwind-ia64-
Use the libunwind library for unwinding function call stack on ia64
target platforms. See http://www.nongnu.org/libunwind/index.html for
details. --with-system-readline-
Use the readline library installed on the host, rather than the
library supplied as part of GDB. Readline 7 or newer is
required; this is enforced by the build system. --with-system-zlib-
Use the zlib library installed on the host, rather than the library
supplied as part of GDB. --with-expat-
Build GDB with Expat, a library for XML parsing. (Done by
default if libexpat is installed and found at configure time.) This
library is used to read XML files supplied with GDB. If it
is unavailable, some features, such as remote protocol memory maps,
target descriptions, and shared library lists, that are based on XML
files, will not be available in GDB. If your host does not
have libexpat installed, you can get the latest version from
‘http://expat.sourceforge.net’. --with-libiconv-prefix[=dir]-
Build GDB with GNU libiconv, a character set encoding
conversion library. This is not done by default, as on GNU systems
theiconvthat is built in to the C library is sufficient. If
your host does not have a workingiconv, you can get the latest
version of GNU iconv from ‘https://www.gnu.org/software/libiconv/’.GDB’s build system also supports building GNU libiconv as
part of the overall build. See Requirements. --with-lzma-
Build GDB with LZMA, a compression library. (Done by default
if liblzma is installed and found at configure time.) LZMA is used by
GDB’s «mini debuginfo» feature, which is only useful on
platforms using the ELF object file format. If your host does not
have liblzma installed, you can get the latest version from
‘https://tukaani.org/xz/’. --with-mpfr-
Build GDB with GNU MPFR, a library for multiple-precision
floating-point computation with correct rounding. (Done by default if
GNU MPFR is installed and found at configure time.) This library is
used to emulate target floating-point arithmetic during expression
evaluation when the target uses different floating-point formats than
the host. If GNU MPFR is not available, GDB will fall back
to using host floating-point arithmetic. If your host does not have
GNU MPFR installed, you can get the latest version from
‘http://www.mpfr.org’. --with-python[=python]-
Build GDB with Python scripting support. (Done by default if
libpython is present and found at configure time.) Python makes
GDB scripting much more powerful than the restricted CLI
scripting language. If your host does not have Python installed, you
can find it on ‘http://www.python.org/download/’. The oldest version
of Python supported by GDB is 2.6. The optional argument python
is used to find the Python headers and libraries. It can be either
the name of a Python executable, or the name of the directory in which
Python is installed. --with-guile[=GUILE]'-
Build GDB with GNU Guile scripting support. (Done by default
if libguile is present and found at configure time.) If your host
does not have Guile installed, you can find it at
‘https://www.gnu.org/software/guile/’. The optional argument GUILE
can be a version number, which will causeconfigureto try to
use that version of Guile; or the file name of apkg-config
executable, which will be queried to find the information needed to
compile and link against Guile. --without-included-regex-
Don’t use the regex library included with GDB (as part of the
libiberty library). This is the default on hosts with version 2 of
the GNU C library. --with-sysroot=dir-
Use dir as the default system root directory for libraries whose
file names begin with /lib’ or /usr/lib’. (The value of
dir can be modified at run time by using thesetcommand.) If dir is under the GDB configured
sysroot
prefix (set with--prefixor--exec-prefix options, the
default system root will be automatically adjusted if and when
GDB is moved to a different location. --with-system-gdbinit=file-
Configure GDB to automatically load a system-wide init file.
file should be an absolute file name. If file is in a
directory under the configured prefix, and GDB is moved to
another location after being built, the location of the system-wide
init file will be adjusted accordingly. --with-system-gdbinit-dir=directory-
Configure GDB to automatically load init files from a
system-wide directory. directory should be an absolute directory
name. If directory is in a directory under the configured
prefix, and GDB is moved to another location after being
built, the location of the system-wide init directory will be
adjusted accordingly. --enable-build-warnings-
When building the GDB sources, ask the compiler to warn about
any code which looks even vaguely suspicious. It passes many
different warning flags, depending on the exact version of the
compiler you are using. --enable-werror-
Treat compiler warnings as errors. It adds the
-Werrorflag
to the compiler, which will fail the compilation if the compiler
outputs any warning messages. --enable-ubsan-
Enable the GCC undefined behavior sanitizer. This is disabled by
default, but passing--enable-ubsan=yesor
--enable-ubsan=autotoconfigurewill enable it. The
undefined behavior sanitizer checks for C++ undefined behavior.
It has a performance cost, so if you are looking at GDB’s
performance, you should disable it. The undefined behavior sanitizer
was first introduced in GCC 4.9.
C.6 System-wide configuration and settings
GDB can be configured to have a system-wide init file and a
system-wide init file directory; this file and files in that directory
(if they have a recognized file extension) will be read and executed at
startup (see What GDB does during startup).
Here are the corresponding configure options:
--with-system-gdbinit=file-
Specify that the default location of the system-wide init file is
file. --with-system-gdbinit-dir=directory-
Specify that the default location of the system-wide init file directory
is directory.
If GDB has been configured with the option —prefix=$prefix,
they may be subject to relocation. Two possible cases:
- If the default location of this init file/directory contains $prefix,
it will be subject to relocation. Suppose that the configure options
are —prefix=$prefix —with-system-gdbinit=$prefix/etc/gdbinit;
if GDB is moved from $prefix to $install, the system
init file is looked for as $install/etc/gdbinit instead of
$prefix/etc/gdbinit. - By contrast, if the default location does not contain the prefix,
it will not be relocated. E.g. if GDB has been configured with
—prefix=/usr/local —with-system-gdbinit=/usr/share/gdb/gdbinit,
then GDB will always look for /usr/share/gdb/gdbinit,
wherever GDB is installed.
If the configured location of the system-wide init file (as given by the
—with-system-gdbinit option at configure time) is in the
data-directory (as specified by —with-gdb-datadir at configure
time) or in one of its subdirectories, then GDB will look for the
system-wide init file in the directory specified by the
—data-directory command-line option.
Note that the system-wide init file is only read once, during GDB
initialization. If the data-directory is changed after GDB has
started with the set data-directory command, the file will not be
reread.
This applies similarly to the system-wide directory specified in
—with-system-gdbinit-dir.
Any supported scripting language can be used for these init files, as long
as the file extension matches the scripting language. To be interpreted
as regular GDB commands, the files needs to have a .gdb
extension.
C.6.1 Installed System-wide Configuration Scripts
The system-gdbinit directory, located inside the data-directory
(as specified by —with-gdb-datadir at configure time) contains
a number of scripts which can be used as system-wide init files. To
automatically source those scripts at startup, GDB should be
configured with —with-system-gdbinit. Otherwise, any user
should be able to source them by hand as needed.
The following scripts are currently available:
- elinos.py
This script is useful when debugging a program on an ELinOS target.
It takes advantage of the environment variables defined in a standard
ELinOS environment in order to determine the location of the system
shared libraries, and then sets the ‘solib-absolute-prefix’
and ‘solib-search-path’ variables appropriately. - wrs-linux.py
This script is useful when debugging a program on a target running
Wind River Linux. It expects theENV_PREFIXto be set to
the host-side sysroot used by the target system.
Appendix D Maintenance Commands
In addition to commands intended for GDB users, GDB
includes a number of commands intended for GDB developers,
that are not documented elsewhere in this manual. These commands are
provided here for reference. (For commands that turn on debugging
messages, see Debugging Output.)
maint agent [-at linespec,] expressionmaint agent-eval [-at linespec,] expression-
Translate the given expression into remote agent bytecodes.
This command is useful for debugging the Agent Expression mechanism
(see Agent Expressions). The ‘agent’ version produces an
expression useful for data collection, such as by tracepoints, while
‘maint agent-eval’ produces an expression that evaluates directly
to a result. For instance, a collection expression forgloba +will include bytecodes to record four bytes of memory at each
globb
of the addresses ofglobaandglobb, while discarding
the result of the addition, while an evaluation expression will do the
addition and return the sum.
If-atis given, generate remote agent bytecode for all the
addresses to which linespec resolves (see Linespec Locations).
If not, generate remote agent bytecode for current frame PC address. maint agent-printf format,expr,...-
Translate the given format string and list of argument expressions
into remote agent bytecodes and display them as a disassembled list.
This command is useful for debugging the agent version of dynamic
printf (see Dynamic Printf). maint info breakpoints-
Using the same format as ‘info breakpoints’, display both the
breakpoints you’ve set explicitly, and those GDB is using for
internal purposes. Internal breakpoints are shown with negative
breakpoint numbers. The type column identifies what kind of breakpoint
is shown:breakpoint-
Normal, explicitly set breakpoint.
watchpoint-
Normal, explicitly set watchpoint.
longjmp-
Internal breakpoint, used to handle correctly stepping through
longjmpcalls. longjmp resume-
Internal breakpoint at the target of a
longjmp. until-
Temporary internal breakpoint used by the GDB
untilcommand. finish-
Temporary internal breakpoint used by the GDB
finishcommand. shlib events-
Shared library events.
maint info btrace-
Pint information about raw branch tracing data.
maint btrace packet-history-
Print the raw branch trace packets that are used to compute the
execution history for the ‘record btrace’ command. Both the
information and the format in which it is printed depend on the btrace
recording format.bts-
For the BTS recording format, print a list of blocks of sequential
code. For each block, the following information is printed:- Block number
-
Newer blocks have higher numbers. The oldest block has number zero.
- Lowest ‘PC’
- Highest ‘PC’
pt-
For the Intel Processor Trace recording format, print a list of
Intel Processor Trace packets. For each packet, the following
information is printed:- Packet number
-
Newer packets have higher numbers. The oldest packet has number zero.
- Trace offset
-
The packet’s offset in the trace stream.
- Packet opcode and payload
maint btrace clear-packet-history-
Discards the cached packet history printed by the ‘maint btrace
packet-history’ command. The history will be computed again when
needed. maint btrace clear-
Discard the branch trace data. The data will be fetched anew and the
branch trace will be recomputed when needed.This implicitly truncates the branch trace to a single branch trace
buffer. When updating branch trace incrementally, the branch trace
available to GDB may be bigger than a single branch trace
buffer. maint set btrace pt skip-padmaint show btrace pt skip-pad-
Control whether GDB will skip PAD packets when computing the
packet history. maint info jit-
Print information about JIT code objects loaded in the current inferior.
maint info python-disassemblers-
This command is defined within the
gdb.disassemblerPython
module (see Disassembly In Python), and will only be present after
that module has been imported. To force the module to be imported do
the following:(gdb) python import gdb.disassembler
This command lists all the architectures for which a disassembler is
currently registered, and the name of the disassembler. If a
disassembler is registered for all architectures, then this is listed
last against the ‘GLOBAL’ architecture.If one of the disassemblers would be selected for the architecture of
the current inferior, then this disassembler will be marked.The following example shows a situation in which two disassemblers are
registered, initially the ‘i386’ disassembler matches the current
architecture, then the architecture is changed, now the ‘GLOBAL’
disassembler matches.(gdb) show architecture The target architecture is set to "auto" (currently "i386"). (gdb) maint info python-disassemblers Architecture Disassember Name i386 Disassembler_1 (Matches current architecture) GLOBAL Disassembler_2
(gdb) set architecture arm The target architecture is set to "arm". (gdb) maint info python-disassemblers quit Architecture Disassember Name i386 Disassembler_1 GLOBAL Disassembler_2 (Matches current architecture)
set displaced-steppingshow displaced-stepping-
Control whether or not GDB will do displaced stepping
if the target supports it. Displaced stepping is a way to single-step
over breakpoints without removing them from the inferior, by executing
an out-of-line copy of the instruction that was originally at the
breakpoint location. It is also known as out-of-line single-stepping.set displaced-stepping on-
If the target architecture supports it, GDB will use
displaced stepping to step over breakpoints. set displaced-stepping off-
GDB will not use displaced stepping to step over breakpoints,
even if such is supported by the target architecture. set displaced-stepping auto-
This is the default mode. GDB will use displaced stepping
only if non-stop mode is active (see Non-Stop Mode) and the target
architecture supports displaced stepping.
maint check-psymtabs-
Check the consistency of currently expanded psymtabs versus symtabs.
Use this to check, for example, whether a symbol is in one but not the other. maint check-symtabs-
Check the consistency of currently expanded symtabs.
maint expand-symtabs [regexp]-
Expand symbol tables.
If regexp is specified, only expand symbol tables for file
names matching regexp. maint set catch-demangler-crashes [on|off]maint show catch-demangler-crashes-
Control whether GDB should attempt to catch crashes in the
symbol name demangler. The default is to attempt to catch crashes.
If enabled, the first time a crash is caught, a core file is created,
the offending symbol is displayed and the user is presented with the
option to terminate the current session. maint cplus first_component name-
Print the first C++ class/namespace component of name.
maint cplus namespace-
Print the list of possible C++ namespaces.
maint deprecate command [replacement]maint undeprecate command-
Deprecate or undeprecate the named command. Deprecated commands
cause GDB to issue a warning when you use them. The optional
argument replacement says which newer command should be used in
favor of the deprecated one; if it is given, GDB will mention
the replacement as part of the warning. maint dump-me-
Cause a fatal signal in the debugger and force it to dump its core.
This is supported only on systems which support aborting a program
with theSIGQUITsignal. maint internal-error [message-text]maint internal-warning [message-text]maint demangler-warning [message-text]-
Cause GDB to call the internal function
internal_error,
internal_warningordemangler_warningand hence behave
as though an internal problem has been detected. In addition to
reporting the internal problem, these functions give the user the
opportunity to either quit GDB or (forinternal_error
andinternal_warning) create a core file of the current
GDB session.These commands take an optional parameter message-text that is
used as the text of the error or warning message.Here’s an example of using
internal-error:(gdb) maint internal-error testing, 1, 2 …/maint.c:121: internal-error: testing, 1, 2 A problem internal to GDB has been detected. Further debugging may prove unreliable. Quit this debugging session? (y or n) n Create a core file? (y or n) n (gdb)
maint set internal-error action [ask|yes|no]maint show internal-error actionmaint set internal-warning action [ask|yes|no]maint show internal-warning actionmaint set demangler-warning action [ask|yes|no]maint show demangler-warning action-
When GDB reports an internal problem (error or warning) it
gives the user the opportunity to both quit GDB and create a
core file of the current GDB session. These commands let you
override the default behaviour for each particular action,
described in the table below.- ‘quit’
-
You can specify that GDB should always (yes) or never (no)
quit. The default is to ask the user what to do. - ‘corefile’
-
You can specify that GDB should always (yes) or never (no)
create a core file. The default is to ask the user what to do. Note
that there is nocorefileoption fordemangler-warning:
demangler warnings always create a core file and this cannot be
disabled.
maint set internal-error backtrace [on|off]maint show internal-error backtracemaint set internal-warning backtrace [on|off]maint show internal-warning backtrace-
When GDB reports an internal problem (error or warning) it is
possible to have a backtrace of GDB printed to the standard
error stream. This is ‘on’ by default forinternal-error
and ‘off’ by default forinternal-warning. maint packet text-
If GDB is talking to an inferior via the serial protocol,
then this command sends the string text to the inferior, and
displays the response packet. GDB supplies the initial
‘$’ character, the terminating ‘#’ character, and the
checksum.Any non-printable characters in the reply are printed as escaped hex,
e.g. ‘x00’, ‘x01’, etc. maint print architecture [file]-
Print the entire architecture configuration. The optional argument
file names the file where the output goes. maint print c-tdesc [-single-feature] [file]-
Print the target description (see Target Descriptions) as
a C source file. By default, the target description is for the current
target, but if the optional argument file is provided, that file
is used to produce the description. The file should be an XML
document, of the form described in Target Description Format.
The created source file is built into GDB when GDB is
built again. This command is used by developers after they add or
modify XML target descriptions.When the optional flag ‘-single-feature’ is provided then the
target description being processed (either the default, or from
file) must only contain a single feature. The source file
produced is different in this case. maint print xml-tdesc [file]-
Print the target description (see Target Descriptions) as an XML
file. By default print the target description for the current target,
but if the optional argument file is provided, then that file is
read in by GDB and then used to produce the description. The
file should be an XML document, of the form described in
Target Description Format. maint check xml-descriptions dir-
Check that the target descriptions dynamically created by GDB
equal the descriptions created from XML files found in dir. maint check libthread-db-
Run integrity checks on the current inferior’s thread debugging
library. This exercises alllibthread_dbfunctionality used by
GDB on GNU/Linux systems, and by extension also exercises the
proc_servicefunctions provided by GDB that
libthread_dbuses. Note that parts of the test may be skipped
on some platforms when debugging core files. maint print core-file-backed-mappings-
Print the file-backed mappings which were loaded from a core file note.
This output represents state internal to GDB and should be
similar to the mappings displayed by theinfo proc mappings
command. maint print dummy-frames-
Prints the contents of GDB’s internal dummy-frame stack.
(gdb) b add … (gdb) print add(2,3) Breakpoint 2, add (a=2, b=3) at … 58 return (a + b); The program being debugged stopped while in a function called from GDB. … (gdb) maint print dummy-frames 0xa8206d8: id={stack=0xbfffe734,code=0xbfffe73f,!special}, ptid=process 9353 (gdb)Takes an optional file parameter.
maint print frame-idmaint print frame-id level-
Print GDB’s internal frame-id for the frame at relative
level, or for the currently selected frame when level is
not given.If used, level should be an integer, as displayed in the
backtraceoutput.(gdb) maint print frame-id frame-id for frame #0: {stack=0x7fffffffac70,code=0x0000000000401106,!special} (gdb) maint print frame-id 2 frame-id for frame #2: {stack=0x7fffffffac90,code=0x000000000040111c,!special} maint print registers [file]maint print raw-registers [file]maint print cooked-registers [file]maint print register-groups [file]maint print remote-registers [file]-
Print GDB’s internal register data structures.
The command
maint print raw-registersincludes the contents of
the raw register cache; the commandmaint printincludes the (cooked) value of all registers,
cooked-registers
including registers which aren’t available on the target nor visible
to user; the commandmaint print register-groupsincludes the
groups that each register is a member of; and the commandmaintincludes the remote target’s register numbers
print remote-registers
and offsets in the ‘G’ packets.These commands take an optional parameter, a file name to which to
write the information. maint print reggroups [file]-
Print GDB’s internal register group data structures. The
optional argument file tells to what file to write the
information.The register groups info looks like this:
(gdb) maint print reggroups Group Type general user float user all user vector user system user save internal restore internal
maint flush register-cacheflushregs-
Flush the contents of the register cache and as a consequence the
frame cache. This command is useful when debugging issues related to
register fetching, or frame unwinding. The commandflushregs
is deprecated in favor ofmaint flush register-cache. maint flush source-cache-
Flush GDB’s cache of source code file contents. After
GDB reads a source file, and optionally applies styling
(see Output Styling), the file contents are cached. This command
clears that cache. The next time GDB wants to show lines
from a source file, the content will be re-read.This command is useful when debugging issues related to source code
styling. After flushing the cache any source code displayed by
GDB will be re-read and re-styled. maint print objfiles [regexp]-
Print a dump of all known object files.
If regexp is specified, only print object files whose names
match regexp. For each object file, this command prints its name,
address in memory, and all of its psymtabs and symtabs. maint print user-registers-
List all currently available user registers. User registers
typically provide alternate names for actual hardware registers. They
include the four “standard” registers$fp,$pc,
$sp, and$ps. See standard registers. User
registers can be used in expressions in the same way as the canonical
register names, but only the latter are listed by theinfoand
registersmaint print registerscommands. maint print section-scripts [regexp]-
Print a dump of scripts specified in the
.debug_gdb_sectionsection.
If regexp is specified, only print scripts loaded by object files
matching regexp.
For each script, this command prints its name as specified in the objfile,
and the full path if known.
See dotdebug_gdb_scripts section. maint print statistics-
This command prints, for each object file in the program, various data
about that object file followed by the byte cache (bcache)
statistics for the object file. The objfile data includes the number
of minimal, partial, full, and stabs symbols, the number of types
defined by the objfile, the number of as yet unexpanded psym tables,
the number of line tables and string tables, and the amount of memory
used by the various tables. The bcache statistics include the counts,
sizes, and counts of duplicates of all and unique objects, max,
average, and median entry size, total memory used and its overhead and
savings, and various measures of the hash table size and chain
lengths. maint print target-stack-
A target is an interface between the debugger and a particular
kind of file or process. Targets can be stacked in strata,
so that more than one target can potentially respond to a request.
In particular, memory accesses will walk down the stack of targets
until they find a target that is interested in handling that particular
address.This command prints a short description of each layer that was pushed on
the target stack, starting from the top layer down to the bottom one. maint print type expr-
Print the type chain for a type specified by expr. The argument
can be either a type name or a symbol. If it is a symbol, the type of
that symbol is described. The type chain produced by this command is
a recursive definition of the data type as stored in GDB’s
data structures, including its flags and contained types. maint selftest [-verbose] [filter]-
Run any self tests that were compiled in to GDB. This will
print a message showing how many tests were run, and how many failed.
If a filter is passed, only the tests with filter in their
name will be ran. If-verboseis passed, the self tests can be
more verbose. maint set selftest verbosemaint show selftest verbose-
Control whether self tests are run verbosely or not.
maint info selftests-
List the selftests compiled in to GDB.
maint set dwarf always-disassemblemaint show dwarf always-disassemble-
Control the behavior of
info addresswhen using DWARF debugging
information.The default is
off, which means that GDB should try to
describe a variable’s location in an easily readable format. When
on, GDB will instead display the DWARF location
expression in an assembly-like format. Note that some locations are
too complex for GDB to describe simply; in this case you will
always see the disassembly form.Here is an example of the resulting disassembly:
(gdb) info addr argc Symbol "argc" is a complex DWARF expression: 1: DW_OP_fbreg 0For more information on these expressions, see
the DWARF standard. maint set dwarf max-cache-agemaint show dwarf max-cache-age-
Control the DWARF compilation unit cache.
In object files with inter-compilation-unit references, such as those
produced by the GCC option ‘-feliminate-dwarf2-dups’, the DWARF
reader needs to frequently refer to previously read compilation units.
This setting controls how long a compilation unit will remain in the
cache if it is not referenced. A higher limit means that cached
compilation units will be stored in memory longer, and more total
memory will be used. Setting it to zero disables caching, which will
slow down GDB startup, but reduce memory consumption. maint set dwarf unwindersmaint show dwarf unwinders-
Control use of the DWARF frame unwinders.
Many targets that support DWARF debugging use GDB’s DWARF
frame unwinders to build the backtrace. Many of these targets will
also have a second mechanism for building the backtrace for use in
cases where DWARF information is not available, this second mechanism
is often an analysis of a function’s prologue.In order to extend testing coverage of the second level stack
unwinding mechanisms it is helpful to be able to disable the DWARF
stack unwinders, this can be done with this switch.In normal use of GDB disabling the DWARF unwinders is not
advisable, there are cases that are better handled through DWARF than
prologue analysis, and the debug experience is likely to be better
with the DWARF frame unwinders enabled.If DWARF frame unwinders are not supported for a particular target
architecture, then enabling this flag does not cause them to be used. maint set worker-threadsmaint show worker-threads-
Control the number of worker threads that may be used by GDB.
On capable hosts, GDB may use multiple threads to speed up
certain CPU-intensive operations, such as demangling symbol names.
While the number of threads used by GDB may vary, this
command can be used to set an upper bound on this number. The default
isunlimited, which lets GDB choose a reasonable
number. Note that this only controls worker threads started by
GDB itself; libraries used by GDB may start threads
of their own. maint set profilemaint show profile-
Control profiling of GDB.
Profiling will be disabled until you use the ‘maint set profile’
command to enable it. When you enable profiling, the system will begin
collecting timing and execution count data; when you disable profiling or
exit GDB, the results will be written to a log file. Remember that
if you use profiling, GDB will overwrite the profiling log file
(often called gmon.out). If you have a record of important profiling
data in a gmon.out file, be sure to move it to a safe location.Configuring with ‘—enable-profiling’ arranges for GDB to be
compiled with the ‘-pg’ compiler option. maint set show-debug-regsmaint show show-debug-regs-
Control whether to show variables that mirror the hardware debug
registers. Useonto enable,offto disable. If
enabled, the debug registers values are shown when GDB inserts or
removes a hardware breakpoint or watchpoint, and when the inferior
triggers a hardware-assisted breakpoint or watchpoint. maint set show-all-tibmaint show show-all-tib-
Control whether to show all non zero areas within a 1k block starting
at thread local base, when using the ‘info w32 thread-information-block’
command. maint set target-asyncmaint show target-async-
This controls whether GDB targets operate in synchronous or
asynchronous mode (see Background Execution). Normally the
default is asynchronous, if it is available; but this can be changed
to more easily debug problems occurring only in synchronous mode. maint set target-non-stopmaint show target-non-stop-
This controls whether GDB targets always operate in non-stop
mode even ifset non-stopisoff(see Non-Stop Mode). The default isauto, meaning non-stop mode is enabled
if supported by the target.maint set target-non-stop auto-
This is the default mode. GDB controls the target in
non-stop mode if the target supports it. maint set target-non-stop on-
GDB controls the target in non-stop mode even if the target
does not indicate support. maint set target-non-stop off-
GDB does not control the target in non-stop mode even if the
target supports it.
maint set tui-resize-messagemaint show tui-resize-message-
Control whether GDB displays a message each time the terminal
is resized when in TUI mode. The default isoff, which means
that GDB is silent during resizes. Whenon,
GDB will display a message after a resize is completed; the
message will include a number indicating how many times the terminal
has been resized. This setting is intended for use by the test suite,
where it would otherwise be difficult to determine when a resize and
refresh has been completed. maint set per-commandmaint show per-command-
GDB can display the resources used by each command.
This is useful in debugging performance problems.maint set per-command space [on|off]maint show per-command space-
Enable or disable the printing of the memory used by GDB for each command.
If enabled, GDB will display how much memory each command
took, following the command’s own output.
This can also be requested by invoking GDB with the
—statistics command-line switch (see Mode Options). maint set per-command time [on|off]maint show per-command time-
Enable or disable the printing of the execution time of GDB
for each command.
If enabled, GDB will display how much time it
took to execute each command, following the command’s own output.
Both CPU time and wallclock time are printed.
Printing both is useful when trying to determine whether the cost is
CPU or, e.g., disk/network latency.
Note that the CPU time printed is for GDB only, it does not include
the execution time of the inferior because there’s no mechanism currently
to compute how much time was spent by GDB and how much time was
spent by the program been debugged.
This can also be requested by invoking GDB with the
—statistics command-line switch (see Mode Options). maint set per-command symtab [on|off]maint show per-command symtab-
Enable or disable the printing of basic symbol table statistics
for each command.
If enabled, GDB will display the following information:- number of symbol tables
- number of primary symbol tables
- number of blocks in the blockvector
maint set check-libthread-db [on|off]maint show check-libthread-db-
Control whether GDB should run integrity checks on inferior
specific thread debugging libraries as they are loaded. The default
is not to perform such checks. If any check fails GDB will
unload the library and continue searching for a suitable candidate as
described in set libthread-db-search-path. For more information
about the tests, see maint check libthread-db. maint set gnu-source-highlight enabled [on|off]maint show gnu-source-highlight enabled-
Control whether GDB should use the GNU Source Highlight
library for applying styling to source code (see Output Styling).
This will be ‘on’ by default if the GNU Source Highlight library
is available. If the GNU Source Highlight library is not available,
then this will be ‘off’ by default, and attempting to change this
value to ‘on’ will give an error.If the GNU Source Highlight library is not being used, then
GDB will use the Python Pygments package for source code
styling, if it is available.This option is useful for debugging GDB’s use of the Pygments
library when GDB is linked against the GNU Source Highlight
library. maint set libopcodes-styling enabled [on|off]maint show libopcodes-styling enabled-
Control whether GDB should use its builtin disassembler
(libopcodes) to style disassembler output (see Output Styling). The builtin disassembler does not support styling for all
architectures.When this option is ‘off’ the builtin disassembler will not be
used for styling, GDB will fall back to using the Python
Pygments package if possible.Trying to set this option ‘on’ for an architecture that the
builtin disassembler is unable to style will give an error, otherwise,
the builtin disassembler will be used to style disassembler output.This option is ‘on’ by default for supported architectures.
This option is useful for debugging GDB’s use of the Pygments
library when GDB is built for an architecture that supports
styling with the builtin disassembler maint space value-
An alias for
maint set per-command space.
A non-zero value enables it, zero disables it. maint time value-
An alias for
maint set per-command time.
A non-zero value enables it, zero disables it. maint translate-address [section] addr-
Find the symbol stored at the location specified by the address
addr and an optional section name section. If found,
GDB prints the name of the closest symbol and an offset from
the symbol’s location to the specified address. This is similar to
theinfo addresscommand (see Symbols), except that this
command also allows to find symbols in other sections.If section was not specified, the section in which the symbol was found
is also printed. For dynamically linked executables, the name of
executable or shared library containing the symbol is printed as well. maint test-options require-delimitermaint test-options unknown-is-errormaint test-options unknown-is-operand-
These commands are used by the testsuite to validate the command
options framework. Therequire-delimitervariant requires a
double-dash delimiter to indicate end of options. The
unknown-is-errorandunknown-is-operanddo not. The
unknown-is-errorvariant throws an error on unknown option,
whileunknown-is-operandtreats unknown options as the start of
the command’s operands. When run, the commands output the result of
the processed options. When completed, the commands store the
internal result of completion in a variable exposed by themaintcommand.
show test-options-completion-result maint show test-options-completion-result-
Shows the result of completing the
maint test-options
subcommands. This is used by the testsuite to validate completion
support in the command options framework. maint set test-settings kindmaint show test-settings kind-
These are representative commands for each kind of setting type
GDB supports. They are used by the testsuite for exercising
the settings infrastructure. maint set backtrace-on-fatal-signal [on|off]maint show backtrace-on-fatal-signal-
When this setting is
on, if GDB itself terminates with
a fatal signal (e.g. SIGSEGV), then a limited backtrace will be
printed to the standard error stream. This backtrace can be used to
help diagnose crashes within GDB in situations where a user
is unable to share a corefile with the GDB developers.If the functionality to provide this backtrace is not available for
the platform on which GDB is running then this feature will be
offby default, and attempting to turn this feature on will
give an error.For platforms that do support creating the backtrace this feature is
onby default. maint with setting [value] [-- command]-
Like the
withcommand, but works withmaintenance set
variables. This is used by the testsuite to exercise thewith
command’s infrastructure.
The following command is useful for non-interactive invocations of
GDB, such as in the test suite.
set watchdog nsec-
Set the maximum number of seconds GDB will wait for the
target operation to finish. If this time expires, GDB
reports and error and the command is aborted. show watchdog-
Show the current setting of the target wait timeout.
Appendix E GDB Remote Serial Protocol
E.1 Overview
There may be occasions when you need to know something about the
protocol—for example, if there is only one serial port to your target
machine, you might want your program to do something special if it
recognizes a packet meant for GDB.
In the examples below, ‘->’ and ‘<-’ are used to indicate
transmitted and received data, respectively.
All GDB commands and responses (other than acknowledgments
and notifications, see Notification Packets) are sent as a
packet. A packet is introduced with the character
‘$’, the actual packet-data, and the terminating character
‘#’ followed by a two-digit checksum:
The two-digit checksum is computed as the modulo 256 sum of all
characters between the leading ‘$’ and the trailing ‘#’ (an
eight bit unsigned checksum).
Implementors should note that prior to GDB 5.0 the protocol
specification also included an optional two-digit sequence-id:
$sequence-id:packet-data#checksum
That sequence-id was appended to the acknowledgment. GDB
has never output sequence-ids. Stubs that handle packets added
since GDB 5.0 must not accept sequence-id.
When either the host or the target machine receives a packet, the first
response expected is an acknowledgment: either ‘+’ (to indicate
the package was received correctly) or ‘—’ (to request
retransmission):
->$packet-data#checksum <-+
The ‘+’/‘—’ acknowledgments can be disabled
once a connection is established.
See Packet Acknowledgment, for details.
The host (GDB) sends commands, and the target (the
debugging stub incorporated in your program) sends a response. In
the case of step and continue commands, the response is only sent
when the operation has completed, and the target has again stopped all
threads in all attached processes. This is the default all-stop mode
behavior, but the remote protocol also supports GDB’s non-stop
execution mode; see Remote Non-Stop, for details.
packet-data consists of a sequence of characters with the
exception of ‘#’ and ‘$’ (see ‘X’ packet for additional
exceptions).
Fields within the packet should be separated using ‘,’ ‘;’ or
‘:’. Except where otherwise noted all numbers are represented in
HEX with leading zeros suppressed.
Implementors should note that prior to GDB 5.0, the character
‘:’ could not appear as the third character in a packet (as it
would potentially conflict with the sequence-id).
Binary data in most packets is encoded either as two hexadecimal
digits per byte of binary data. This allowed the traditional remote
protocol to work over connections which were only seven-bit clean.
Some packets designed more recently assume an eight-bit clean
connection, and use a more efficient encoding to send and receive
binary data.
The binary data representation uses 7d (ASCII ‘}’)
as an escape character. Any escaped byte is transmitted as the escape
character followed by the original character XORed with 0x20.
For example, the byte 0x7d would be transmitted as the two
bytes 0x7d 0x5d. The bytes 0x23 (ASCII ‘#’),
0x24 (ASCII ‘$’), and 0x7d (ASCII
‘}’) must always be escaped. Responses sent by the stub
must also escape 0x2a (ASCII ‘*’), so that it
is not interpreted as the start of a run-length encoded sequence
(described next).
Response data can be run-length encoded to save space.
Run-length encoding replaces runs of identical characters with one
instance of the repeated character, followed by a ‘*’ and a
repeat count. The repeat count is itself sent encoded, to avoid
binary characters in data: a value of n is sent as
n+29. For a repeat count greater or equal to 3, this
produces a printable ASCII character, e.g. a space (ASCII
code 32) for a repeat count of 3. (This is because run-length
encoding starts to win for counts 3 or more.) Thus, for example,
‘0* ’ is a run-length encoding of “0000”: the space character
after ‘*’ means repeat the leading 0 32 - 29 = 3 more times.
The printable characters ‘#’ and ‘$’ or with a numeric value
greater than 126 must not be used. Runs of six repeats (‘#’) or
seven repeats (‘$’) can be expanded using a repeat count of only
five (‘«’). For example, ‘00000000’ can be encoded as
‘0*»00’.
The error response returned for some packets includes a two character
error number. That number is not well defined.
For any command not supported by the stub, an empty response
(‘$#00’) should be returned. That way it is possible to extend the
protocol. A newer GDB can tell if a packet is supported based
on that response.
At a minimum, a stub is required to support the ‘?’ command to
tell GDB the reason for halting, ‘g’ and ‘G’
commands for register access, and the ‘m’ and ‘M’ commands
for memory access. Stubs that only control single-threaded targets
can implement run control with the ‘c’ (continue) command, and if
the target architecture supports hardware-assisted single-stepping,
the ‘s’ (step) command. Stubs that support multi-threading
targets should support the ‘vCont’ command. All other commands
are optional.
E.2 Packets
The following table provides a complete list of all currently defined
commands and their corresponding response data.
See File-I/O Remote Protocol Extension, for details about the File
I/O extension of the remote protocol.
Each packet’s description has a template showing the packet’s overall
syntax, followed by an explanation of the packet’s meaning. We
include spaces in some of the templates for clarity; these are not
part of the packet’s syntax. No GDB packet uses spaces to
separate its components. For example, a template like ‘foo
bar baz’ describes a packet beginning with the three ASCII
bytes ‘foo’, followed by a bar, followed directly by a
baz. GDB does not transmit a space character between the
‘foo’ and the bar, or between the bar and the
baz.
Several packets and replies include a thread-id field to identify
a thread. Normally these are positive numbers with a target-specific
interpretation, formatted as big-endian hex strings. A thread-id
can also be a literal ‘-1’ to indicate all threads, or ‘0’ to
pick any thread.
In addition, the remote protocol supports a multiprocess feature in
which the thread-id syntax is extended to optionally include both
process and thread ID fields, as ‘ppid.tid’.
The pid (process) and tid (thread) components each have the
format described above: a positive number with target-specific
interpretation formatted as a big-endian hex string, literal ‘-1’
to indicate all processes or threads (respectively), or ‘0’ to
indicate an arbitrary process or thread. Specifying just a process, as
‘ppid’, is equivalent to ‘ppid.-1’. It is an
error to specify all processes but a specific thread, such as
‘p-1.tid’. Note that the ‘p’ prefix is not used
for those packets and replies explicitly documented to include a process
ID, rather than a thread-id.
The multiprocess thread-id syntax extensions are only used if both
GDB and the stub report support for the ‘multiprocess’
feature using ‘qSupported’. See multiprocess extensions, for
more information.
Note that all packet forms beginning with an upper- or lower-case
letter, other than those described here, are reserved for future use.
Here are the packet descriptions.
- ‘!’
-
Enable extended mode. In extended mode, the remote server is made
persistent. The ‘R’ packet is used to restart the program being
debugged.Reply:
- ‘OK’
-
The remote target both supports and has enabled extended mode.
- ‘?’
-
This is sent when connection is first established to query the reason
the target halted. The reply is the same as for step and continue.
This packet has a special interpretation when the target is in
non-stop mode; see Remote Non-Stop.Reply:
See Stop Reply Packets, for the reply specifications. - ‘A arglen,argnum,arg,…’
-
Initialized
argv[]array passed into program. arglen
specifies the number of bytes in the hex encoded byte stream
arg. Seegdbserverfor more details.Reply:
- ‘OK’
-
The arguments were set.
- ‘E NN’
-
An error occurred.
- ‘b baud’
-
(Don’t use this packet; its behavior is not well-defined.)
Change the serial line speed to baud.JTC: When does the transport layer state change? When it’s
received, or after the ACK is transmitted. In either case, there are
problems if the command or the acknowledgment packet is dropped.Stan: If people really wanted to add something like this, and get
it working for the first time, they ought to modify ser-unix.c to send
some kind of out-of-band message to a specially-setup stub and have the
switch happen «in between» packets, so that from remote protocol’s point
of view, nothing actually happened. - ‘B addr,mode’
-
Set (mode is ‘S’) or clear (mode is ‘C’) a
breakpoint at addr.Don’t use this packet. Use the ‘Z’ and ‘z’ packets instead
(see insert breakpoint or watchpoint packet). - ‘bc’
-
Backward continue. Execute the target system in reverse. No parameter.
See Reverse Execution, for more information.Reply:
See Stop Reply Packets, for the reply specifications. - ‘bs’
-
Backward single step. Execute one instruction in reverse. No parameter.
See Reverse Execution, for more information.Reply:
See Stop Reply Packets, for the reply specifications. - ‘c [addr]’
-
Continue at addr, which is the address to resume. If addr
is omitted, resume at current address.This packet is deprecated for multi-threading support. See vCont packet.
Reply:
See Stop Reply Packets, for the reply specifications. - ‘C sig[;addr]’
-
Continue with signal sig (hex signal number). If
‘;addr’ is omitted, resume at same address.This packet is deprecated for multi-threading support. See vCont packet.
Reply:
See Stop Reply Packets, for the reply specifications. - ‘d’
-
Toggle debug flag.
Don’t use this packet; instead, define a general set packet
(see General Query Packets). - ‘D’
- ‘D;pid’
-
The first form of the packet is used to detach GDB from the
remote system. It is sent to the remote target
before GDB disconnects via thedetachcommand.The second form, including a process ID, is used when multiprocess
protocol extensions are enabled (see multiprocess extensions), to
detach only a specific process. The pid is specified as a
big-endian hex string.Reply:
- ‘OK’
-
for success
- ‘E NN’
-
for an error
- ‘F RC,EE,CF;XX’
-
A reply from GDB to an ‘F’ packet sent by the target.
This is part of the File-I/O protocol extension. See File-I/O Remote Protocol Extension, for the specification. - ‘g’
-
Read general registers.
Reply:
- ‘XX…’
-
Each byte of register data is described by two hex digits. The bytes
with the register are transmitted in target byte order. The size of
each register and their position within the ‘g’ packet are
determined by the GDB internal gdbarch functions
DEPRECATED_REGISTER_RAW_SIZEandgdbarch_register_name.When reading registers from a trace frame (see Using the Collected Data), the stub may also return a string of
literal ‘x’’s in place of the register data digits, to indicate
that the corresponding register has not been collected, thus its value
is unavailable. For example, for an architecture with 4 registers of
4 bytes each, the following reply indicates to GDB that
registers 0 and 2 have not been collected, while registers 1 and 3
have been collected, and both have zero value:->
g<-xxxxxxxx00000000xxxxxxxx00000000 - ‘E NN’
-
for an error.
- ‘G XX…’
-
Write general registers. See read registers packet, for a
description of the XX… data.Reply:
- ‘OK’
-
for success
- ‘E NN’
-
for an error
- ‘H op thread-id’
-
Set thread for subsequent operations (‘m’, ‘M’, ‘g’,
‘G’, et.al.). Depending on the operation to be performed, op
should be ‘c’ for step and continue operations (note that this
is deprecated, supporting the ‘vCont’ command is a better
option), and ‘g’ for other operations. The thread designator
thread-id has the format and interpretation described in
thread-id syntax.Reply:
- ‘OK’
-
for success
- ‘E NN’
-
for an error
- ‘i [addr[,nnn]]’
-
Step the remote target by a single clock cycle. If ‘,nnn’ is
present, cycle step nnn cycles. If addr is present, cycle
step starting at that address. - ‘I’
-
Signal, then cycle step. See step with signal packet. See cycle step packet.
- ‘k’
-
Kill request.
The exact effect of this packet is not specified.
For a bare-metal target, it may power cycle or reset the target
system. For that reason, the ‘k’ packet has no reply.For a single-process target, it may kill that process if possible.
A multiple-process target may choose to kill just one process, or all
that are under GDB’s control. For more precise control, use
the vKill packet (see vKill packet).If the target system immediately closes the connection in response to
‘k’, GDB does not consider the lack of packet
acknowledgment to be an error, and assumes the kill was successful.If connected using target extended-remote, and the target does
not close the connection in response to a kill request, GDB
probes the target state as if a new connection was opened
(see ? packet). - ‘m addr,length’
-
Read length addressable memory units starting at address addr
(see addressable memory unit). Note that addr may not be aligned to
any particular boundary.The stub need not use any particular size or alignment when gathering
data from memory for the response; even if addr is word-aligned
and length is a multiple of the word size, the stub is free to
use byte accesses, or not. For this reason, this packet may not be
suitable for accessing memory-mapped I/O devices.Reply:
- ‘XX…’
-
Memory contents; each byte is transmitted as a two-digit hexadecimal number.
The reply may contain fewer addressable memory units than requested if the
server was able to read only part of the region of memory. - ‘E NN’
-
NN is errno
- ‘M addr,length:XX…’
-
Write length addressable memory units starting at address addr
(see addressable memory unit). The data is given by XX…; each
byte is transmitted as a two-digit hexadecimal number.Reply:
- ‘OK’
-
for success
- ‘E NN’
-
for an error (this includes the case where only part of the data was
written).
- ‘p n’
-
Read the value of register n; n is in hex.
See read registers packet, for a description of how the returned
register value is encoded.Reply:
- ‘XX…’
-
the register’s value
- ‘E NN’
-
for an error
- ‘’
-
Indicating an unrecognized query.
- ‘P n…=r…’
-
Write register n… with value r…. The register
number n is in hexadecimal, and r… contains two hex
digits for each byte in the register (target byte order).Reply:
- ‘OK’
-
for success
- ‘E NN’
-
for an error
- ‘q name params…’
- ‘Q name params…’
-
General query (‘q’) and set (‘Q’). These packets are
described fully in General Query Packets. - ‘r’
-
Reset the entire system.
Don’t use this packet; use the ‘R’ packet instead.
- ‘R XX’
-
Restart the program being debugged. The XX, while needed, is ignored.
This packet is only available in extended mode (see extended mode).The ‘R’ packet has no reply.
- ‘s [addr]’
-
Single step, resuming at addr. If
addr is omitted, resume at same address.This packet is deprecated for multi-threading support. See vCont packet.
Reply:
See Stop Reply Packets, for the reply specifications. - ‘S sig[;addr]’
-
Step with signal. This is analogous to the ‘C’ packet, but
requests a single-step, rather than a normal resumption of execution.This packet is deprecated for multi-threading support. See vCont packet.
Reply:
See Stop Reply Packets, for the reply specifications. - ‘t addr:PP,MM’
-
Search backwards starting at address addr for a match with pattern
PP and mask MM, both of which are are 4 byte long.
There must be at least 3 digits in addr. - ‘T thread-id’
-
Find out if the thread thread-id is alive. See thread-id syntax.
Reply:
- ‘OK’
-
thread is still alive
- ‘E NN’
-
thread is dead
- ‘v’
-
Packets starting with ‘v’ are identified by a multi-letter name,
up to the first ‘;’ or ‘?’ (or the end of the packet). - ‘vAttach;pid’
-
Attach to a new process with the specified process ID pid.
The process ID is a
hexadecimal integer identifying the process. In all-stop mode, all
threads in the attached process are stopped; in non-stop mode, it may be
attached without being stopped if that is supported by the target.This packet is only available in extended mode (see extended mode).
Reply:
- ‘E nn’
-
for an error
- ‘Any stop packet’
-
for success in all-stop mode (see Stop Reply Packets)
- ‘OK’
-
for success in non-stop mode (see Remote Non-Stop)
- ‘vCont[;action[:thread-id]]…’
-
Resume the inferior, specifying different actions for each thread.
For each inferior thread, the leftmost action with a matching
thread-id is applied. Threads that don’t match any action
remain in their current state. Thread IDs are specified using the
syntax described in thread-id syntax. If multiprocess
extensions (see multiprocess extensions) are supported, actions
can be specified to match all threads in a process by using the
‘ppid.-1’ form of the thread-id. An action with no
thread-id matches all threads. Specifying no actions is an
error.Currently supported actions are:
- ‘c’
-
Continue.
- ‘C sig’
-
Continue with signal sig. The signal sig should be two hex digits.
- ‘s’
-
Step.
- ‘S sig’
-
Step with signal sig. The signal sig should be two hex digits.
- ‘t’
-
Stop.
- ‘r start,end’
-
Step once, and then keep stepping as long as the thread stops at
addresses between start (inclusive) and end (exclusive).
The remote stub reports a stop reply when either the thread goes out
of the range or is stopped due to an unrelated reason, such as hitting
a breakpoint. See range stepping.If the range is empty (start == end), then the action
becomes equivalent to the ‘s’ action. In other words,
single-step once, and report the stop (even if the stepped instruction
jumps to start).(A stop reply may be sent at any point even if the PC is still within
the stepping range; for example, it is valid to implement this packet
in a degenerate way as a single instruction step operation.)
The optional argument addr normally associated with the
‘c’, ‘C’, ‘s’, and ‘S’ packets is
not supported in ‘vCont’.The ‘t’ action is only relevant in non-stop mode
(see Remote Non-Stop) and may be ignored by the stub otherwise.
A stop reply should be generated for any affected thread not already stopped.
When a thread is stopped by means of a ‘t’ action,
the corresponding stop reply should indicate that the thread has stopped with
signal ‘0’, regardless of whether the target uses some other signal
as an implementation detail.The server must ignore ‘c’, ‘C’, ‘s’, ‘S’, and
‘r’ actions for threads that are already running. Conversely,
the server must ignore ‘t’ actions for threads that are already
stopped.Note: In non-stop mode, a thread is considered running until
GDB acknowledges an asynchronous stop notification for it with
the ‘vStopped’ packet (see Remote Non-Stop).The stub must support ‘vCont’ if it reports support for
multiprocess extensions (see multiprocess extensions).Reply:
See Stop Reply Packets, for the reply specifications. - ‘vCont?’
-
Request a list of actions supported by the ‘vCont’ packet.
Reply:
- ‘vCont[;action…]’
-
The ‘vCont’ packet is supported. Each action is a supported
command in the ‘vCont’ packet. - ‘’
-
The ‘vCont’ packet is not supported.
- ‘vCtrlC’
-
Interrupt remote target as if a control-C was pressed on the remote
terminal. This is the equivalent to reacting to the^C
(‘03’, the control-C character) character in all-stop mode
while the target is running, except this works in non-stop mode.
See interrupting remote targets, for more info on the all-stop
variant.Reply:
- ‘E nn’
-
for an error
- ‘OK’
-
for success
- ‘vFile:operation:parameter…’
-
Perform a file operation on the target system. For details,
see Host I/O Packets. - ‘vFlashErase:addr,length’
-
Direct the stub to erase length bytes of flash starting at
addr. The region may enclose any number of flash blocks, but
its start and end must fall on block boundaries, as indicated by the
flash block size appearing in the memory map (see Memory Map Format). GDB groups flash memory programming operations
together, and sends a ‘vFlashDone’ request after each group; the
stub is allowed to delay erase operation until the ‘vFlashDone’
packet is received.Reply:
- ‘OK’
-
for success
- ‘E NN’
-
for an error
- ‘vFlashWrite:addr:XX…’
-
Direct the stub to write data to flash address addr. The data
is passed in binary form using the same encoding as for the ‘X’
packet (see Binary Data). The memory ranges specified by
‘vFlashWrite’ packets preceding a ‘vFlashDone’ packet must
not overlap, and must appear in order of increasing addresses
(although ‘vFlashErase’ packets for higher addresses may already
have been received; the ordering is guaranteed only between
‘vFlashWrite’ packets). If a packet writes to an address that was
neither erased by a preceding ‘vFlashErase’ packet nor by some other
target-specific method, the results are unpredictable.Reply:
- ‘OK’
-
for success
- ‘E.memtype’
-
for vFlashWrite addressing non-flash memory
- ‘E NN’
-
for an error
- ‘vFlashDone’
-
Indicate to the stub that flash programming operation is finished.
The stub is permitted to delay or batch the effects of a group of
‘vFlashErase’ and ‘vFlashWrite’ packets until a
‘vFlashDone’ packet is received. The contents of the affected
regions of flash memory are unpredictable until the ‘vFlashDone’
request is completed. - ‘vKill;pid’
-
Kill the process with the specified process ID pid, which is a
hexadecimal integer identifying the process. This packet is used in
preference to ‘k’ when multiprocess protocol extensions are
supported; see multiprocess extensions.Reply:
- ‘E nn’
-
for an error
- ‘OK’
-
for success
- ‘vMustReplyEmpty’
-
The correct reply to an unknown ‘v’ packet is to return the empty
string, however, some older versions ofgdbserverwould
incorrectly return ‘OK’ for unknown ‘v’ packets.The ‘vMustReplyEmpty’ is used as a feature test to check how
gdbserverhandles unknown packets, it is important that this
packet be handled in the same way as other unknown ‘v’ packets.
If this packet is handled differently to other unknown ‘v’
packets then it is possible that GDB may run into problems in
other areas, specifically around use of ‘vFile:setfs:’. - ‘vRun;filename[;argument]…’
-
Run the program filename, passing it each argument on its
command line. The file and arguments are hex-encoded strings. If
filename is an empty string, the stub may use a default program
(e.g. the last program run). The program is created in the stopped
state.This packet is only available in extended mode (see extended mode).
Reply:
- ‘E nn’
-
for an error
- ‘Any stop packet’
-
for success (see Stop Reply Packets)
- ‘vStopped’
-
See Notification Packets.
- ‘X addr,length:XX…’
-
Write data to memory, where the data is transmitted in binary.
Memory is specified by its address addr and number of addressable memory
units length (see addressable memory unit);
‘XX…’ is binary data (see Binary Data).Reply:
- ‘OK’
-
for success
- ‘E NN’
-
for an error
- ‘z type,addr,kind’
- ‘Z type,addr,kind’
-
Insert (‘Z’) or remove (‘z’) a type breakpoint or
watchpoint starting at address address of kind kind.Each breakpoint and watchpoint packet type is documented
separately.Implementation notes: A remote target shall return an empty string
for an unrecognized breakpoint or watchpoint packet type. A
remote target shall support either both or neither of a given
‘Ztype…’ and ‘ztype…’ packet pair. To
avoid potential problems with duplicate packets, the operations should
be implemented in an idempotent way. - ‘z0,addr,kind’
- ‘Z0,addr,kind[;cond_list…][;cmds:persist,cmd_list…]’
-
Insert (‘Z0’) or remove (‘z0’) a software breakpoint at address
addr of type kind.A software breakpoint is implemented by replacing the instruction at
addr with a software breakpoint or trap instruction. The
kind is target-specific and typically indicates the size of the
breakpoint in bytes that should be inserted. E.g., the ARM and
MIPS can insert either a 2 or 4 byte breakpoint. Some
architectures have additional meanings for kind
(see Architecture-Specific Protocol Details); if no
architecture-specific value is being used, it should be ‘0’.
kind is hex-encoded. cond_list is an optional list of
conditional expressions in bytecode form that should be evaluated on
the target’s side. These are the conditions that should be taken into
consideration when deciding if the breakpoint trigger should be
reported back to GDB.See also the ‘swbreak’ stop reason (see swbreak stop reason)
for how to best report a software breakpoint event to GDB.The cond_list parameter is comprised of a series of expressions,
concatenated without separators. Each expression has the following form:- ‘X len,expr’
-
len is the length of the bytecode expression and expr is the
actual conditional expression in bytecode form.
The optional cmd_list parameter introduces commands that may be
run on the target, rather than being reported back to GDB.
The parameter starts with a numeric flag persist; if the flag is
nonzero, then the breakpoint may remain active and the commands
continue to be run even when GDB disconnects from the target.
Following this flag is a series of expressions concatenated with no
separators. Each expression has the following form:- ‘X len,expr’
-
len is the length of the bytecode expression and expr is the
actual commands expression in bytecode form.
Implementation note: It is possible for a target to copy or move
code that contains software breakpoints (e.g., when implementing
overlays). The behavior of this packet, in the presence of such a
target, is not defined.Reply:
- ‘OK’
-
success
- ‘’
-
not supported
- ‘E NN’
-
for an error
- ‘z1,addr,kind’
- ‘Z1,addr,kind[;cond_list…][;cmds:persist,cmd_list…]’
-
Insert (‘Z1’) or remove (‘z1’) a hardware breakpoint at
address addr.A hardware breakpoint is implemented using a mechanism that is not
dependent on being able to modify the target’s memory. The
kind, cond_list, and cmd_list arguments have the
same meaning as in ‘Z0’ packets.Implementation note: A hardware breakpoint is not affected by code
movement.Reply:
- ‘OK’
-
success
- ‘’
-
not supported
- ‘E NN’
-
for an error
- ‘z2,addr,kind’
- ‘Z2,addr,kind’
-
Insert (‘Z2’) or remove (‘z2’) a write watchpoint at addr.
The number of bytes to watch is specified by kind.Reply:
- ‘OK’
-
success
- ‘’
-
not supported
- ‘E NN’
-
for an error
- ‘z3,addr,kind’
- ‘Z3,addr,kind’
-
Insert (‘Z3’) or remove (‘z3’) a read watchpoint at addr.
The number of bytes to watch is specified by kind.Reply:
- ‘OK’
-
success
- ‘’
-
not supported
- ‘E NN’
-
for an error
- ‘z4,addr,kind’
- ‘Z4,addr,kind’
-
Insert (‘Z4’) or remove (‘z4’) an access watchpoint at addr.
The number of bytes to watch is specified by kind.Reply:
- ‘OK’
-
success
- ‘’
-
not supported
- ‘E NN’
-
for an error
E.3 Stop Reply Packets
The ‘C’, ‘c’, ‘S’, ‘s’, ‘vCont’,
‘vAttach’, ‘vRun’, ‘vStopped’, and ‘?’ packets can
receive any of the below as a reply. Except for ‘?’
and ‘vStopped’, that reply is only returned
when the target halts. In the below the exact meaning of signal
number is defined by the header include/gdb/signals.h in the
GDB source code.
In non-stop mode, the server will simply reply ‘OK’ to commands
such as ‘vCont’; any stop will be the subject of a future
notification. See Remote Non-Stop.
As in the description of request packets, we include spaces in the
reply templates for clarity; these are not part of the reply packet’s
syntax. No GDB stop reply packet uses spaces to separate its
components.
- ‘S AA’
-
The program received signal number AA (a two-digit hexadecimal
number). This is equivalent to a ‘T’ response with no
n:r pairs. - ‘T AA n1:r1;n2:r2;…’
-
The program received signal number AA (a two-digit hexadecimal
number). This is equivalent to an ‘S’ response, except that the
‘n:r’ pairs can carry values of important registers
and other information directly in the stop reply packet, reducing
round-trip latency. Single-step and breakpoint traps are reported
this way. Each ‘n:r’ pair is interpreted as follows:- If n is a hexadecimal number, it is a register number, and the
corresponding r gives that register’s value. The data r is a
series of bytes in target byte order, with each byte given by a
two-digit hex number. - If n is ‘thread’, then r is the thread ID of
the stopped thread, as specified in thread-id syntax. - If n is ‘core’, then r is the hexadecimal number of
the core on which the stop event was detected. - If n is a recognized stop reason, it describes a more
specific event that stopped the target. The currently defined stop
reasons are listed below. The aa should be ‘05’, the trap
signal. At most one stop reason should be present. - Otherwise, GDB should ignore this ‘n:r’ pair
and go on to the next; this allows us to extend the protocol in the
future.
The currently defined stop reasons are:
- ‘watch’
- ‘rwatch’
- ‘awatch’
-
The packet indicates a watchpoint hit, and r is the data address, in
hex. - ‘syscall_entry’
- ‘syscall_return’
-
The packet indicates a syscall entry or return, and r is the
syscall number, in hex. - ‘library’
-
The packet indicates that the loaded libraries have changed.
GDB should use ‘qXfer:libraries:read’ to fetch a new
list of loaded libraries. The r part is ignored. - ‘replaylog’
-
The packet indicates that the target cannot continue replaying
logged execution events, because it has reached the end (or the
beginning when executing backward) of the log. The value of r
will be either ‘begin’ or ‘end’. See Reverse Execution,
for more information. - ‘swbreak’
-
The packet indicates a software breakpoint instruction was executed,
irrespective of whether it was GDB that planted the
breakpoint or the breakpoint is hardcoded in the program. The r
part must be left empty.On some architectures, such as x86, at the architecture level, when a
breakpoint instruction executes the program counter points at the
breakpoint address plus an offset. On such targets, the stub is
responsible for adjusting the PC to point back at the breakpoint
address.This packet should not be sent by default; older GDB versions
did not support it. GDB requests it, by supplying an
appropriate ‘qSupported’ feature (see qSupported). The
remote stub must also supply the appropriate ‘qSupported’ feature
indicating support.This packet is required for correct non-stop mode operation.
- ‘hwbreak’
-
The packet indicates the target stopped for a hardware breakpoint.
The r part must be left empty.The same remarks about ‘qSupported’ and non-stop mode above
apply. - ‘fork’
-
The packet indicates that
forkwas called, and r is the
thread ID of the new child process, as specified in thread-id syntax. This packet is only applicable to targets that support fork
events.This packet should not be sent by default; older GDB versions
did not support it. GDB requests it, by supplying an
appropriate ‘qSupported’ feature (see qSupported). The
remote stub must also supply the appropriate ‘qSupported’ feature
indicating support. - ‘vfork’
-
The packet indicates that
vforkwas called, and r is the
thread ID of the new child process, as specified in thread-id syntax. This packet is only applicable to targets that support vfork
events.This packet should not be sent by default; older GDB versions
did not support it. GDB requests it, by supplying an
appropriate ‘qSupported’ feature (see qSupported). The
remote stub must also supply the appropriate ‘qSupported’ feature
indicating support. - ‘vforkdone’
-
The packet indicates that a child process created by a vfork
has either calledexecor terminated, so that the
address spaces of the parent and child process are no longer
shared. The r part is ignored. This packet is only
applicable to targets that support vforkdone events.This packet should not be sent by default; older GDB versions
did not support it. GDB requests it, by supplying an
appropriate ‘qSupported’ feature (see qSupported). The
remote stub must also supply the appropriate ‘qSupported’ feature
indicating support. - ‘exec’
-
The packet indicates that
execvewas called, and r
is the absolute pathname of the file that was executed, in hex.
This packet is only applicable to targets that support exec events.This packet should not be sent by default; older GDB versions
did not support it. GDB requests it, by supplying an
appropriate ‘qSupported’ feature (see qSupported). The
remote stub must also supply the appropriate ‘qSupported’ feature
indicating support. - ‘create’
-
The packet indicates that the thread was just created. The new thread
is stopped until GDB sets it running with a resumption packet
(see vCont packet). This packet should not be sent by default;
GDB requests it with the QThreadEvents packet. See
also the ‘w’ (see thread exit event) remote reply below. The
r part is ignored.
- If n is a hexadecimal number, it is a register number, and the
- ‘W AA’
- ‘W AA ; process:pid’
-
The process exited, and AA is the exit status. This is only
applicable to certain targets.The second form of the response, including the process ID of the
exited process, can be used only when GDB has reported
support for multiprocess protocol extensions; see multiprocess extensions. Both AA and pid are formatted as big-endian
hex strings. - ‘X AA’
- ‘X AA ; process:pid’
-
The process terminated with signal AA.
The second form of the response, including the process ID of the
terminated process, can be used only when GDB has reported
support for multiprocess protocol extensions; see multiprocess extensions. Both AA and pid are formatted as big-endian
hex strings. - ‘w AA ; tid’
-
The thread exited, and AA is the exit status. This response
should not be sent by default; GDB requests it with the
QThreadEvents packet. See also thread create event above.
AA is formatted as a big-endian hex string. - ‘N’
-
There are no resumed threads left in the target. In other words, even
though the process is alive, the last resumed thread has exited. For
example, say the target process has two threads: thread 1 and thread
2. The client leaves thread 1 stopped, and resumes thread 2, which
subsequently exits. At this point, even though the process is still
alive, and thus no ‘W’ stop reply is sent, no thread is actually
executing either. The ‘N’ stop reply thus informs the client
that it can stop waiting for stop replies. This packet should not be
sent by default; older GDB versions did not support it.
GDB requests it, by supplying an appropriate
‘qSupported’ feature (see qSupported). The remote stub must
also supply the appropriate ‘qSupported’ feature indicating
support. - ‘O XX…’
-
‘XX…’ is hex encoding of ASCII data, to be
written as the program’s console output. This can happen at any time
while the program is running and the debugger should continue to wait
for ‘W’, ‘T’, etc. This reply is not permitted in non-stop mode. - ‘F call-id,parameter…’
-
call-id is the identifier which says which host system call should
be called. This is just the name of the function. Translation into the
correct system call is only applicable as it’s defined in GDB.
See File-I/O Remote Protocol Extension, for a list of implemented
system calls.‘parameter…’ is a list of parameters as defined for
this very system call.The target replies with this packet when it expects GDB to
call a host system call on behalf of the target. GDB replies
with an appropriate ‘F’ packet and keeps up waiting for the next
reply packet from the target. The latest ‘C’, ‘c’, ‘S’
or ‘s’ action is expected to be continued. See File-I/O Remote Protocol Extension, for more details.
E.4 General Query Packets
Packets starting with ‘q’ are general query packets;
packets starting with ‘Q’ are general set packets. General
query and set packets are a semi-unified form for retrieving and
sending information to and from the stub.
The initial letter of a query or set packet is followed by a name
indicating what sort of thing the packet applies to. For example,
GDB may use a ‘qSymbol’ packet to exchange symbol
definitions with the stub. These packet names follow some
conventions:
- The name must not contain commas, colons or semicolons.
- Most GDB query and set packets have a leading upper case
letter. - The names of custom vendor packets should use a company prefix, in
lower case, followed by a period. For example, packets designed at
the Acme Corporation might begin with ‘qacme.foo’ (for querying
foos) or ‘Qacme.bar’ (for setting bars).
The name of a query or set packet should be separated from any
parameters by a ‘:’; the parameters themselves should be
separated by ‘,’ or ‘;’. Stubs must be careful to match the
full packet name, and check for a separator or the end of the packet,
in case two packet names share a common prefix. New packets should not begin
with ‘qC’, ‘qP’, or ‘qL’22.
Like the descriptions of the other packets, each description here
has a template showing the packet’s overall syntax, followed by an
explanation of the packet’s meaning. We include spaces in some of the
templates for clarity; these are not part of the packet’s syntax. No
GDB packet uses spaces to separate its components.
Here are the currently defined query and set packets:
- ‘QAgent:1’
- ‘QAgent:0’
-
Turn on or off the agent as a helper to perform some debugging operations
delegated from GDB (see Control Agent). - ‘QAllow:op:val…’
-
Specify which operations GDB expects to request of the
target, as a semicolon-separated list of operation name and value
pairs. Possible values for op include ‘WriteReg’,
‘WriteMem’, ‘InsertBreak’, ‘InsertTrace’,
‘InsertFastTrace’, and ‘Stop’. val is either 0,
indicating that GDB will not request the operation, or 1,
indicating that it may. (The target can then use this to set up its
own internals optimally, for instance if the debugger never expects to
insert breakpoints, it may not need to install its own trap handler.) - ‘qC’
-
Return the current thread ID.
Reply:
- ‘QC thread-id’
-
Where thread-id is a thread ID as documented in
thread-id syntax. - ‘(anything else)’
-
Any other reply implies the old thread ID.
- ‘qCRC:addr,length’
-
Compute the CRC checksum of a block of memory using CRC-32 defined in
IEEE 802.3. The CRC is computed byte at a time, taking the most
significant bit of each byte first. The initial pattern code
0xffffffffis used to ensure leading zeros affect the CRC.Note: This is the same CRC used in validating separate debug
files (see Debugging Information in Separate
Files). However the algorithm is slightly different. When validating
separate debug files, the CRC is computed taking the least
significant bit of each byte first, and the final result is inverted to
detect trailing zeros.Reply:
- ‘E NN’
-
An error (such as memory fault)
- ‘C crc32’
-
The specified memory region’s checksum is crc32.
- ‘QDisableRandomization:value’
-
Some target operating systems will randomize the virtual address space
of the inferior process as a security feature, but provide a feature
to disable such randomization, e.g. to allow for a more deterministic
debugging experience. On such systems, this packet with a value
of 1 directs the target to disable address space randomization for
processes subsequently started via ‘vRun’ packets, while a packet
with a value of 0 tells the target to enable address space
randomization.This packet is only available in extended mode (see extended mode).
Reply:
- ‘OK’
-
The request succeeded.
- ‘E nn’
-
An error occurred. The error number nn is given as hex digits.
- ‘’
-
An empty reply indicates that ‘QDisableRandomization’ is not supported
by the stub.
This packet is not probed by default; the remote stub must request it,
by supplying an appropriate ‘qSupported’ response (see qSupported).
This should only be done on targets that actually support disabling
address space randomization. - ‘QStartupWithShell:value’
-
On UNIX-like targets, it is possible to start the inferior using a
shell program. This is the default behavior on both GDB and
gdbserver(see set startup-with-shell). This packet is
used to informgdbserverwhether it should start the
inferior using a shell or not.If value is ‘0’,
gdbserverwill not use a shell
to start the inferior. If value is ‘1’,
gdbserverwill use a shell to start the inferior. All other
values are considered an error.This packet is only available in extended mode (see extended mode).
Reply:
- ‘OK’
-
The request succeeded.
- ‘E nn’
-
An error occurred. The error number nn is given as hex digits.
This packet is not probed by default; the remote stub must request it,
by supplying an appropriate ‘qSupported’ response
(see qSupported). This should only be done on targets that
actually support starting the inferior using a shell.Use of this packet is controlled by the
set startup-with-shell
command; see set startup-with-shell. - ‘QEnvironmentHexEncoded:hex-value’
-
On UNIX-like targets, it is possible to set environment variables that
will be passed to the inferior during the startup process. This
packet is used to informgdbserverof an environment
variable that has been defined by the user on GDB (see set environment).The packet is composed by hex-value, an hex encoded
representation of the name=value format representing an
environment variable. The name of the environment variable is
represented by name, and the value to be assigned to the
environment variable is represented by value. If the variable
has no value (i.e., the value isnull), then value will
not be present.This packet is only available in extended mode (see extended mode).
Reply:
- ‘OK’
-
The request succeeded.
This packet is not probed by default; the remote stub must request it,
by supplying an appropriate ‘qSupported’ response
(see qSupported). This should only be done on targets that
actually support passing environment variables to the starting
inferior.This packet is related to the
set environmentcommand;
see set environment. - ‘QEnvironmentUnset:hex-value’
-
On UNIX-like targets, it is possible to unset environment variables
before starting the inferior in the remote target. This packet is
used to informgdbserverof an environment variable that has
been unset by the user on GDB (see unset environment).The packet is composed by hex-value, an hex encoded
representation of the name of the environment variable to be unset.This packet is only available in extended mode (see extended mode).
Reply:
- ‘OK’
-
The request succeeded.
This packet is not probed by default; the remote stub must request it,
by supplying an appropriate ‘qSupported’ response
(see qSupported). This should only be done on targets that
actually support passing environment variables to the starting
inferior.This packet is related to the
unset environmentcommand;
see unset environment. - ‘QEnvironmentReset’
-
On UNIX-like targets, this packet is used to reset the state of
environment variables in the remote target before starting the
inferior. In this context, reset means unsetting all environment
variables that were previously set by the user (i.e., were not
initially present in the environment). It is sent to
gdbserverbefore the ‘QEnvironmentHexEncoded’
(see QEnvironmentHexEncoded) and the ‘QEnvironmentUnset’
(see QEnvironmentUnset) packets.This packet is only available in extended mode (see extended mode).
Reply:
- ‘OK’
-
The request succeeded.
This packet is not probed by default; the remote stub must request it,
by supplying an appropriate ‘qSupported’ response
(see qSupported). This should only be done on targets that
actually support passing environment variables to the starting
inferior. - ‘QSetWorkingDir:[directory]’
-
This packet is used to inform the remote server of the intended
current working directory for programs that are going to be executed.The packet is composed by directory, an hex encoded
representation of the directory that the remote inferior will use as
its current working directory. If directory is an empty string,
the remote server should reset the inferior’s current working
directory to its original, empty value.This packet is only available in extended mode (see extended mode).
Reply:
- ‘OK’
-
The request succeeded.
- ‘qfThreadInfo’
- ‘qsThreadInfo’
-
Obtain a list of all active thread IDs from the target (OS). Since there
may be too many active threads to fit into one reply packet, this query
works iteratively: it may require more than one query/reply sequence to
obtain the entire list of threads. The first query of the sequence will
be the ‘qfThreadInfo’ query; subsequent queries in the
sequence will be the ‘qsThreadInfo’ query.NOTE: This packet replaces the ‘qL’ query (see below).
Reply:
- ‘m thread-id’
-
A single thread ID
- ‘m thread-id,thread-id…’
-
a comma-separated list of thread IDs
- ‘l’
-
(lower case letter ‘L’) denotes end of list.
In response to each query, the target will reply with a list of one or
more thread IDs, separated by commas.
GDB will respond to each reply with a request for more thread
ids (using the ‘qs’ form of the query), until the target responds
with ‘l’ (lower-case ell, for last).
Refer to thread-id syntax, for the format of the thread-id
fields.Note: GDB will send the
qfThreadInfoquery during the
initial connection with the remote target, and the very first thread ID
mentioned in the reply will be stopped by GDB in a subsequent
message. Therefore, the stub should ensure that the first thread ID in
theqfThreadInforeply is suitable for being stopped by GDB. - ‘qGetTLSAddr:thread-id,offset,lm’
-
Fetch the address associated with thread local storage specified
by thread-id, offset, and lm.thread-id is the thread ID associated with the
thread for which to fetch the TLS address. See thread-id syntax.offset is the (big endian, hex encoded) offset associated with the
thread local variable. (This offset is obtained from the debug
information associated with the variable.)lm is the (big endian, hex encoded) OS/ABI-specific encoding of the
load module associated with the thread local storage. For example,
a GNU/Linux system will pass the link map address of the shared
object associated with the thread local storage under consideration.
Other operating environments may choose to represent the load module
differently, so the precise meaning of this parameter will vary.Reply:
- ‘XX…’
-
Hex encoded (big endian) bytes representing the address of the thread
local storage requested. - ‘E nn’
-
An error occurred. The error number nn is given as hex digits.
- ‘’
-
An empty reply indicates that ‘qGetTLSAddr’ is not supported by the stub.
- ‘qGetTIBAddr:thread-id’
-
Fetch address of the Windows OS specific Thread Information Block.
thread-id is the thread ID associated with the thread.
Reply:
- ‘XX…’
-
Hex encoded (big endian) bytes representing the linear address of the
thread information block. - ‘E nn’
-
An error occured. This means that either the thread was not found, or the
address could not be retrieved. - ‘’
-
An empty reply indicates that ‘qGetTIBAddr’ is not supported by the stub.
- ‘qL startflag threadcount nextthread’
-
Obtain thread information from RTOS. Where: startflag (one hex
digit) is one to indicate the first query and zero to indicate a
subsequent query; threadcount (two hex digits) is the maximum
number of threads the response packet can contain; and nextthread
(eight hex digits), for subsequent queries (startflag is zero), is
returned in the response as argthread.Don’t use this packet; use the ‘qfThreadInfo’ query instead (see above).
Reply:
- ‘qM count done argthread thread…’
-
Where: count (two hex digits) is the number of threads being
returned; done (one hex digit) is zero to indicate more threads
and one indicates no further threads; argthreadid (eight hex
digits) is nextthread from the request packet; thread…
is a sequence of thread IDs, threadid (eight hex
digits), from the target. Seeremote.c:parse_threadlist_response().
- ‘qMemTags:start address,length:type’
-
Fetch memory tags of type type from the address range
[start address, start address + length). The
target is responsible for calculating how many tags will be returned, as this
is architecture-specific.start address is the starting address of the memory range.
length is the length, in bytes, of the memory range.
type is the type of tag the request wants to fetch. The type is a signed
integer.Reply:
- ‘mxx…’
-
Hex encoded sequence of uninterpreted bytes, xx…, representing the
tags found in the requested memory range. - ‘E nn’
-
An error occured. This means that fetching of memory tags failed for some
reason. - ‘’
-
An empty reply indicates that ‘qMemTags’ is not supported by the stub,
although this should not happen given GDB will only send this packet
if the stub has advertised support for memory tagging via ‘qSupported’.
- ‘QMemTags:start address,length:type:tag bytes’
-
Store memory tags of type type to the address range
[start address, start address + length). The
target is responsible for interpreting the type, the tag bytes and modifying
the memory tag granules accordingly, given this is architecture-specific.The interpretation of how many tags (nt) should be written to how many
memory tag granules (ng) is also architecture-specific. The behavior is
implementation-specific, but the following is suggested.If the number of memory tags, nt, is greater than or equal to the
number of memory tag granules, ng, only ng tags will be
stored.If nt is less than ng, the behavior is that of a fill operation,
and the tag bytes will be used as a pattern that will get repeated until
ng tags are stored.start address is the starting address of the memory range. The address
does not have any restriction on alignment or size.length is the length, in bytes, of the memory range.
type is the type of tag the request wants to fetch. The type is a signed
integer.tag bytes is a sequence of hex encoded uninterpreted bytes which will be
interpreted by the target. Each pair of hex digits is interpreted as a
single byte.Reply:
- ‘OK’
-
The request was successful and the memory tag granules were modified
accordingly. - ‘E nn’
-
An error occured. This means that modifying the memory tag granules failed
for some reason. - ‘’
-
An empty reply indicates that ‘QMemTags’ is not supported by the stub,
although this should not happen given GDB will only send this packet
if the stub has advertised support for memory tagging via ‘qSupported’.
- ‘qOffsets’
-
Get section offsets that the target used when relocating the downloaded
image.Reply:
- ‘Text=xxx;Data=yyy[;Bss=zzz]’
-
Relocate the
Textsection by xxx from its original address.
Relocate theDatasection by yyy from its original address.
If the object file format provides segment information (e.g. ELF
‘PT_LOAD’ program headers), GDB will relocate entire
segments by the supplied offsets.Note: while a
Bssoffset may be included in the response,
GDB ignores this and instead applies theDataoffset
to theBsssection. - ‘TextSeg=xxx[;DataSeg=yyy]’
-
Relocate the first segment of the object file, which conventionally
contains program code, to a starting address of xxx. If
‘DataSeg’ is specified, relocate the second segment, which
conventionally contains modifiable data, to a starting address of
yyy. GDB will report an error if the object file
does not contain segment information, or does not contain at least
as many segments as mentioned in the reply. Extra segments are
kept at fixed offsets relative to the last relocated segment.
- ‘qP mode thread-id’
-
Returns information on thread-id. Where: mode is a hex
encoded 32 bit mode; thread-id is a thread ID
(see thread-id syntax).Don’t use this packet; use the ‘qThreadExtraInfo’ query instead
(see below).Reply: see
remote.c:remote_unpack_thread_info_response(). - ‘QNonStop:1’
- ‘QNonStop:0’
-
Enter non-stop (‘QNonStop:1’) or all-stop (‘QNonStop:0’) mode.
See Remote Non-Stop, for more information.Reply:
- ‘OK’
-
The request succeeded.
- ‘E nn’
-
An error occurred. The error number nn is given as hex digits.
- ‘’
-
An empty reply indicates that ‘QNonStop’ is not supported by
the stub.
This packet is not probed by default; the remote stub must request it,
by supplying an appropriate ‘qSupported’ response (see qSupported).
Use of this packet is controlled by theset non-stopcommand;
see Non-Stop Mode. - ‘QCatchSyscalls:1 [;sysno]…’
- ‘QCatchSyscalls:0’
-
Enable (‘QCatchSyscalls:1’) or disable (‘QCatchSyscalls:0’)
catching syscalls from the inferior process.For ‘QCatchSyscalls:1’, each listed syscall sysno (encoded
in hex) should be reported to GDB. If no syscall sysno
is listed, every system call should be reported.Note that if a syscall not in the list is reported, GDB will
still filter the event according to its own list from all corresponding
catch syscallcommands. However, it is more efficient to only
report the requested syscalls.Multiple ‘QCatchSyscalls:1’ packets do not combine; any earlier
‘QCatchSyscalls:1’ list is completely replaced by the new list.If the inferior process execs, the state of ‘QCatchSyscalls’ is
kept for the new process too. On targets where exec may affect syscall
numbers, for example with exec between 32 and 64-bit processes, the
client should send a new packet with the new syscall list.Reply:
- ‘OK’
-
The request succeeded.
- ‘E nn’
-
An error occurred. nn are hex digits.
- ‘’
-
An empty reply indicates that ‘QCatchSyscalls’ is not supported by
the stub.
Use of this packet is controlled by the
set remote catch-syscalls
command (see set remote catch-syscalls).
This packet is not probed by default; the remote stub must request it,
by supplying an appropriate ‘qSupported’ response (see qSupported). - ‘QPassSignals: signal [;signal]…’
-
Each listed signal should be passed directly to the inferior process.
Signals are numbered identically to continue packets and stop replies
(see Stop Reply Packets). Each signal list item should be
strictly greater than the previous item. These signals do not need to stop
the inferior, or be reported to GDB. All other signals should be
reported to GDB. Multiple ‘QPassSignals’ packets do not
combine; any earlier ‘QPassSignals’ list is completely replaced by the
new list. This packet improves performance when using ‘handle
signal nostop noprint pass’.Reply:
- ‘OK’
-
The request succeeded.
- ‘E nn’
-
An error occurred. The error number nn is given as hex digits.
- ‘’
-
An empty reply indicates that ‘QPassSignals’ is not supported by
the stub.
Use of this packet is controlled by the
set remote pass-signals
command (see set remote pass-signals).
This packet is not probed by default; the remote stub must request it,
by supplying an appropriate ‘qSupported’ response (see qSupported). - ‘QProgramSignals: signal [;signal]…’
-
Each listed signal may be delivered to the inferior process.
Others should be silently discarded.In some cases, the remote stub may need to decide whether to deliver a
signal to the program or not without GDB involvement. One
example of that is while detaching — the program’s threads may have
stopped for signals that haven’t yet had a chance of being reported to
GDB, and so the remote stub can use the signal list specified
by this packet to know whether to deliver or ignore those pending
signals.This does not influence whether to deliver a signal as requested by a
resumption packet (see vCont packet).Signals are numbered identically to continue packets and stop replies
(see Stop Reply Packets). Each signal list item should be
strictly greater than the previous item. Multiple
‘QProgramSignals’ packets do not combine; any earlier
‘QProgramSignals’ list is completely replaced by the new list.Reply:
- ‘OK’
-
The request succeeded.
- ‘E nn’
-
An error occurred. The error number nn is given as hex digits.
- ‘’
-
An empty reply indicates that ‘QProgramSignals’ is not supported
by the stub.
Use of this packet is controlled by the
set remote program-signals
command (see set remote program-signals).
This packet is not probed by default; the remote stub must request it,
by supplying an appropriate ‘qSupported’ response (see qSupported). - ‘QThreadEvents:1’
- ‘QThreadEvents:0’
-
Enable (‘QThreadEvents:1’) or disable (‘QThreadEvents:0’)
reporting of thread create and exit events. See thread create event, for the reply specifications. For example, this is used in
non-stop mode when GDB stops a set of threads and
synchronously waits for the their corresponding stop replies. Without
exit events, if one of the threads exits, GDB would hang
forever not knowing that it should no longer expect a stop for that
same thread. GDB does not enable this feature unless the
stub reports that it supports it by including ‘QThreadEvents+’ in
its ‘qSupported’ reply.Reply:
- ‘OK’
-
The request succeeded.
- ‘E nn’
-
An error occurred. The error number nn is given as hex digits.
- ‘’
-
An empty reply indicates that ‘QThreadEvents’ is not supported by
the stub.
Use of this packet is controlled by the
set remote thread-events
command (see set remote thread-events). - ‘qRcmd,command’
-
command (hex encoded) is passed to the local interpreter for
execution. Invalid commands should be reported using the output
string. Before the final result packet, the target may also respond
with a number of intermediate ‘Ooutput’ console output
packets. Implementors should note that providing access to a
stubs’s interpreter may have security implications.Reply:
- ‘OK’
-
A command response with no output.
- ‘OUTPUT’
-
A command response with the hex encoded output string OUTPUT.
- ‘E NN’
-
Indicate a badly formed request. The error number NN is given as
hex digits. - ‘’
-
An empty reply indicates that ‘qRcmd’ is not recognized.
(Note that the
qRcmdpacket’s name is separated from the
command by a ‘,’, not a ‘:’, contrary to the naming
conventions above. Please don’t use this packet as a model for new
packets.) - ‘qSearch:memory:address;length;search-pattern’
-
Search length bytes at address for search-pattern.
Both address and length are encoded in hex;
search-pattern is a sequence of bytes, also hex encoded.Reply:
- ‘0’
-
The pattern was not found.
- ‘1,address’
-
The pattern was found at address.
- ‘E NN’
-
A badly formed request or an error was encountered while searching memory.
- ‘’
-
An empty reply indicates that ‘qSearch:memory’ is not recognized.
- ‘QStartNoAckMode’
-
Request that the remote stub disable the normal ‘+’/‘—’
protocol acknowledgments (see Packet Acknowledgment).Reply:
- ‘OK’
-
The stub has switched to no-acknowledgment mode.
GDB acknowledges this response,
but neither the stub nor GDB shall send or expect further
‘+’/‘—’ acknowledgments in the current connection. - ‘’
-
An empty reply indicates that the stub does not support no-acknowledgment mode.
- ‘qSupported [:gdbfeature [;gdbfeature]… ]’
-
Tell the remote stub about features supported by GDB, and
query the stub for features it supports. This packet allows
GDB and the remote stub to take advantage of each others’
features. ‘qSupported’ also consolidates multiple feature probes
at startup, to improve GDB performance—a single larger
packet performs better than multiple smaller probe packets on
high-latency links. Some features may enable behavior which must not
be on by default, e.g. because it would confuse older clients or
stubs. Other features may describe packets which could be
automatically probed for, but are not. These features must be
reported before GDB will use them. This “default
unsupported” behavior is not appropriate for all packets, but it
helps to keep the initial connection time under control with new
versions of GDB which support increasing numbers of packets.Reply:
- ‘stubfeature [;stubfeature]…’
-
The stub supports or does not support each returned stubfeature,
depending on the form of each stubfeature (see below for the
possible forms). - ‘’
-
An empty reply indicates that ‘qSupported’ is not recognized,
or that no features needed to be reported to GDB.
The allowed forms for each feature (either a gdbfeature in the
‘qSupported’ packet, or a stubfeature in the response)
are:- ‘name=value’
-
The remote protocol feature name is supported, and associated
with the specified value. The format of value depends
on the feature, but it must not include a semicolon. - ‘name+’
-
The remote protocol feature name is supported, and does not
need an associated value. - ‘name—’
-
The remote protocol feature name is not supported.
- ‘name?’
-
The remote protocol feature name may be supported, and
GDB should auto-detect support in some other way when it is
needed. This form will not be used for gdbfeature notifications,
but may be used for stubfeature responses.
Whenever the stub receives a ‘qSupported’ request, the
supplied set of GDB features should override any previous
request. This allows GDB to put the stub in a known
state, even if the stub had previously been communicating with
a different version of GDB.The following values of gdbfeature (for the packet sent by GDB)
are defined:- ‘multiprocess’
-
This feature indicates whether GDB supports multiprocess
extensions to the remote protocol. GDB does not use such
extensions unless the stub also reports that it supports them by
including ‘multiprocess+’ in its ‘qSupported’ reply.
See multiprocess extensions, for details. - ‘xmlRegisters’
-
This feature indicates that GDB supports the XML target
description. If the stub sees ‘xmlRegisters=’ with target
specific strings separated by a comma, it will report register
description. - ‘qRelocInsn’
-
This feature indicates whether GDB supports the
‘qRelocInsn’ packet (see Relocate
instruction reply packet). - ‘swbreak’
-
This feature indicates whether GDB supports the swbreak stop
reason in stop replies. See swbreak stop reason, for details. - ‘hwbreak’
-
This feature indicates whether GDB supports the hwbreak stop
reason in stop replies. See swbreak stop reason, for details. - ‘fork-events’
-
This feature indicates whether GDB supports fork event
extensions to the remote protocol. GDB does not use such
extensions unless the stub also reports that it supports them by
including ‘fork-events+’ in its ‘qSupported’ reply. - ‘vfork-events’
-
This feature indicates whether GDB supports vfork event
extensions to the remote protocol. GDB does not use such
extensions unless the stub also reports that it supports them by
including ‘vfork-events+’ in its ‘qSupported’ reply. - ‘exec-events’
-
This feature indicates whether GDB supports exec event
extensions to the remote protocol. GDB does not use such
extensions unless the stub also reports that it supports them by
including ‘exec-events+’ in its ‘qSupported’ reply. - ‘vContSupported’
-
This feature indicates whether GDB wants to know the
supported actions in the reply to ‘vCont?’ packet.
Stubs should ignore any unknown values for
gdbfeature. Any GDB which sends a ‘qSupported’
packet supports receiving packets of unlimited length (earlier
versions of GDB may reject overly long responses). Additional values
for gdbfeature may be defined in the future to let the stub take
advantage of new features in GDB, e.g. incompatible
improvements in the remote protocol—the ‘multiprocess’ feature is
an example of such a feature. The stub’s reply should be independent
of the gdbfeature entries sent by GDB; first GDB
describes all the features it supports, and then the stub replies with
all the features it supports.Similarly, GDB will silently ignore unrecognized stub feature
responses, as long as each response uses one of the standard forms.Some features are flags. A stub which supports a flag feature
should respond with a ‘+’ form response. Other features
require values, and the stub should respond with an ‘=’
form response.Each feature has a default value, which GDB will use if
‘qSupported’ is not available or if the feature is not mentioned
in the ‘qSupported’ response. The default values are fixed; a
stub is free to omit any feature responses that match the defaults.Not all features can be probed, but for those which can, the probing
mechanism is useful: in some cases, a stub’s internal
architecture may not allow the protocol layer to know some information
about the underlying target in advance. This is especially common in
stubs which may be configured for multiple targets.These are the currently defined stub features and their properties:
Feature Name Value Required Default Probe Allowed ‘PacketSize’ Yes ‘—’ No ‘qXfer:auxv:read’ No ‘—’ Yes ‘qXfer:btrace:read’ No ‘—’ Yes ‘qXfer:btrace-conf:read’ No ‘—’ Yes ‘qXfer:exec-file:read’ No ‘—’ Yes ‘qXfer:features:read’ No ‘—’ Yes ‘qXfer:libraries:read’ No ‘—’ Yes ‘qXfer:libraries-svr4:read’ No ‘—’ Yes ‘augmented-libraries-svr4-read’ No ‘—’ No ‘qXfer:memory-map:read’ No ‘—’ Yes ‘qXfer:sdata:read’ No ‘—’ Yes ‘qXfer:siginfo:read’ No ‘—’ Yes ‘qXfer:siginfo:write’ No ‘—’ Yes ‘qXfer:threads:read’ No ‘—’ Yes ‘qXfer:traceframe-info:read’ No ‘—’ Yes ‘qXfer:uib:read’ No ‘—’ Yes ‘qXfer:fdpic:read’ No ‘—’ Yes ‘Qbtrace:off’ Yes ‘—’ Yes ‘Qbtrace:bts’ Yes ‘—’ Yes ‘Qbtrace:pt’ Yes ‘—’ Yes ‘Qbtrace-conf:bts:size’ Yes ‘—’ Yes ‘Qbtrace-conf:pt:size’ Yes ‘—’ Yes ‘QNonStop’ No ‘—’ Yes ‘QCatchSyscalls’ No ‘—’ Yes ‘QPassSignals’ No ‘—’ Yes ‘QStartNoAckMode’ No ‘—’ Yes ‘multiprocess’ No ‘—’ No ‘ConditionalBreakpoints’ No ‘—’ No ‘ConditionalTracepoints’ No ‘—’ No ‘ReverseContinue’ No ‘—’ No ‘ReverseStep’ No ‘—’ No ‘TracepointSource’ No ‘—’ No ‘QAgent’ No ‘—’ No ‘QAllow’ No ‘—’ No ‘QDisableRandomization’ No ‘—’ No ‘EnableDisableTracepoints’ No ‘—’ No ‘QTBuffer:size’ No ‘—’ No ‘tracenz’ No ‘—’ No ‘BreakpointCommands’ No ‘—’ No ‘swbreak’ No ‘—’ No ‘hwbreak’ No ‘—’ No ‘fork-events’ No ‘—’ No ‘vfork-events’ No ‘—’ No ‘exec-events’ No ‘—’ No ‘QThreadEvents’ No ‘—’ No ‘no-resumed’ No ‘—’ No ‘memory-tagging’ No ‘—’ No These are the currently defined stub features, in more detail:
- ‘PacketSize=bytes’
-
The remote stub can accept packets up to at least bytes in
length. GDB will send packets up to this size for bulk
transfers, and will never send larger packets. This is a limit on the
data characters in the packet, including the frame and checksum.
There is no trailing NUL byte in a remote protocol packet; if the stub
stores packets in a NUL-terminated format, it should allow an extra
byte in its buffer for the NUL. If this stub feature is not supported,
GDB guesses based on the size of the ‘g’ packet response. - ‘qXfer:auxv:read’
-
The remote stub understands the ‘qXfer:auxv:read’ packet
(see qXfer auxiliary vector read). - ‘qXfer:btrace:read’
-
The remote stub understands the ‘qXfer:btrace:read’
packet (see qXfer btrace read). - ‘qXfer:btrace-conf:read’
-
The remote stub understands the ‘qXfer:btrace-conf:read’
packet (see qXfer btrace-conf read). - ‘qXfer:exec-file:read’
-
The remote stub understands the ‘qXfer:exec-file:read’ packet
(see qXfer executable filename read). - ‘qXfer:features:read’
-
The remote stub understands the ‘qXfer:features:read’ packet
(see qXfer target description read). - ‘qXfer:libraries:read’
-
The remote stub understands the ‘qXfer:libraries:read’ packet
(see qXfer library list read). - ‘qXfer:libraries-svr4:read’
-
The remote stub understands the ‘qXfer:libraries-svr4:read’ packet
(see qXfer svr4 library list read). - ‘augmented-libraries-svr4-read’
-
The remote stub understands the augmented form of the
‘qXfer:libraries-svr4:read’ packet
(see qXfer svr4 library list read). - ‘qXfer:memory-map:read’
-
The remote stub understands the ‘qXfer:memory-map:read’ packet
(see qXfer memory map read). - ‘qXfer:sdata:read’
-
The remote stub understands the ‘qXfer:sdata:read’ packet
(see qXfer sdata read). - ‘qXfer:siginfo:read’
-
The remote stub understands the ‘qXfer:siginfo:read’ packet
(see qXfer siginfo read). - ‘qXfer:siginfo:write’
-
The remote stub understands the ‘qXfer:siginfo:write’ packet
(see qXfer siginfo write). - ‘qXfer:threads:read’
-
The remote stub understands the ‘qXfer:threads:read’ packet
(see qXfer threads read). - ‘qXfer:traceframe-info:read’
-
The remote stub understands the ‘qXfer:traceframe-info:read’
packet (see qXfer traceframe info read). - ‘qXfer:uib:read’
-
The remote stub understands the ‘qXfer:uib:read’
packet (see qXfer unwind info block). - ‘qXfer:fdpic:read’
-
The remote stub understands the ‘qXfer:fdpic:read’
packet (see qXfer fdpic loadmap read). - ‘QNonStop’
-
The remote stub understands the ‘QNonStop’ packet
(see QNonStop). - ‘QCatchSyscalls’
-
The remote stub understands the ‘QCatchSyscalls’ packet
(see QCatchSyscalls). - ‘QPassSignals’
-
The remote stub understands the ‘QPassSignals’ packet
(see QPassSignals). - ‘QStartNoAckMode’
-
The remote stub understands the ‘QStartNoAckMode’ packet and
prefers to operate in no-acknowledgment mode. See Packet Acknowledgment. - ‘multiprocess’
-
The remote stub understands the multiprocess extensions to the remote
protocol syntax. The multiprocess extensions affect the syntax of
thread IDs in both packets and replies (see thread-id syntax), and
add process IDs to the ‘D’ packet and ‘W’ and ‘X’
replies. Note that reporting this feature indicates support for the
syntactic extensions only, not that the stub necessarily supports
debugging of more than one process at a time. The stub must not use
multiprocess extensions in packet replies unless GDB has also
indicated it supports them in its ‘qSupported’ request. - ‘qXfer:osdata:read’
-
The remote stub understands the ‘qXfer:osdata:read’ packet
((see qXfer osdata read). - ‘ConditionalBreakpoints’
-
The target accepts and implements evaluation of conditional expressions
defined for breakpoints. The target will only report breakpoint triggers
when such conditions are true (see Break Conditions). - ‘ConditionalTracepoints’
-
The remote stub accepts and implements conditional expressions defined
for tracepoints (see Tracepoint Conditions). - ‘ReverseContinue’
-
The remote stub accepts and implements the reverse continue packet
(see bc). - ‘ReverseStep’
-
The remote stub accepts and implements the reverse step packet
(see bs). - ‘TracepointSource’
-
The remote stub understands the ‘QTDPsrc’ packet that supplies
the source form of tracepoint definitions. - ‘QAgent’
-
The remote stub understands the ‘QAgent’ packet.
- ‘QAllow’
-
The remote stub understands the ‘QAllow’ packet.
- ‘QDisableRandomization’
-
The remote stub understands the ‘QDisableRandomization’ packet.
- ‘StaticTracepoint’
-
The remote stub supports static tracepoints.
- ‘InstallInTrace’
-
The remote stub supports installing tracepoint in tracing.
- ‘EnableDisableTracepoints’
-
The remote stub supports the ‘QTEnable’ (see QTEnable) and
‘QTDisable’ (see QTDisable) packets that allow tracepoints
to be enabled and disabled while a trace experiment is running. - ‘QTBuffer:size’
-
The remote stub supports the ‘QTBuffer:size’ (see QTBuffer-size)
packet that allows to change the size of the trace buffer. - ‘tracenz’
-
The remote stub supports the ‘tracenz’ bytecode for collecting strings.
See Bytecode Descriptions for details about the bytecode. - ‘BreakpointCommands’
-
The remote stub supports running a breakpoint’s command list itself,
rather than reporting the hit to GDB. - ‘Qbtrace:off’
-
The remote stub understands the ‘Qbtrace:off’ packet.
- ‘Qbtrace:bts’
-
The remote stub understands the ‘Qbtrace:bts’ packet.
- ‘Qbtrace:pt’
-
The remote stub understands the ‘Qbtrace:pt’ packet.
- ‘Qbtrace-conf:bts:size’
-
The remote stub understands the ‘Qbtrace-conf:bts:size’ packet.
- ‘Qbtrace-conf:pt:size’
-
The remote stub understands the ‘Qbtrace-conf:pt:size’ packet.
- ‘swbreak’
-
The remote stub reports the ‘swbreak’ stop reason for memory
breakpoints. - ‘hwbreak’
-
The remote stub reports the ‘hwbreak’ stop reason for hardware
breakpoints. - ‘fork-events’
-
The remote stub reports the ‘fork’ stop reason for fork events.
- ‘vfork-events’
-
The remote stub reports the ‘vfork’ stop reason for vfork events
and vforkdone events. - ‘exec-events’
-
The remote stub reports the ‘exec’ stop reason for exec events.
- ‘vContSupported’
-
The remote stub reports the supported actions in the reply to
‘vCont?’ packet. - ‘QThreadEvents’
-
The remote stub understands the ‘QThreadEvents’ packet.
- ‘no-resumed’
-
The remote stub reports the ‘N’ stop reply.
- ‘memory-tagging’
-
The remote stub supports and implements the required memory tagging
functionality and understands the ‘qMemTags’ (see qMemTags) and
‘QMemTags’ (see QMemTags) packets.For AArch64 GNU/Linux systems, this feature also requires access to the
/proc/pid/smaps file so memory mapping page flags can be inspected.
This is done via the ‘vFile’ requests.
- ‘qSymbol::’
-
Notify the target that GDB is prepared to serve symbol lookup
requests. Accept requests from the target for the values of symbols.Reply:
- ‘OK’
-
The target does not need to look up any (more) symbols.
- ‘qSymbol:sym_name’
-
The target requests the value of symbol sym_name (hex encoded).
GDB may provide the value by using the
‘qSymbol:sym_value:sym_name’ message, described
below.
- ‘qSymbol:sym_value:sym_name’
-
Set the value of sym_name to sym_value.
sym_name (hex encoded) is the name of a symbol whose value the
target has previously requested.sym_value (hex) is the value for symbol sym_name. If
GDB cannot supply a value for sym_name, then this field
will be empty.Reply:
- ‘OK’
-
The target does not need to look up any (more) symbols.
- ‘qSymbol:sym_name’
-
The target requests the value of a new symbol sym_name (hex
encoded). GDB will continue to supply the values of symbols
(if available), until the target ceases to request them.
- ‘qTBuffer’
- ‘QTBuffer’
- ‘QTDisconnected’
- ‘QTDP’
- ‘QTDPsrc’
- ‘QTDV’
- ‘qTfP’
- ‘qTfV’
- ‘QTFrame’
- ‘qTMinFTPILen’
-
See Tracepoint Packets.
- ‘qThreadExtraInfo,thread-id’
-
Obtain from the target OS a printable string description of thread
attributes for the thread thread-id; see thread-id syntax,
for the forms of thread-id. This
string may contain anything that the target OS thinks is interesting
for GDB to tell the user about the thread. The string is
displayed in GDB’sinfo threadsdisplay. Some
examples of possible thread extra info strings are ‘Runnable’, or
‘Blocked on Mutex’.Reply:
- ‘XX…’
-
Where ‘XX…’ is a hex encoding of ASCII data,
comprising the printable string containing the extra information about
the thread’s attributes.
(Note that the
qThreadExtraInfopacket’s name is separated from
the command by a ‘,’, not a ‘:’, contrary to the naming
conventions above. Please don’t use this packet as a model for new
packets.) - ‘QTNotes’
- ‘qTP’
- ‘QTSave’
- ‘qTsP’
- ‘qTsV’
- ‘QTStart’
- ‘QTStop’
- ‘QTEnable’
- ‘QTDisable’
- ‘QTinit’
- ‘QTro’
- ‘qTStatus’
- ‘qTV’
- ‘qTfSTM’
- ‘qTsSTM’
- ‘qTSTMat’
-
See Tracepoint Packets.
- ‘qXfer:object:read:annex:offset,length’
-
Read uninterpreted bytes from the target’s special data area
identified by the keyword object. Request length bytes
starting at offset bytes into the data. The content and
encoding of annex is specific to object; it can supply
additional details about what data to access.Reply:
- ‘m data’
-
Data data (see Binary Data) has been read from the
target. There may be more data at a higher address (although
it is permitted to return ‘m’ even for the last valid
block of data, as long as at least one byte of data was read).
It is possible for data to have fewer bytes than the length in the
request. - ‘l data’
-
Data data (see Binary Data) has been read from the target.
There is no more data to be read. It is possible for data to
have fewer bytes than the length in the request. - ‘l’
-
The offset in the request is at the end of the data.
There is no more data to be read. - ‘E00’
-
The request was malformed, or annex was invalid.
- ‘E nn’
-
The offset was invalid, or there was an error encountered reading the data.
The nn part is a hex-encodederrnovalue. - ‘’
-
An empty reply indicates the object string was not recognized by
the stub, or that the object does not support reading.
Here are the specific requests of this form defined so far. All the
‘qXfer:object:read:…’ requests use the same reply
formats, listed above.- ‘qXfer:auxv:read::offset,length’
-
Access the target’s auxiliary vector. See auxiliary vector. Note annex must be empty.
This packet is not probed by default; the remote stub must request it,
by supplying an appropriate ‘qSupported’ response (see qSupported). - ‘qXfer:btrace:read:annex:offset,length’
-
Return a description of the current branch trace.
See Branch Trace Format. The annex part of the generic ‘qXfer’
packet may have one of the following values:all-
Returns all available branch trace.
new-
Returns all available branch trace if the branch trace changed since
the last read request. delta-
Returns the new branch trace since the last read request. Adds a new
block to the end of the trace that begins at zero and ends at the source
location of the first branch in the trace buffer. This extra block is
used to stitch traces together.If the trace buffer overflowed, returns an error indicating the overflow.
This packet is not probed by default; the remote stub must request it
by supplying an appropriate ‘qSupported’ response (see qSupported). - ‘qXfer:btrace-conf:read::offset,length’
-
Return a description of the current branch trace configuration.
See Branch Trace Configuration Format.This packet is not probed by default; the remote stub must request it
by supplying an appropriate ‘qSupported’ response (see qSupported). - ‘qXfer:exec-file:read:annex:offset,length’
-
Return the full absolute name of the file that was executed to create
a process running on the remote system. The annex specifies the
numeric process ID of the process to query, encoded as a hexadecimal
number. If the annex part is empty the remote stub should return the
filename corresponding to the currently executing process.This packet is not probed by default; the remote stub must request it,
by supplying an appropriate ‘qSupported’ response (see qSupported). - ‘qXfer:features:read:annex:offset,length’
-
Access the target description. See Target Descriptions. The
annex specifies which XML document to access. The main description is
always loaded from the ‘target.xml’ annex.This packet is not probed by default; the remote stub must request it,
by supplying an appropriate ‘qSupported’ response (see qSupported). - ‘qXfer:libraries:read:annex:offset,length’
-
Access the target’s list of loaded libraries. See Library List Format.
The annex part of the generic ‘qXfer’ packet must be empty
(see qXfer read).Targets which maintain a list of libraries in the program’s memory do
not need to implement this packet; it is designed for platforms where
the operating system manages the list of loaded libraries.This packet is not probed by default; the remote stub must request it,
by supplying an appropriate ‘qSupported’ response (see qSupported). - ‘qXfer:libraries-svr4:read:annex:offset,length’
-
Access the target’s list of loaded libraries when the target is an SVR4
platform. See Library List Format for SVR4 Targets. The annex part
of the generic ‘qXfer’ packet must be empty unless the remote
stub indicated it supports the augmented form of this packet
by supplying an appropriate ‘qSupported’ response
(see qXfer read, qSupported).This packet is optional for better performance on SVR4 targets.
GDB uses memory read packets to read the SVR4 library list otherwise.This packet is not probed by default; the remote stub must request it,
by supplying an appropriate ‘qSupported’ response (see qSupported).If the remote stub indicates it supports the augmented form of this
packet then the annex part of the generic ‘qXfer’ packet may
contain a semicolon-separated list of ‘name=value’
arguments. The currently supported arguments are:start=address-
A hexadecimal number specifying the address of the ‘struct
link_map’ to start reading the library list from. If unset or zero
then the first ‘struct link_map’ in the library list will be
chosen as the starting point. prev=address-
A hexadecimal number specifying the address of the ‘struct
link_map’ immediately preceding the ‘struct link_map’
specified by the ‘start’ argument. If unset or zero then
the remote stub will expect that no ‘struct link_map’
exists prior to the starting point. lmid=lmid-
A hexadecimal number specifying a namespace identifier. This is
currently only used together with ‘start’ to provide the
namespace identifier back to GDB in the response.
GDB will only provide values that were previously reported to
it. If unset, the response will include ‘lmid=»0x0″’.
Arguments that are not understood by the remote stub will be silently
ignored. - ‘qXfer:memory-map:read::offset,length’
-
Access the target’s memory-map. See Memory Map Format. The
annex part of the generic ‘qXfer’ packet must be empty
(see qXfer read).This packet is not probed by default; the remote stub must request it,
by supplying an appropriate ‘qSupported’ response (see qSupported). - ‘qXfer:sdata:read::offset,length’
-
Read contents of the extra collected static tracepoint marker
information. The annex part of the generic ‘qXfer’ packet must
be empty (see qXfer read). See Tracepoint
Action Lists.This packet is not probed by default; the remote stub must request it,
by supplying an appropriate ‘qSupported’ response
(see qSupported). - ‘qXfer:siginfo:read::offset,length’
-
Read contents of the extra signal information on the target
system. The annex part of the generic ‘qXfer’ packet must be
empty (see qXfer read).This packet is not probed by default; the remote stub must request it,
by supplying an appropriate ‘qSupported’ response
(see qSupported). - ‘qXfer:threads:read::offset,length’
-
Access the list of threads on target. See Thread List Format. The
annex part of the generic ‘qXfer’ packet must be empty
(see qXfer read).This packet is not probed by default; the remote stub must request it,
by supplying an appropriate ‘qSupported’ response (see qSupported). - ‘qXfer:traceframe-info:read::offset,length’
-
Return a description of the current traceframe’s contents.
See Traceframe Info Format. The annex part of the generic
‘qXfer’ packet must be empty (see qXfer read).This packet is not probed by default; the remote stub must request it,
by supplying an appropriate ‘qSupported’ response (see qSupported). - ‘qXfer:uib:read:pc:offset,length’
-
Return the unwind information block for pc. This packet is used
on OpenVMS/ia64 to ask the kernel unwind information.This packet is not probed by default.
- ‘qXfer:fdpic:read:annex:offset,length’
-
Read contents of
loadmaps on the target system. The
annex, either ‘exec’ or ‘interp’, specifies whichloadmap,
executableloadmapor interpreterloadmapto read.This packet is not probed by default; the remote stub must request it,
by supplying an appropriate ‘qSupported’ response (see qSupported). - ‘qXfer:osdata:read::offset,length’
-
Access the target’s operating system information.
See Operating System Information.
- ‘qXfer:object:write:annex:offset:data…’
-
Write uninterpreted bytes into the target’s special data area
identified by the keyword object, starting at offset bytes
into the data. The binary-encoded data (see Binary Data) to be
written is given by data…. The content and encoding of annex
is specific to object; it can supply additional details about what data
to access.Reply:
- ‘nn’
-
nn (hex encoded) is the number of bytes written.
This may be fewer bytes than supplied in the request. - ‘E00’
-
The request was malformed, or annex was invalid.
- ‘E nn’
-
The offset was invalid, or there was an error encountered writing the data.
The nn part is a hex-encodederrnovalue. - ‘’
-
An empty reply indicates the object string was not
recognized by the stub, or that the object does not support writing.
Here are the specific requests of this form defined so far. All the
‘qXfer:object:write:…’ requests use the same reply
formats, listed above.- ‘qXfer:siginfo:write::offset:data…’
-
Write data to the extra signal information on the target system.
The annex part of the generic ‘qXfer’ packet must be
empty (see qXfer write).This packet is not probed by default; the remote stub must request it,
by supplying an appropriate ‘qSupported’ response
(see qSupported).
- ‘qXfer:object:operation:…’
-
Requests of this form may be added in the future. When a stub does
not recognize the object keyword, or its support for
object does not recognize the operation keyword, the stub
must respond with an empty packet. - ‘qAttached:pid’
-
Return an indication of whether the remote server attached to an
existing process or created a new process. When the multiprocess
protocol extensions are supported (see multiprocess extensions),
pid is an integer in hexadecimal format identifying the target
process. Otherwise, GDB will omit the pid field and
the query packet will be simplified as ‘qAttached’.This query is used, for example, to know whether the remote process
should be detached or killed when a GDB session is ended with
thequitcommand.Reply:
- ‘1’
-
The remote server attached to an existing process.
- ‘0’
-
The remote server created a new process.
- ‘E NN’
-
A badly formed request or an error was encountered.
- ‘Qbtrace:bts’
-
Enable branch tracing for the current thread using Branch Trace Store.
Reply:
- ‘OK’
-
Branch tracing has been enabled.
- ‘E.errtext’
-
A badly formed request or an error was encountered.
- ‘Qbtrace:pt’
-
Enable branch tracing for the current thread using Intel Processor Trace.
Reply:
- ‘OK’
-
Branch tracing has been enabled.
- ‘E.errtext’
-
A badly formed request or an error was encountered.
- ‘Qbtrace:off’
-
Disable branch tracing for the current thread.
Reply:
- ‘OK’
-
Branch tracing has been disabled.
- ‘E.errtext’
-
A badly formed request or an error was encountered.
- ‘Qbtrace-conf:bts:size=value’
-
Set the requested ring buffer size for new threads that use the
btrace recording method in bts format.Reply:
- ‘OK’
-
The ring buffer size has been set.
- ‘E.errtext’
-
A badly formed request or an error was encountered.
- ‘Qbtrace-conf:pt:size=value’
-
Set the requested ring buffer size for new threads that use the
btrace recording method in pt format.Reply:
- ‘OK’
-
The ring buffer size has been set.
- ‘E.errtext’
-
A badly formed request or an error was encountered.
E.5 Architecture-Specific Protocol Details
This section describes how the remote protocol is applied to specific
target architectures. Also see Standard Target Features, for
details of XML target descriptions for each architecture.
E.5.1 ARM-specific Protocol Details
E.5.1.1 ARM Breakpoint Kinds
These breakpoint kinds are defined for the ‘Z0’ and ‘Z1’ packets.
- 2
-
16-bit Thumb mode breakpoint.
- 3
-
32-bit Thumb mode (Thumb-2) breakpoint.
- 4
-
32-bit ARM mode breakpoint.
E.5.1.2 ARM Memory Tag Types
These memory tag types are defined for the ‘qMemTag’ and ‘QMemTag’
packets.
- 0
-
MTE logical tag
- 1
-
MTE allocation tag
E.5.2 MIPS-specific Protocol Details
E.5.2.1 MIPS Register Packet Format
The following g/G packets have previously been defined.
In the below, some thirty-two bit registers are transferred as
sixty-four bits. Those registers should be zero/sign extended (which?)
to fill the space allocated. Register bytes are transferred in target
byte order. The two nibbles within a register byte are transferred
most-significant – least-significant.
- MIPS32
-
All registers are transferred as thirty-two bit quantities in the order:
32 general-purpose; sr; lo; hi; bad; cause; pc; 32 floating-point
registers; fsr; fir; fp. - MIPS64
-
All registers are transferred as sixty-four bit quantities (including
thirty-two bit registers such assr). The ordering is the same
asMIPS32.
E.5.2.2 MIPS Breakpoint Kinds
These breakpoint kinds are defined for the ‘Z0’ and ‘Z1’ packets.
- 2
-
16-bit MIPS16 mode breakpoint.
- 3
-
16-bit microMIPS mode breakpoint.
- 4
-
32-bit standard MIPS mode breakpoint.
- 5
-
32-bit microMIPS mode breakpoint.
E.6 Tracepoint Packets
Here we describe the packets GDB uses to implement
tracepoints (see Tracepoints).
- ‘QTDP:n:addr:ena:step:pass[:Fflen][:Xlen,bytes][—]’
-
Create a new tracepoint, number n, at addr. If ena
is ‘E’, then the tracepoint is enabled; if it is ‘D’, then
the tracepoint is disabled. The step gives the tracepoint’s step
count, and pass gives its pass count. If an ‘F’ is present,
then the tracepoint is to be a fast tracepoint, and the flen is
the number of bytes that the target should copy elsewhere to make room
for the tracepoint. If an ‘X’ is present, it introduces a
tracepoint condition, which consists of a hexadecimal length, followed
by a comma and hex-encoded bytes, in a manner similar to action
encodings as described below. If the trailing ‘—’ is present,
further ‘QTDP’ packets will follow to specify this tracepoint’s
actions.Replies:
- ‘OK’
-
The packet was understood and carried out.
- ‘qRelocInsn’
-
See Relocate instruction reply packet.
- ‘’
-
The packet was not recognized.
- ‘QTDP:-n:addr:[S]action…[—]’
-
Define actions to be taken when a tracepoint is hit. The n and
addr must be the same as in the initial ‘QTDP’ packet for
this tracepoint. This packet may only be sent immediately after
another ‘QTDP’ packet that ended with a ‘—’. If the
trailing ‘—’ is present, further ‘QTDP’ packets will follow,
specifying more actions for this tracepoint.In the series of action packets for a given tracepoint, at most one
can have an ‘S’ before its first action. If such a packet
is sent, it and the following packets define “while-stepping”
actions. Any prior packets define ordinary actions — that is, those
taken when the tracepoint is first hit. If no action packet has an
‘S’, then all the packets in the series specify ordinary
tracepoint actions.The ‘action…’ portion of the packet is a series of
actions, concatenated without separators. Each action has one of the
following forms:- ‘R mask’
-
Collect the registers whose bits are set in mask,
a hexadecimal number whose i’th bit is set if register number
i should be collected. (The least significant bit is numbered
zero.) Note that mask may be any number of digits long; it may
not fit in a 32-bit word. - ‘M basereg,offset,len’
-
Collect len bytes of memory starting at the address in register
number basereg, plus offset. If basereg is
‘-1’, then the range has a fixed address: offset is the
address of the lowest byte to collect. The basereg,
offset, and len parameters are all unsigned hexadecimal
values (the ‘-1’ value for basereg is a special case). - ‘X len,expr’
-
Evaluate expr, whose length is len, and collect memory as
it directs. The agent expression expr is as described in
Agent Expressions. Each byte of the expression is encoded as a
two-digit hex number in the packet; len is the number of bytes
in the expression (and thus one-half the number of hex digits in the
packet).
Any number of actions may be packed together in a single ‘QTDP’
packet, as long as the packet does not exceed the maximum packet
length (400 bytes, for many stubs). There may be only one ‘R’
action per tracepoint, and it must precede any ‘M’ or ‘X’
actions. Any registers referred to by ‘M’ and ‘X’ actions
must be collected by a preceding ‘R’ action. (The
“while-stepping” actions are treated as if they were attached to a
separate tracepoint, as far as these restrictions are concerned.)Replies:
- ‘OK’
-
The packet was understood and carried out.
- ‘qRelocInsn’
-
See Relocate instruction reply packet.
- ‘’
-
The packet was not recognized.
- ‘QTDPsrc:n:addr:type:start:slen:bytes’
-
Specify a source string of tracepoint n at address addr.
This is useful to get accurate reproduction of the tracepoints
originally downloaded at the beginning of the trace run. The type
is the name of the tracepoint part, such as ‘cond’ for the
tracepoint’s conditional expression (see below for a list of types), while
bytes is the string, encoded in hexadecimal.start is the offset of the bytes within the overall source
string, while slen is the total length of the source string.
This is intended for handling source strings that are longer than will
fit in a single packet.The available string types are ‘at’ for the location,
‘cond’ for the conditional, and ‘cmd’ for an action command.
GDB sends a separate packet for each command in the action
list, in the same order in which the commands are stored in the list.The target does not need to do anything with source strings except
report them back as part of the replies to the ‘qTfP’/‘qTsP’
query packets.Although this packet is optional, and GDB will only send it
if the target replies with ‘TracepointSource’ See General Query Packets, it makes both disconnected tracing and trace files
much easier to use. Otherwise the user must be careful that the
tracepoints in effect while looking at trace frames are identical to
the ones in effect during the trace run; even a small discrepancy
could cause ‘tdump’ not to work, or a particular trace frame not
be found. - ‘QTDV:n:value:builtin:name’
-
Create a new trace state variable, number n, with an initial
value of value, which is a 64-bit signed integer. Both n
and value are encoded as hexadecimal values. GDB has
the option of not using this packet for initial values of zero; the
target should simply create the trace state variables as they are
mentioned in expressions. The value builtin should be 1 (one)
if the trace state variable is builtin and 0 (zero) if it is not builtin.
GDB only sets builtin to 1 if a previous ‘qTfV’ or
‘qTsV’ packet had it set. The contents of name is the
hex-encoded name (without the leading ‘$’) of the trace state
variable. - ‘QTFrame:n’
-
Select the n’th tracepoint frame from the buffer, and use the
register and memory contents recorded there to answer subsequent
request packets from GDB.A successful reply from the stub indicates that the stub has found the
requested frame. The response is a series of parts, concatenated
without separators, describing the frame we selected. Each part has
one of the following forms:- ‘F f’
-
The selected frame is number n in the trace frame buffer;
f is a hexadecimal number. If f is ‘-1’, then there
was no frame matching the criteria in the request packet. - ‘T t’
-
The selected trace frame records a hit of tracepoint number t;
t is a hexadecimal number.
- ‘QTFrame:pc:addr’
-
Like ‘QTFrame:n’, but select the first tracepoint frame after the
currently selected frame whose PC is addr;
addr is a hexadecimal number. - ‘QTFrame:tdp:t’
-
Like ‘QTFrame:n’, but select the first tracepoint frame after the
currently selected frame that is a hit of tracepoint t; t
is a hexadecimal number. - ‘QTFrame:range:start:end’
-
Like ‘QTFrame:n’, but select the first tracepoint frame after the
currently selected frame whose PC is between start (inclusive)
and end (inclusive); start and end are hexadecimal
numbers. - ‘QTFrame:outside:start:end’
-
Like ‘QTFrame:range:start:end’, but select the first
frame outside the given range of addresses (exclusive). - ‘qTMinFTPILen’
-
This packet requests the minimum length of instruction at which a fast
tracepoint (see Set Tracepoints) may be placed. For instance, on
the 32-bit x86 architecture, it is possible to use a 4-byte jump, but
it depends on the target system being able to create trampolines in
the first 64K of memory, which might or might not be possible for that
system. So the reply to this packet will be 4 if it is able to
arrange for that.Replies:
- ‘0’
-
The minimum instruction length is currently unknown.
- ‘length’
-
The minimum instruction length is length, where length
is a hexadecimal number greater or equal to 1. A reply
of 1 means that a fast tracepoint may be placed on any instruction
regardless of size. - ‘E’
-
An error has occurred.
- ‘’
-
An empty reply indicates that the request is not supported by the stub.
- ‘QTStart’
-
Begin the tracepoint experiment. Begin collecting data from
tracepoint hits in the trace frame buffer. This packet supports the
‘qRelocInsn’ reply (see Relocate
instruction reply packet). - ‘QTStop’
-
End the tracepoint experiment. Stop collecting trace frames.
- ‘QTEnable:n:addr’
-
Enable tracepoint n at address addr in a started tracepoint
experiment. If the tracepoint was previously disabled, then collection
of data from it will resume. - ‘QTDisable:n:addr’
-
Disable tracepoint n at address addr in a started tracepoint
experiment. No more data will be collected from the tracepoint unless
‘QTEnable:n:addr’ is subsequently issued. - ‘QTinit’
-
Clear the table of tracepoints, and empty the trace frame buffer.
- ‘QTro:start1,end1:start2,end2:…’
-
Establish the given ranges of memory as “transparent”. The stub
will answer requests for these ranges from memory’s current contents,
if they were not collected as part of the tracepoint hit.GDB uses this to mark read-only regions of memory, like those
containing program code. Since these areas never change, they should
still have the same contents they did when the tracepoint was hit, so
there’s no reason for the stub to refuse to provide their contents. - ‘QTDisconnected:value’
-
Set the choice to what to do with the tracing run when GDB
disconnects from the target. A value of 1 directs the target to
continue the tracing run, while 0 tells the target to stop tracing if
GDB is no longer in the picture. - ‘qTStatus’
-
Ask the stub if there is a trace experiment running right now.
The reply has the form:
- ‘Trunning[;field]…’
-
running is a single digit
1if the trace is presently
running, or0if not. It is followed by semicolon-separated
optional fields that an agent may use to report additional status.
If the trace is not running, the agent may report any of several
explanations as one of the optional fields:- ‘tnotrun:0’
-
No trace has been run yet.
- ‘tstop[:text]:0’
-
The trace was stopped by a user-originated stop command. The optional
text field is a user-supplied string supplied as part of the
stop command (for instance, an explanation of why the trace was
stopped manually). It is hex-encoded. - ‘tfull:0’
-
The trace stopped because the trace buffer filled up.
- ‘tdisconnected:0’
-
The trace stopped because GDB disconnected from the target.
- ‘tpasscount:tpnum’
-
The trace stopped because tracepoint tpnum exceeded its pass count.
- ‘terror:text:tpnum’
-
The trace stopped because tracepoint tpnum had an error. The
string text is available to describe the nature of the error
(for instance, a divide by zero in the condition expression); it
is hex encoded. - ‘tunknown:0’
-
The trace stopped for some other reason.
Additional optional fields supply statistical and other information.
Although not required, they are extremely useful for users monitoring
the progress of a trace run. If a trace has stopped, and these
numbers are reported, they must reflect the state of the just-stopped
trace.- ‘tframes:n’
-
The number of trace frames in the buffer.
- ‘tcreated:n’
-
The total number of trace frames created during the run. This may
be larger than the trace frame count, if the buffer is circular. - ‘tsize:n’
-
The total size of the trace buffer, in bytes.
- ‘tfree:n’
-
The number of bytes still unused in the buffer.
- ‘circular:n’
-
The value of the circular trace buffer flag.
1means that the
trace buffer is circular and old trace frames will be discarded if
necessary to make room,0means that the trace buffer is linear
and may fill up. - ‘disconn:n’
-
The value of the disconnected tracing flag.
1means that
tracing will continue after GDB disconnects,0means
that the trace run will stop.
- ‘qTP:tp:addr’
-
Ask the stub for the current state of tracepoint number tp at
address addr.Replies:
- ‘Vhits:usage’
-
The tracepoint has been hit hits times so far during the trace
run, and accounts for usage in the trace buffer. Note that
while-steppingsteps are not counted as separate hits, but the
steps’ space consumption is added into the usage number.
- ‘qTV:var’
-
Ask the stub for the value of the trace state variable number var.
Replies:
- ‘Vvalue’
-
The value of the variable is value. This will be the current
value of the variable if the user is examining a running target, or a
saved value if the variable was collected in the trace frame that the
user is looking at. Note that multiple requests may result in
different reply values, such as when requesting values while the
program is running. - ‘U’
-
The value of the variable is unknown. This would occur, for example,
if the user is examining a trace frame in which the requested variable
was not collected.
- ‘qTfP’
- ‘qTsP’
-
These packets request data about tracepoints that are being used by
the target. GDB sendsqTfPto get the first piece
of data, and multipleqTsPto get additional pieces. Replies
to these packets generally take the form of theQTDPpackets
that define tracepoints. (FIXME add detailed syntax) - ‘qTfV’
- ‘qTsV’
-
These packets request data about trace state variables that are on the
target. GDB sendsqTfVto get the first vari of data,
and multipleqTsVto get additional variables. Replies to
these packets follow the syntax of theQTDVpackets that define
trace state variables. - ‘qTfSTM’
- ‘qTsSTM’
-
These packets request data about static tracepoint markers that exist
in the target program. GDB sendsqTfSTMto get the
first piece of data, and multipleqTsSTMto get additional
pieces. Replies to these packets take the following form:Reply:
- ‘m address:id:extra’
-
A single marker
- ‘m address:id:extra,address:id:extra…’
-
a comma-separated list of markers
- ‘l’
-
(lower case letter ‘L’) denotes end of list.
- ‘E nn’
-
An error occurred. The error number nn is given as hex digits.
- ‘’
-
An empty reply indicates that the request is not supported by the
stub.
The address is encoded in hex;
id and extra are strings encoded in hex.In response to each query, the target will reply with a list of one or
more markers, separated by commas. GDB will respond to each
reply with a request for more markers (using the ‘qs’ form of the
query), until the target responds with ‘l’ (lower-case ell, for
last). - ‘qTSTMat:address’
-
This packets requests data about static tracepoint markers in the
target program at address. Replies to this packet follow the
syntax of the ‘qTfSTM’ andqTsSTMpackets that list static
tracepoint markers. - ‘QTSave:filename’
-
This packet directs the target to save trace data to the file name
filename in the target’s filesystem. The filename is encoded
as a hex string; the interpretation of the file name (relative vs
absolute, wild cards, etc) is up to the target. - ‘qTBuffer:offset,len’
-
Return up to len bytes of the current contents of trace buffer,
starting at offset. The trace buffer is treated as if it were
a contiguous collection of traceframes, as per the trace file format.
The reply consists as many hex-encoded bytes as the target can deliver
in a packet; it is not an error to return fewer than were asked for.
A reply consisting of justlindicates that no bytes are
available. - ‘QTBuffer:circular:value’
-
This packet directs the target to use a circular trace buffer if
value is 1, or a linear buffer if the value is 0. - ‘QTBuffer:size:size’
-
This packet directs the target to make the trace buffer be of size
size if possible. A value of-1tells the target to
use whatever size it prefers. - ‘QTNotes:[type:text][;type:text]…’
-
This packet adds optional textual notes to the trace run. Allowable
types includeuser,notes, andtstop, the
text fields are arbitrary strings, hex-encoded.
E.6.1 Relocate instruction reply packet
When installing fast tracepoints in memory, the target may need to
relocate the instruction currently at the tracepoint address to a
different address in memory. For most instructions, a simple copy is
enough, but, for example, call instructions that implicitly push the
return address on the stack, and relative branches or other
PC-relative instructions require offset adjustment, so that the effect
of executing the instruction at a different address is the same as if
it had executed in the original location.
In response to several of the tracepoint packets, the target may also
respond with a number of intermediate ‘qRelocInsn’ request
packets before the final result packet, to have GDB handle
this relocation operation. If a packet supports this mechanism, its
documentation will explicitly say so. See for example the above
descriptions for the ‘QTStart’ and ‘QTDP’ packets. The
format of the request is:
- ‘qRelocInsn:from;to’
-
This requests GDB to copy instruction at address from
to address to, possibly adjusted so that executing the
instruction at to has the same effect as executing it at
from. GDB writes the adjusted instruction to target
memory starting at to.
Replies:
- ‘qRelocInsn:adjusted_size’
-
Informs the stub the relocation is complete. The adjusted_size is
the length in bytes of resulting relocated instruction sequence. - ‘E NN’
-
A badly formed request was detected, or an error was encountered while
relocating the instruction.
E.7 Host I/O Packets
The Host I/O packets allow GDB to perform I/O
operations on the far side of a remote link. For example, Host I/O is
used to upload and download files to a remote target with its own
filesystem. Host I/O uses the same constant values and data structure
layout as the target-initiated File-I/O protocol. However, the
Host I/O packets are structured differently. The target-initiated
protocol relies on target memory to store parameters and buffers.
Host I/O requests are initiated by GDB, and the
target’s memory is not involved. See File-I/O Remote Protocol Extension, for more details on the target-initiated protocol.
The Host I/O request packets all encode a single operation along with
its arguments. They have this format:
- ‘vFile:operation: parameter…’
-
operation is the name of the particular request; the target
should compare the entire packet name up to the second colon when checking
for a supported operation. The format of parameter depends on
the operation. Numbers are always passed in hexadecimal. Negative
numbers have an explicit minus sign (i.e. two’s complement is not
used). Strings (e.g. filenames) are encoded as a series of
hexadecimal bytes. The last argument to a system call may be a
buffer of escaped binary data (see Binary Data).
The valid responses to Host I/O packets are:
- ‘F result [, errno] [; attachment]’
-
result is the integer value returned by this operation, usually
non-negative for success and -1 for errors. If an error has occured,
errno will be included in the result specifying a
value defined by the File-I/O protocol (see Errno Values). For
operations which return data, attachment supplies the data as a
binary buffer. Binary buffers in response packets are escaped in the
normal way (see Binary Data). See the individual packet
documentation for the interpretation of result and
attachment. - ‘’
-
An empty response indicates that this operation is not recognized.
These are the supported Host I/O operations:
- ‘vFile:open: filename, flags, mode’
-
Open a file at filename and return a file descriptor for it, or
return -1 if an error occurs. The filename is a string,
flags is an integer indicating a mask of open flags
(see Open Flags), and mode is an integer indicating a mask
of mode bits to use if the file is created (see mode_t Values).
See open, for details of the open flags and mode values. - ‘vFile:close: fd’
-
Close the open file corresponding to fd and return 0, or
-1 if an error occurs. - ‘vFile:pread: fd, count, offset’
-
Read data from the open file corresponding to fd. Up to
count bytes will be read from the file, starting at offset
relative to the start of the file. The target may read fewer bytes;
common reasons include packet size limits and an end-of-file
condition. The number of bytes read is returned. Zero should only be
returned for a successful read at the end of the file, or if
count was zero.The data read should be returned as a binary attachment on success.
If zero bytes were read, the response should include an empty binary
attachment (i.e. a trailing semicolon). The return value is the
number of target bytes read; the binary attachment may be longer if
some characters were escaped. - ‘vFile:pwrite: fd, offset, data’
-
Write data (a binary buffer) to the open file corresponding
to fd. Start the write at offset from the start of the
file. Unlike manywritesystem calls, there is no
separate count argument; the length of data in the
packet is used. ‘vFile:pwrite’ returns the number of bytes written,
which may be shorter than the length of data, or -1 if an
error occurred. - ‘vFile:fstat: fd’
-
Get information about the open file corresponding to fd.
On success the information is returned as a binary attachment
and the return value is the size of this attachment in bytes.
If an error occurs the return value is -1. The format of the
returned binary attachment is as described in struct stat. - ‘vFile:unlink: filename’
-
Delete the file at filename on the target. Return 0,
or -1 if an error occurs. The filename is a string. - ‘vFile:readlink: filename’
-
Read value of symbolic link filename on the target. Return
the number of bytes read, or -1 if an error occurs.The data read should be returned as a binary attachment on success.
If zero bytes were read, the response should include an empty binary
attachment (i.e. a trailing semicolon). The return value is the
number of target bytes read; the binary attachment may be longer if
some characters were escaped. - ‘vFile:setfs: pid’
-
Select the filesystem on which
vFileoperations with
filename arguments will operate. This is required for
GDB to be able to access files on remote targets where
the remote stub does not share a common filesystem with the
inferior(s).If pid is nonzero, select the filesystem as seen by process
pid. If pid is zero, select the filesystem as seen by
the remote stub. Return 0 on success, or -1 if an error occurs.
IfvFile:setfs:indicates success, the selected filesystem
remains selected until the next successfulvFile:setfs:
operation.
E.8 Interrupts
In all-stop mode, when a program on the remote target is running,
GDB may attempt to interrupt it by sending a ‘Ctrl-C’,
BREAK or a BREAK followed by g, control of which
is specified via GDB’s ‘interrupt-sequence’.
The precise meaning of BREAK is defined by the transport
mechanism and may, in fact, be undefined. GDB does not
currently define a BREAK mechanism for any of the network
interfaces except for TCP, in which case GDB sends the
telnet BREAK sequence.
‘Ctrl-C’, on the other hand, is defined and implemented for all
transport mechanisms. It is represented by sending the single byte
0x03 without any of the usual packet overhead described in
the Overview section (see Overview). When a 0x03 byte is
transmitted as part of a packet, it is considered to be packet data
and does not represent an interrupt. E.g., an ‘X’ packet
(see X packet), used for binary downloads, may include an unescaped
0x03 as part of its packet.
BREAK followed by g is also known as Magic SysRq g.
When Linux kernel receives this sequence from serial port,
it stops execution and connects to gdb.
In non-stop mode, because packet resumptions are asynchronous
(see vCont packet), GDB is always free to send a remote
command to the remote stub, even when the target is running. For that
reason, GDB instead sends a regular packet (see vCtrlC packet) with the usual packet framing instead of the single byte
0x03.
Stubs are not required to recognize these interrupt mechanisms and the
precise meaning associated with receipt of the interrupt is
implementation defined. If the target supports debugging of multiple
threads and/or processes, it should attempt to interrupt all
currently-executing threads and processes.
If the stub is successful at interrupting the
running program, it should send one of the stop
reply packets (see Stop Reply Packets) to GDB as a result
of successfully stopping the program in all-stop mode, and a stop reply
for each stopped thread in non-stop mode.
Interrupts received while the
program is stopped are queued and the program will be interrupted when
it is resumed next time.
E.9 Notification Packets
The GDB remote serial protocol includes notifications,
packets that require no acknowledgment. Both the GDB and the stub
may send notifications (although the only notifications defined at
present are sent by the stub). Notifications carry information
without incurring the round-trip latency of an acknowledgment, and so
are useful for low-impact communications where occasional packet loss
is not a problem.
A notification packet has the form ‘% data #
checksum’, where data is the content of the notification,
and checksum is a checksum of data, computed and formatted
as for ordinary GDB packets. A notification’s data
never contains ‘$’, ‘%’ or ‘#’ characters. Upon
receiving a notification, the recipient sends no ‘+’ or ‘—’
to acknowledge the notification’s receipt or to report its corruption.
Every notification’s data begins with a name, which contains no
colon characters, followed by a colon character.
Recipients should silently ignore corrupted notifications and
notifications they do not understand. Recipients should restart
timeout periods on receipt of a well-formed notification, whether or
not they understand it.
Senders should only send the notifications described here when this
protocol description specifies that they are permitted. In the
future, we may extend the protocol to permit existing notifications in
new contexts; this rule helps older senders avoid confusing newer
recipients.
(Older versions of GDB ignore bytes received until they see
the ‘$’ byte that begins an ordinary packet, so new stubs may
transmit notifications without fear of confusing older clients. There
are no notifications defined for GDB to send at the moment, but we
assume that most older stubs would ignore them, as well.)
Each notification is comprised of three parts:
- ‘name:event’
-
The notification packet is sent by the side that initiates the
exchange (currently, only the stub does that), with event
carrying the specific information about the notification, and
name specifying the name of the notification. - ‘ack’
-
The acknowledge sent by the other side, usually GDB, to
acknowledge the exchange and request the event.
The purpose of an asynchronous notification mechanism is to report to
GDB that something interesting happened in the remote stub.
The remote stub may send notification name:event
at any time, but GDB acknowledges the notification when
appropriate. The notification event is pending before GDB
acknowledges. Only one notification at a time may be pending; if
additional events occur before GDB has acknowledged the
previous notification, they must be queued by the stub for later
synchronous transmission in response to ack packets from
GDB. Because the notification mechanism is unreliable,
the stub is permitted to resend a notification if it believes
GDB may not have received it.
Specifically, notifications may appear when GDB is not
otherwise reading input from the stub, or when GDB is
expecting to read a normal synchronous response or a
‘+’/‘—’ acknowledgment to a packet it has sent.
Notification packets are distinct from any other communication from
the stub so there is no ambiguity.
After receiving a notification, GDB shall acknowledge it by
sending a ack packet as a regular, synchronous request to the
stub. Such acknowledgment is not required to happen immediately, as
GDB is permitted to send other, unrelated packets to the
stub first, which the stub should process normally.
Upon receiving a ack packet, if the stub has other queued
events to report to GDB, it shall respond by sending a
normal event. GDB shall then send another ack
packet to solicit further responses; again, it is permitted to send
other, unrelated packets as well which the stub should process
normally.
If the stub receives a ack packet and there are no additional
event to report, the stub shall return an ‘OK’ response.
At this point, GDB has finished processing a notification
and the stub has completed sending any queued events. GDB
won’t accept any new notifications until the final ‘OK’ is
received . If further notification events occur, the stub shall send
a new notification, GDB shall accept the notification, and
the process shall be repeated.
The process of asynchronous notification can be illustrated by the
following example:
<-%Stop:T0505:98e7ffbf;04:4ce6ffbf;08:b1b6e54c;thread:p7526.7526;core:0;...->vStopped<-T0505:68f37db7;04:40f37db7;08:63850408;thread:p7526.7528;core:0;->vStopped<-T0505:68e3fdb6;04:40e3fdb6;08:63850408;thread:p7526.7529;core:0;->vStopped<-OK
The following notifications are defined:
| Notification | Ack | Event | Description |
| Stop | vStopped | reply. The reply has the form of a stop reply, as described in Stop Reply Packets. Refer to Remote Non-Stop, for information on how these notifications are acknowledged by GDB. |
Report an asynchronous stop event in non-stop mode. |
E.10 Remote Protocol Support for Non-Stop Mode
GDB’s remote protocol supports non-stop debugging of
multi-threaded programs, as described in Non-Stop Mode. If the stub
supports non-stop mode, it should report that to GDB by including
‘QNonStop+’ in its ‘qSupported’ response (see qSupported).
GDB typically sends a ‘QNonStop’ packet only when
establishing a new connection with the stub. Entering non-stop mode
does not alter the state of any currently-running threads, but targets
must stop all threads in any already-attached processes when entering
all-stop mode. GDB uses the ‘?’ packet as necessary to
probe the target state after a mode change.
In non-stop mode, when an attached process encounters an event that
would otherwise be reported with a stop reply, it uses the
asynchronous notification mechanism (see Notification Packets) to
inform GDB. In contrast to all-stop mode, where all threads
in all processes are stopped when a stop reply is sent, in non-stop
mode only the thread reporting the stop event is stopped. That is,
when reporting a ‘S’ or ‘T’ response to indicate completion
of a step operation, hitting a breakpoint, or a fault, only the
affected thread is stopped; any other still-running threads continue
to run. When reporting a ‘W’ or ‘X’ response, all running
threads belonging to other attached processes continue to run.
In non-stop mode, the target shall respond to the ‘?’ packet as
follows. First, any incomplete stop reply notification/‘vStopped’
sequence in progress is abandoned. The target must begin a new
sequence reporting stop events for all stopped threads, whether or not
it has previously reported those events to GDB. The first
stop reply is sent as a synchronous reply to the ‘?’ packet, and
subsequent stop replies are sent as responses to ‘vStopped’ packets
using the mechanism described above. The target must not send
asynchronous stop reply notifications until the sequence is complete.
If all threads are running when the target receives the ‘?’ packet,
or if the target is not attached to any process, it shall respond
‘OK’.
If the stub supports non-stop mode, it should also support the
‘swbreak’ stop reason if software breakpoints are supported, and
the ‘hwbreak’ stop reason if hardware breakpoints are supported
(see swbreak stop reason). This is because given the asynchronous
nature of non-stop mode, between the time a thread hits a breakpoint
and the time the event is finally processed by GDB, the
breakpoint may have already been removed from the target. Due to
this, GDB needs to be able to tell whether a trap stop was
caused by a delayed breakpoint event, which should be ignored, as
opposed to a random trap signal, which should be reported to the user.
Note the ‘swbreak’ feature implies that the target is responsible
for adjusting the PC when a software breakpoint triggers, if
necessary, such as on the x86 architecture.
E.11 Packet Acknowledgment
By default, when either the host or the target machine receives a packet,
the first response expected is an acknowledgment: either ‘+’ (to indicate
the package was received correctly) or ‘—’ (to request retransmission).
This mechanism allows the GDB remote protocol to operate over
unreliable transport mechanisms, such as a serial line.
In cases where the transport mechanism is itself reliable (such as a pipe or
TCP connection), the ‘+’/‘—’ acknowledgments are redundant.
It may be desirable to disable them in that case to reduce communication
overhead, or for other reasons. This can be accomplished by means of the
‘QStartNoAckMode’ packet; see QStartNoAckMode.
When in no-acknowledgment mode, neither the stub nor GDB shall send or
expect ‘+’/‘—’ protocol acknowledgments. The packet
and response format still includes the normal checksum, as described in
Overview, but the checksum may be ignored by the receiver.
If the stub supports ‘QStartNoAckMode’ and prefers to operate in
no-acknowledgment mode, it should report that to GDB
by including ‘QStartNoAckMode+’ in its response to ‘qSupported’;
see qSupported.
If GDB also supports ‘QStartNoAckMode’ and it has not been
disabled via the set remote noack-packet off command
(see Remote Configuration),
GDB may then send a ‘QStartNoAckMode’ packet to the stub.
Only then may the stub actually turn off packet acknowledgments.
GDB sends a final ‘+’ acknowledgment of the stub’s ‘OK’
response, which can be safely ignored by the stub.
Note that set remote noack-packet command only affects negotiation
between GDB and the stub when subsequent connections are made;
it does not affect the protocol acknowledgment state for any current
connection.
Since ‘+’/‘—’ acknowledgments are enabled by default when a
new connection is established,
there is also no protocol request to re-enable the acknowledgments
for the current connection, once disabled.
E.12 Examples
Example sequence of a target being re-started. Notice how the restart
does not get any direct output:
->R00<-+target restarts ->?<-+<-T001:1234123412341234->+
Example sequence of a target being stepped by a single instruction:
->G1445…<-+->s<-+time passes <-T001:1234123412341234->+->g<-+<-1455…->+
E.13 File-I/O Remote Protocol Extension
E.13.1 File-I/O Overview
The File I/O remote protocol extension (short: File-I/O) allows the
target to use the host’s file system and console I/O to perform various
system calls. System calls on the target system are translated into a
remote protocol packet to the host system, which then performs the needed
actions and returns a response packet to the target system.
This simulates file system operations even on targets that lack file systems.
The protocol is defined to be independent of both the host and target systems.
It uses its own internal representation of datatypes and values. Both
GDB and the target’s GDB stub are responsible for
translating the system-dependent value representations into the internal
protocol representations when data is transmitted.
The communication is synchronous. A system call is possible only when
GDB is waiting for a response from the ‘C’, ‘c’, ‘S’
or ‘s’ packets. While GDB handles the request for a system call,
the target is stopped to allow deterministic access to the target’s
memory. Therefore File-I/O is not interruptible by target signals. On
the other hand, it is possible to interrupt File-I/O by a user interrupt
(‘Ctrl-C’) within GDB.
The target’s request to perform a host system call does not finish
the latest ‘C’, ‘c’, ‘S’ or ‘s’ action. That means,
after finishing the system call, the target returns to continuing the
previous activity (continue, step). No additional continue or step
request from GDB is required.
(gdb) continue <- target requests 'system call X' target is stopped, GDB executes system call -> GDB returns result ... target continues, GDB returns to wait for the target <- target hits breakpoint and sends a Txx packet
The protocol only supports I/O on the console and to regular files on
the host file system. Character or block special devices, pipes,
named pipes, sockets or any other communication method on the host
system are not supported by this protocol.
File I/O is not supported in non-stop mode.
E.13.2 Protocol Basics
The File-I/O protocol uses the F packet as the request as well
as reply packet. Since a File-I/O system call can only occur when
GDB is waiting for a response from the continuing or stepping target,
the File-I/O request is a reply that GDB has to expect as a result
of a previous ‘C’, ‘c’, ‘S’ or ‘s’ packet.
This F packet contains all information needed to allow GDB
to call the appropriate host system call:
- A unique identifier for the requested system call.
- All parameters to the system call. Pointers are given as addresses
in the target memory address space. Pointers to strings are given as
pointer/length pair. Numerical values are given as they are.
Numerical control flags are given in a protocol-specific representation.
At this point, GDB has to perform the following actions.
- If the parameters include pointer values to data needed as input to a
system call, GDB requests this data from the target with a
standardmpacket request. This additional communication has to be
expected by the target implementation and is handled as any otherm
packet. - GDB translates all value from protocol representation to host
representation as needed. Datatypes are coerced into the host types. - GDB calls the system call.
- It then coerces datatypes back to protocol representation.
- If the system call is expected to return data in buffer space specified
by pointer parameters to the call, the data is transmitted to the
target using aMorXpacket. This packet has to be expected
by the target implementation and is handled as any otherMorX
packet.
Eventually GDB replies with another F packet which contains all
necessary information for the target to continue. This at least contains
- Return value.
-
errno, if has been changed by the system call. - “Ctrl-C” flag.
After having done the needed type and value coercion, the target continues
the latest continue or step action.
E.13.3 The F Request Packet
The F request packet has the following format:
- ‘Fcall-id,parameter…’
-
call-id is the identifier to indicate the host system call to be called.
This is just the name of the function.parameter… are the parameters to the system call.
Parameters are hexadecimal integer values, either the actual values in case
of scalar datatypes, pointers to target buffer space in case of compound
datatypes and unspecified memory areas, or pointer/length pairs in case
of string parameters. These are appended to the call-id as a
comma-delimited list. All values are transmitted in ASCII
string representation, pointer/length pairs separated by a slash.
E.13.4 The F Reply Packet
The F reply packet has the following format:
- ‘Fretcode,errno,Ctrl-C flag;call-specific attachment’
-
retcode is the return code of the system call as hexadecimal value.
errno is the
errnoset by the call, in protocol-specific
representation.
This parameter can be omitted if the call was successful.Ctrl-C flag is only sent if the user requested a break. In this
case, errno must be sent as well, even if the call was successful.
The Ctrl-C flag itself consists of the character ‘C’:or, if the call was interrupted before the host call has been performed:
assuming 4 is the protocol-specific representation of
EINTR.
E.13.5 The ‘Ctrl-C’ Message
If the ‘Ctrl-C’ flag is set in the GDB
reply packet (see The F Reply Packet),
the target should behave as if it had
gotten a break message. The meaning for the target is “system call
interrupted by SIGINT”. Consequentially, the target should actually stop
(as with a break message) and return to GDB with a T02
packet.
It’s important for the target to know in which
state the system call was interrupted. There are two possible cases:
- The system call hasn’t been performed on the host yet.
- The system call on the host has been finished.
These two states can be distinguished by the target by the value of the
returned errno. If it’s the protocol representation of EINTR, the system
call hasn’t been performed. This is equivalent to the EINTR handling
on POSIX systems. In any other case, the target may presume that the
system call has been finished — successfully or not — and should behave
as if the break message arrived right after the system call.
GDB must behave reliably. If the system call has not been called
yet, GDB may send the F reply immediately, setting EINTR as
errno in the packet. If the system call on the host has been finished
before the user requests a break, the full action must be finished by
GDB. This requires sending M or X packets as necessary.
The F packet may only be sent when either nothing has happened
or the full action has been completed.
E.13.6 Console I/O
By default and if not explicitly closed by the target system, the file
descriptors 0, 1 and 2 are connected to the GDB console. Output
on the GDB console is handled as any other file output operation
(write(1, …) or write(2, …)). Console input is handled
by GDB so that after the target read request from file descriptor
0 all following typing is buffered until either one of the following
conditions is met:
- The user types Ctrl-c. The behaviour is as explained above, and the
read
system call is treated as finished. - The user presses RET. This is treated as end of input with a trailing
newline. - The user types Ctrl-d. This is treated as end of input. No trailing
character (neither newline nor ‘Ctrl-D’) is appended to the input.
If the user has typed more characters than fit in the buffer given to
the read call, the trailing characters are buffered in GDB until
either another read(0, …) is requested by the target, or debugging
is stopped at the user’s request.
E.13.7 List of Supported Calls
open
- Synopsis:
-
int open(const char *pathname, int flags); int open(const char *pathname, int flags, mode_t mode);
- Request:
-
‘Fopen,pathptr/len,flags,mode’
flags is the bitwise
ORof the following values:O_CREAT-
If the file does not exist it will be created. The host
rules apply as far as file ownership and time stamps
are concerned. O_EXCL-
When used with
O_CREAT, if the file already exists it is
an error and open() fails. O_TRUNC-
If the file already exists and the open mode allows
writing (O_RDWRorO_WRONLYis given) it will be
truncated to zero length. O_APPEND-
The file is opened in append mode.
O_RDONLY-
The file is opened for reading only.
O_WRONLY-
The file is opened for writing only.
O_RDWR-
The file is opened for reading and writing.
Other bits are silently ignored.
mode is the bitwise
ORof the following values:S_IRUSR-
User has read permission.
S_IWUSR-
User has write permission.
S_IRGRP-
Group has read permission.
S_IWGRP-
Group has write permission.
S_IROTH-
Others have read permission.
S_IWOTH-
Others have write permission.
Other bits are silently ignored.
- Return value:
-
openreturns the new file descriptor or -1 if an error
occurred. - Errors:
-
EEXIST-
pathname already exists and
O_CREATandO_EXCLwere used. EISDIR-
pathname refers to a directory.
EACCES-
The requested access is not allowed.
ENAMETOOLONG-
pathname was too long.
ENOENT-
A directory component in pathname does not exist.
ENODEV-
pathname refers to a device, pipe, named pipe or socket.
EROFS-
pathname refers to a file on a read-only filesystem and
write access was requested. EFAULT-
pathname is an invalid pointer value.
ENOSPC-
No space on device to create the file.
EMFILE-
The process already has the maximum number of files open.
ENFILE-
The limit on the total number of files open on the system
has been reached. EINTR-
The call was interrupted by the user.
close
- Synopsis:
- Request:
-
‘Fclose,fd’
- Return value:
-
closereturns zero on success, or -1 if an error occurred. - Errors:
-
EBADF-
fd isn’t a valid open file descriptor.
EINTR-
The call was interrupted by the user.
read
- Synopsis:
-
int read(int fd, void *buf, unsigned int count);
- Request:
-
‘Fread,fd,bufptr,count’
- Return value:
-
On success, the number of bytes read is returned.
Zero indicates end of file. If count is zero, read
returns zero as well. On error, -1 is returned. - Errors:
-
EBADF-
fd is not a valid file descriptor or is not open for
reading. EFAULT-
bufptr is an invalid pointer value.
EINTR-
The call was interrupted by the user.
write
- Synopsis:
-
int write(int fd, const void *buf, unsigned int count);
- Request:
-
‘Fwrite,fd,bufptr,count’
- Return value:
-
On success, the number of bytes written are returned.
Zero indicates nothing was written. On error, -1
is returned. - Errors:
-
EBADF-
fd is not a valid file descriptor or is not open for
writing. EFAULT-
bufptr is an invalid pointer value.
EFBIG-
An attempt was made to write a file that exceeds the
host-specific maximum file size allowed. ENOSPC-
No space on device to write the data.
EINTR-
The call was interrupted by the user.
lseek
- Synopsis:
-
long lseek (int fd, long offset, int flag);
- Request:
-
‘Flseek,fd,offset,flag’
flag is one of:
SEEK_SET-
The offset is set to offset bytes.
SEEK_CUR-
The offset is set to its current location plus offset
bytes. SEEK_END-
The offset is set to the size of the file plus offset
bytes.
- Return value:
-
On success, the resulting unsigned offset in bytes from
the beginning of the file is returned. Otherwise, a
value of -1 is returned. - Errors:
-
EBADF-
fd is not a valid open file descriptor.
ESPIPE-
fd is associated with the GDB console.
EINVAL-
flag is not a proper value.
EINTR-
The call was interrupted by the user.
rename
- Synopsis:
-
int rename(const char *oldpath, const char *newpath);
- Request:
-
‘Frename,oldpathptr/len,newpathptr/len’
- Return value:
-
On success, zero is returned. On error, -1 is returned.
- Errors:
-
EISDIR-
newpath is an existing directory, but oldpath is not a
directory. EEXIST-
newpath is a non-empty directory.
EBUSY-
oldpath or newpath is a directory that is in use by some
process. EINVAL-
An attempt was made to make a directory a subdirectory
of itself. ENOTDIR-
A component used as a directory in oldpath or new
path is not a directory. Or oldpath is a directory
and newpath exists but is not a directory. EFAULT-
oldpathptr or newpathptr are invalid pointer values.
EACCES-
No access to the file or the path of the file.
ENAMETOOLONG-
oldpath or newpath was too long.
ENOENT-
A directory component in oldpath or newpath does not exist.
EROFS-
The file is on a read-only filesystem.
ENOSPC-
The device containing the file has no room for the new
directory entry. EINTR-
The call was interrupted by the user.
unlink
- Synopsis:
-
int unlink(const char *pathname);
- Request:
-
‘Funlink,pathnameptr/len’
- Return value:
-
On success, zero is returned. On error, -1 is returned.
- Errors:
-
EACCES-
No access to the file or the path of the file.
EPERM-
The system does not allow unlinking of directories.
EBUSY-
The file pathname cannot be unlinked because it’s
being used by another process. EFAULT-
pathnameptr is an invalid pointer value.
ENAMETOOLONG-
pathname was too long.
ENOENT-
A directory component in pathname does not exist.
ENOTDIR-
A component of the path is not a directory.
EROFS-
The file is on a read-only filesystem.
EINTR-
The call was interrupted by the user.
stat/fstat
- Synopsis:
-
int stat(const char *pathname, struct stat *buf); int fstat(int fd, struct stat *buf);
- Request:
-
‘Fstat,pathnameptr/len,bufptr’
‘Ffstat,fd,bufptr’ - Return value:
-
On success, zero is returned. On error, -1 is returned.
- Errors:
-
EBADF-
fd is not a valid open file.
ENOENT-
A directory component in pathname does not exist or the
path is an empty string. ENOTDIR-
A component of the path is not a directory.
EFAULT-
pathnameptr is an invalid pointer value.
EACCES-
No access to the file or the path of the file.
ENAMETOOLONG-
pathname was too long.
EINTR-
The call was interrupted by the user.
gettimeofday
- Synopsis:
-
int gettimeofday(struct timeval *tv, void *tz);
- Request:
-
‘Fgettimeofday,tvptr,tzptr’
- Return value:
-
On success, 0 is returned, -1 otherwise.
- Errors:
-
EINVAL-
tz is a non-NULL pointer.
EFAULT-
tvptr and/or tzptr is an invalid pointer value.
isatty
- Synopsis:
- Request:
-
‘Fisatty,fd’
- Return value:
-
Returns 1 if fd refers to the GDB console, 0 otherwise.
- Errors:
-
EINTR-
The call was interrupted by the user.
Note that the isatty call is treated as a special case: it returns
1 to the target if the file descriptor is attached
to the GDB console, 0 otherwise. Implementing through system calls
would require implementing ioctl and would be more complex than
needed.
system
- Synopsis:
-
int system(const char *command);
- Request:
-
‘Fsystem,commandptr/len’
- Return value:
-
If len is zero, the return value indicates whether a shell is
available. A zero return value indicates a shell is not available.
For non-zero len, the value returned is -1 on error and the
return status of the command otherwise. Only the exit status of the
command is returned, which is extracted from the host’ssystem
return value by callingWEXITSTATUS(retval). In case
/bin/sh could not be executed, 127 is returned. - Errors:
-
EINTR-
The call was interrupted by the user.
GDB takes over the full task of calling the necessary host calls
to perform the system call. The return value of system on
the host is simplified before it’s returned
to the target. Any termination signal information from the child process
is discarded, and the return value consists
entirely of the exit status of the called command.
Due to security concerns, the system call is by default refused
by GDB. The user has to allow this call explicitly with the
set remote system-call-allowed 1 command.
set remote system-call-allowed-
Control whether to allow the
systemcalls in the File I/O
protocol for the remote target. The default is zero (disabled). show remote system-call-allowed-
Show whether the
systemcalls are allowed in the File I/O
protocol.
E.13.8 Protocol-specific Representation of Datatypes
Integral Datatypes
The integral datatypes used in the system calls are int,
unsigned int, long, unsigned long,
mode_t, and time_t.
int, unsigned int, mode_t and time_t are
implemented as 32 bit values in this protocol.
long and unsigned long are implemented as 64 bit types.
See Limits, for corresponding MIN and MAX values (similar to those
in limits.h) to allow range checking on host and target.
time_t datatypes are defined as seconds since the Epoch.
All integral datatypes transferred as part of a memory read or write of a
structured datatype e.g. a struct stat have to be given in big endian
byte order.
Pointer Values
Pointers to target data are transmitted as they are. An exception
is made for pointers to buffers for which the length isn’t
transmitted as part of the function call, namely strings. Strings
are transmitted as a pointer/length pair, both as hex values, e.g.
which is a pointer to data of length 18 bytes at position 0x1aaf.
The length is defined as the full string length in bytes, including
the trailing null byte. For example, the string "hello world"
at address 0x123456 is transmitted as
Memory Transfer
Structured data which is transferred using a memory read or write (for
example, a struct stat) is expected to be in a protocol-specific format
with all scalar multibyte datatypes being big endian. Translation to
this representation needs to be done both by the target before the F
packet is sent, and by GDB before
it transfers memory to the target. Transferred pointers to structured
data should point to the already-coerced data at any time.
struct stat
The buffer of type struct stat used by the target and GDB
is defined as follows:
struct stat {
unsigned int st_dev; /* device */
unsigned int st_ino; /* inode */
mode_t st_mode; /* protection */
unsigned int st_nlink; /* number of hard links */
unsigned int st_uid; /* user ID of owner */
unsigned int st_gid; /* group ID of owner */
unsigned int st_rdev; /* device type (if inode device) */
unsigned long st_size; /* total size, in bytes */
unsigned long st_blksize; /* blocksize for filesystem I/O */
unsigned long st_blocks; /* number of blocks allocated */
time_t st_atime; /* time of last access */
time_t st_mtime; /* time of last modification */
time_t st_ctime; /* time of last change */
};
The integral datatypes conform to the definitions given in the
appropriate section (see Integral Datatypes, for details) so this
structure is of size 64 bytes.
The values of several fields have a restricted meaning and/or
range of values.
st_dev-
A value of 0 represents a file, 1 the console.
st_ino-
No valid meaning for the target. Transmitted unchanged.
st_mode-
Valid mode bits are described in Constants. Any other
bits have currently no meaning for the target. st_uidst_gidst_rdev-
No valid meaning for the target. Transmitted unchanged.
st_atimest_mtimest_ctime-
These values have a host and file system dependent
accuracy. Especially on Windows hosts, the file system may not
support exact timing values.
The target gets a struct stat of the above representation and is
responsible for coercing it to the target representation before
continuing.
Note that due to size differences between the host, target, and protocol
representations of struct stat members, these members could eventually
get truncated on the target.
struct timeval
The buffer of type struct timeval used by the File-I/O protocol
is defined as follows:
struct timeval {
time_t tv_sec; /* second */
long tv_usec; /* microsecond */
};
The integral datatypes conform to the definitions given in the
appropriate section (see Integral Datatypes, for details) so this
structure is of size 8 bytes.
E.13.9 Constants
The following values are used for the constants inside of the
protocol. GDB and target are responsible for translating these
values before and after the call as needed.
Open Flags
All values are given in hexadecimal representation.
O_RDONLY 0x0 O_WRONLY 0x1 O_RDWR 0x2 O_APPEND 0x8 O_CREAT 0x200 O_TRUNC 0x400 O_EXCL 0x800
mode_t Values
All values are given in octal representation.
S_IFREG 0100000 S_IFDIR 040000 S_IRUSR 0400 S_IWUSR 0200 S_IXUSR 0100 S_IRGRP 040 S_IWGRP 020 S_IXGRP 010 S_IROTH 04 S_IWOTH 02 S_IXOTH 01
Errno Values
All values are given in decimal representation.
EPERM 1 ENOENT 2 EINTR 4 EBADF 9 EACCES 13 EFAULT 14 EBUSY 16 EEXIST 17 ENODEV 19 ENOTDIR 20 EISDIR 21 EINVAL 22 ENFILE 23 EMFILE 24 EFBIG 27 ENOSPC 28 ESPIPE 29 EROFS 30 ENAMETOOLONG 91 EUNKNOWN 9999
EUNKNOWN is used as a fallback error value if a host system returns
any error value not in the list of supported error numbers.
Lseek Flags
SEEK_SET 0 SEEK_CUR 1 SEEK_END 2
Limits
All values are given in decimal representation.
INT_MIN -2147483648 INT_MAX 2147483647 UINT_MAX 4294967295 LONG_MIN -9223372036854775808 LONG_MAX 9223372036854775807 ULONG_MAX 18446744073709551615
E.13.10 File-I/O Examples
Example sequence of a write call, file descriptor 3, buffer is at target
address 0x1234, 6 bytes should be written:
<-Fwrite,3,1234,6request memory read from target ->m1234,6<- XXXXXX return "6 bytes written" ->F6
Example sequence of a read call, file descriptor 3, buffer is at target
address 0x1234, 6 bytes should be read:
<-Fread,3,1234,6request memory write to target ->X1234,6:XXXXXXreturn "6 bytes read" ->F6
Example sequence of a read call, call fails on the host due to invalid
file descriptor (EBADF):
<-Fread,3,1234,6->F-1,9
Example sequence of a read call, user presses Ctrl-c before syscall on
host is called:
<-Fread,3,1234,6->F-1,4,C<-T02
Example sequence of a read call, user presses Ctrl-c after syscall on
host is called:
<-Fread,3,1234,6->X1234,6:XXXXXX<-T02
E.14 Library List Format
On some platforms, a dynamic loader (e.g. ld.so) runs in the
same process as your application to manage libraries. In this case,
GDB can use the loader’s symbol table and normal memory
operations to maintain a list of shared libraries. On other
platforms, the operating system manages loaded libraries.
GDB can not retrieve the list of currently loaded libraries
through memory operations, so it uses the ‘qXfer:libraries:read’
packet (see qXfer library list read) instead. The remote stub
queries the target’s operating system and reports which libraries
are loaded.
The ‘qXfer:libraries:read’ packet returns an XML document which
lists loaded libraries and their offsets. Each library has an
associated name and one or more segment or section base addresses,
which report where the library was loaded in memory.
For the common case of libraries that are fully linked binaries, the
library should have a list of segments. If the target supports
dynamic linking of a relocatable object file, its library XML element
should instead include a list of allocated sections. The segment or
section bases are start addresses, not relocation offsets; they do not
depend on the library’s link-time base addresses.
GDB must be linked with the Expat library to support XML
library lists. See Expat.
A simple memory map, with one loaded library relocated by a single
offset, looks like this:
<library-list>
<library name="/lib/libc.so.6">
<segment address="0x10000000"/>
</library>
</library-list>
Another simple memory map, with one loaded library with three
allocated sections (.text, .data, .bss), looks like this:
<library-list>
<library name="sharedlib.o">
<section address="0x10000000"/>
<section address="0x20000000"/>
<section address="0x30000000"/>
</library>
</library-list>
The format of a library list is described by this DTD:
<!-- library-list: Root element with versioning --> <!ELEMENT library-list (library)*> <!ATTLIST library-list version CDATA #FIXED "1.0"> <!ELEMENT library (segment*, section*)> <!ATTLIST library name CDATA #REQUIRED> <!ELEMENT segment EMPTY> <!ATTLIST segment address CDATA #REQUIRED> <!ELEMENT section EMPTY> <!ATTLIST section address CDATA #REQUIRED>
In addition, segments and section descriptors cannot be mixed within a
single library element, and you must supply at least one segment or
section for each library.
E.15 Library List Format for SVR4 Targets
On SVR4 platforms GDB can use the symbol table of a dynamic loader
(e.g. ld.so) and normal memory operations to maintain a list of
shared libraries. Still a special library list provided by this packet is
more efficient for the GDB remote protocol.
The ‘qXfer:libraries-svr4:read’ packet returns an XML document which lists
loaded libraries and their SVR4 linker parameters. For each library on SVR4
target, the following parameters are reported:
- —
name, the absolute file name from thel_namefield of
struct link_map. - —
lmwith address ofstruct link_mapused for TLS
(Thread Local Storage) access. - —
l_addr, the displacement as read from the fieldl_addrof
struct link_map. For prelinked libraries this is not an absolute
memory address. It is a displacement of absolute memory address against
address the file was prelinked to during the library load. - —
l_ld, which is memory address of thePT_DYNAMICsegment - —
lmid, which is an identifier for a linker namespace, such as
the memory address of ther_debugobject that contains this
namespace’s load map or the namespace identifier returned by
dlinfo (3).
Additionally the single main-lm attribute specifies address of
struct link_map used for the main executable. This parameter is used
for TLS access and its presence is optional.
GDB must be linked with the Expat library to support XML
SVR4 library lists. See Expat.
A simple memory map, with two loaded libraries (which do not use prelink),
looks like this:
<library-list-svr4 version="1.0" main-lm="0xe4f8f8">
<library name="/lib/ld-linux.so.2" lm="0xe4f51c" l_addr="0xe2d000"
l_ld="0xe4eefc" lmid="0xfffe0"/>
<library name="/lib/libc.so.6" lm="0xe4fbe8" l_addr="0x154000"
l_ld="0x152350" lmid="0xfffe0"/>
</library-list-svr>
The format of an SVR4 library list is described by this DTD:
<!-- library-list-svr4: Root element with versioning --> <!ELEMENT library-list-svr4 (library)*> <!ATTLIST library-list-svr4 version CDATA #FIXED "1.0"> <!ATTLIST library-list-svr4 main-lm CDATA #IMPLIED> <!ELEMENT library EMPTY> <!ATTLIST library name CDATA #REQUIRED> <!ATTLIST library lm CDATA #REQUIRED> <!ATTLIST library l_addr CDATA #REQUIRED> <!ATTLIST library l_ld CDATA #REQUIRED> <!ATTLIST library lmid CDATA #IMPLIED>
E.16 Memory Map Format
To be able to write into flash memory, GDB needs to obtain a
memory map from the target. This section describes the format of the
memory map.
The memory map is obtained using the ‘qXfer:memory-map:read’
(see qXfer memory map read) packet and is an XML document that
lists memory regions.
GDB must be linked with the Expat library to support XML
memory maps. See Expat.
The top-level structure of the document is shown below:
<?xml version="1.0"?>
<!DOCTYPE memory-map
PUBLIC "+//IDN gnu.org//DTD GDB Memory Map V1.0//EN"
"http://sourceware.org/gdb/gdb-memory-map.dtd">
<memory-map>
region...
</memory-map>
Each region can be either:
- A region of RAM starting at addr and extending for length
bytes from there:<memory type="ram" start="addr" length="length"/>
- A region of read-only memory:
<memory type="rom" start="addr" length="length"/>
- A region of flash memory, with erasure blocks blocksize
bytes in length:<memory type="flash" start="addr" length="length"> <property name="blocksize">blocksize</property> </memory>
Regions must not overlap. GDB assumes that areas of memory not covered
by the memory map are RAM, and uses the ordinary ‘M’ and ‘X’
packets to write to addresses in such ranges.
The formal DTD for memory map format is given below:
<!-- ................................................... -->
<!-- Memory Map XML DTD ................................ -->
<!-- File: memory-map.dtd .............................. -->
<!-- .................................... .............. -->
<!-- memory-map.dtd -->
<!-- memory-map: Root element with versioning -->
<!ELEMENT memory-map (memory)*>
<!ATTLIST memory-map version CDATA #FIXED "1.0.0">
<!ELEMENT memory (property)*>
<!-- memory: Specifies a memory region,
and its type, or device. -->
<!ATTLIST memory type (ram|rom|flash) #REQUIRED
start CDATA #REQUIRED
length CDATA #REQUIRED>
<!-- property: Generic attribute tag -->
<!ELEMENT property (#PCDATA | property)*>
<!ATTLIST property name (blocksize) #REQUIRED>
E.17 Thread List Format
To efficiently update the list of threads and their attributes,
GDB issues the ‘qXfer:threads:read’ packet
(see qXfer threads read) and obtains the XML document with
the following structure:
<?xml version="1.0"?>
<threads>
<thread id="id" core="0" name="name">
... description ...
</thread>
</threads>
Each ‘thread’ element must have the ‘id’ attribute that
identifies the thread (see thread-id syntax). The
‘core’ attribute, if present, specifies which processor core
the thread was last executing on. The ‘name’ attribute, if
present, specifies the human-readable name of the thread. The content
of the of ‘thread’ element is interpreted as human-readable
auxiliary information. The ‘handle’ attribute, if present,
is a hex encoded representation of the thread handle.
E.18 Traceframe Info Format
To be able to know which objects in the inferior can be examined when
inspecting a tracepoint hit, GDB needs to obtain the list of
memory ranges, registers and trace state variables that have been
collected in a traceframe.
This list is obtained using the ‘qXfer:traceframe-info:read’
(see qXfer traceframe info read) packet and is an XML document.
GDB must be linked with the Expat library to support XML
traceframe info discovery. See Expat.
The top-level structure of the document is shown below:
<?xml version="1.0"?>
<!DOCTYPE traceframe-info
PUBLIC "+//IDN gnu.org//DTD GDB Memory Map V1.0//EN"
"http://sourceware.org/gdb/gdb-traceframe-info.dtd">
<traceframe-info>
block...
</traceframe-info>
Each traceframe block can be either:
- A region of collected memory starting at addr and extending for
length bytes from there:<memory start="addr" length="length"/>
- A block indicating trace state variable numbered number has been
collected:
The formal DTD for the traceframe info format is given below:
<!ELEMENT traceframe-info (memory | tvar)* >
<!ATTLIST traceframe-info version CDATA #FIXED "1.0">
<!ELEMENT memory EMPTY>
<!ATTLIST memory start CDATA #REQUIRED
length CDATA #REQUIRED>
<!ELEMENT tvar>
<!ATTLIST tvar id CDATA #REQUIRED>
E.19 Branch Trace Format
In order to display the branch trace of an inferior thread,
GDB needs to obtain the list of branches. This list is
represented as list of sequential code blocks that are connected via
branches. The code in each block has been executed sequentially.
This list is obtained using the ‘qXfer:btrace:read’
(see qXfer btrace read) packet and is an XML document.
GDB must be linked with the Expat library to support XML
traceframe info discovery. See Expat.
The top-level structure of the document is shown below:
<?xml version="1.0"?>
<!DOCTYPE btrace
PUBLIC "+//IDN gnu.org//DTD GDB Branch Trace V1.0//EN"
"http://sourceware.org/gdb/gdb-btrace.dtd">
<btrace>
block...
</btrace>
- A block of sequentially executed instructions starting at begin
and ending at end:<block begin="begin" end="end"/>
The formal DTD for the branch trace format is given below:
<!ELEMENT btrace (block* | pt) >
<!ATTLIST btrace version CDATA #FIXED "1.0">
<!ELEMENT block EMPTY>
<!ATTLIST block begin CDATA #REQUIRED
end CDATA #REQUIRED>
<!ELEMENT pt (pt-config?, raw?)>
<!ELEMENT pt-config (cpu?)>
<!ELEMENT cpu EMPTY>
<!ATTLIST cpu vendor CDATA #REQUIRED
family CDATA #REQUIRED
model CDATA #REQUIRED
stepping CDATA #REQUIRED>
<!ELEMENT raw (#PCDATA)>
E.20 Branch Trace Configuration Format
For each inferior thread, GDB can obtain the branch trace
configuration using the ‘qXfer:btrace-conf:read’
(see qXfer btrace-conf read) packet.
The configuration describes the branch trace format and configuration
settings for that format. The following information is described:
bts-
This thread uses the Branch Trace Store (BTS) format.
size-
The size of the BTS ring buffer in bytes.
pt-
This thread uses the Intel Processor Trace (Intel
PT) format.size-
The size of the Intel PT ring buffer in bytes.
GDB must be linked with the Expat library to support XML
branch trace configuration discovery. See Expat.
The formal DTD for the branch trace configuration format is given below:
<!ELEMENT btrace-conf (bts?, pt?)> <!ATTLIST btrace-conf version CDATA #FIXED "1.0"> <!ELEMENT bts EMPTY> <!ATTLIST bts size CDATA #IMPLIED> <!ELEMENT pt EMPTY> <!ATTLIST pt size CDATA #IMPLIED>
Appendix F The GDB Agent Expression Mechanism
In some applications, it is not feasible for the debugger to interrupt
the program’s execution long enough for the developer to learn anything
helpful about its behavior. If the program’s correctness depends on its
real-time behavior, delays introduced by a debugger might cause the
program to fail, even when the code itself is correct. It is useful to
be able to observe the program’s behavior without interrupting it.
Using GDB’s trace and collect commands, the user can
specify locations in the program, and arbitrary expressions to evaluate
when those locations are reached. Later, using the tfind
command, she can examine the values those expressions had when the
program hit the trace points. The expressions may also denote objects
in memory — structures or arrays, for example — whose values GDB
should record; while visiting a particular tracepoint, the user may
inspect those objects as if they were in memory at that moment.
However, because GDB records these values without interacting with the
user, it can do so quickly and unobtrusively, hopefully not disturbing
the program’s behavior.
When GDB is debugging a remote target, the GDB agent code running
on the target computes the values of the expressions itself. To avoid
having a full symbolic expression evaluator on the agent, GDB translates
expressions in the source language into a simpler bytecode language, and
then sends the bytecode to the agent; the agent then executes the
bytecode, and records the values for GDB to retrieve later.
The bytecode language is simple; there are forty-odd opcodes, the bulk
of which are the usual vocabulary of C operands (addition, subtraction,
shifts, and so on) and various sizes of literals and memory reference
operations. The bytecode interpreter operates strictly on machine-level
values — various sizes of integers and floating point numbers — and
requires no information about types or symbols; thus, the interpreter’s
internal data structures are simple, and each bytecode requires only a
few native machine instructions to implement it. The interpreter is
small, and strict limits on the memory and time required to evaluate an
expression are easy to determine, making it suitable for use by the
debugging agent in real-time applications.
F.1 General Bytecode Design
The agent represents bytecode expressions as an array of bytes. Each
instruction is one byte long (thus the term bytecode). Some
instructions are followed by operand bytes; for example, the goto
instruction is followed by a destination for the jump.
The bytecode interpreter is a stack-based machine; most instructions pop
their operands off the stack, perform some operation, and push the
result back on the stack for the next instruction to consume. Each
element of the stack may contain either a integer or a floating point
value; these values are as many bits wide as the largest integer that
can be directly manipulated in the source language. Stack elements
carry no record of their type; bytecode could push a value as an
integer, then pop it as a floating point value. However, GDB will not
generate code which does this. In C, one might define the type of a
stack element as follows:
union agent_val {
LONGEST l;
DOUBLEST d;
};
where LONGEST and DOUBLEST are typedef names for
the largest integer and floating point types on the machine.
By the time the bytecode interpreter reaches the end of the expression,
the value of the expression should be the only value left on the stack.
For tracing applications, trace bytecodes in the expression will
have recorded the necessary data, and the value on the stack may be
discarded. For other applications, like conditional breakpoints, the
value may be useful.
Separate from the stack, the interpreter has two registers:
pc-
The address of the next bytecode to execute.
start-
The address of the start of the bytecode expression, necessary for
interpreting thegotoandif_gotoinstructions.
Neither of these registers is directly visible to the bytecode language
itself, but they are useful for defining the meanings of the bytecode
operations.
There are no instructions to perform side effects on the running
program, or call the program’s functions; we assume that these
expressions are only used for unobtrusive debugging, not for patching
the running code.
Most bytecode instructions do not distinguish between the various sizes
of values, and operate on full-width values; the upper bits of the
values are simply ignored, since they do not usually make a difference
to the value computed. The exceptions to this rule are:
- memory reference instructions (
refn) -
There are distinct instructions to fetch different word sizes from
memory. Once on the stack, however, the values are treated as full-size
integers. They may need to be sign-extended; theextinstruction
exists for this purpose. - the sign-extension instruction (
extn) -
These clearly need to know which portion of their operand is to be
extended to occupy the full length of the word.
If the interpreter is unable to evaluate an expression completely for
some reason (a memory location is inaccessible, or a divisor is zero,
for example), we say that interpretation “terminates with an error”.
This means that the problem is reported back to the interpreter’s caller
in some helpful way. In general, code using agent expressions should
assume that they may attempt to divide by zero, fetch arbitrary memory
locations, and misbehave in other ways.
Even complicated C expressions compile to a few bytecode instructions;
for example, the expression x + y * z would typically produce
code like the following, assuming that x and y live in
registers, and z is a global variable holding a 32-bit
int:
reg 1 reg 2 const32 address of z ref32 ext 32 mul add end
In detail, these mean:
reg 1-
Push the value of register 1 (presumably holding
x) onto the
stack. reg 2-
Push the value of register 2 (holding
y). const32 address of z-
Push the address of
zonto the stack. ref32-
Fetch a 32-bit word from the address at the top of the stack; replace
the address on the stack with the value. Thus, we replace the address
ofzwithz’s value. ext 32-
Sign-extend the value on the top of the stack from 32 bits to full
length. This is necessary becausezis a signed integer. mul-
Pop the top two numbers on the stack, multiply them, and push their
product. Now the top of the stack contains the value of the expression
y * z. add-
Pop the top two numbers, add them, and push the sum. Now the top of the
stack contains the value ofx + y * z. end-
Stop executing; the value left on the stack top is the value to be
recorded.
F.2 Bytecode Descriptions
Each bytecode description has the following form:
add(0x02): a b ⇒ a+b-
Pop the top two stack items, a and b, as integers; push
their sum, as an integer.
In this example, add is the name of the bytecode, and
(0x02) is the one-byte value used to encode the bytecode, in
hexadecimal. The phrase “a b ⇒ a+b” shows
the stack before and after the bytecode executes. Beforehand, the stack
must contain at least two values, a and b; since the top of
the stack is to the right, b is on the top of the stack, and
a is underneath it. After execution, the bytecode will have
popped a and b from the stack, and replaced them with a
single value, a+b. There may be other values on the stack below
those shown, but the bytecode affects only those shown.
Here is another example:
const8(0x22) n: ⇒ n-
Push the 8-bit integer constant n on the stack, without sign
extension.
In this example, the bytecode const8 takes an operand n
directly from the bytecode stream; the operand follows the const8
bytecode itself. We write any such operands immediately after the name
of the bytecode, before the colon, and describe the exact encoding of
the operand in the bytecode stream in the body of the bytecode
description.
For the const8 bytecode, there are no stack items given before
the ⇒; this simply means that the bytecode consumes no values
from the stack. If a bytecode consumes no values, or produces no
values, the list on either side of the ⇒ may be empty.
If a value is written as a, b, or n, then the bytecode
treats it as an integer. If a value is written is addr, then the
bytecode treats it as an address.
We do not fully describe the floating point operations here; although
this design can be extended in a clean way to handle floating point
values, they are not of immediate interest to the customer, so we avoid
describing them, to save time.
float(0x01): ⇒-
Prefix for floating-point bytecodes. Not implemented yet.
add(0x02): a b ⇒ a+b-
Pop two integers from the stack, and push their sum, as an integer.
sub(0x03): a b ⇒ a-b-
Pop two integers from the stack, subtract the top value from the
next-to-top value, and push the difference. mul(0x04): a b ⇒ a*b-
Pop two integers from the stack, multiply them, and push the product on
the stack. Note that, when one multiplies two n-bit numbers
yielding another n-bit number, it is irrelevant whether the
numbers are signed or not; the results are the same. div_signed(0x05): a b ⇒ a/b-
Pop two signed integers from the stack; divide the next-to-top value by
the top value, and push the quotient. If the divisor is zero, terminate
with an error. div_unsigned(0x06): a b ⇒ a/b-
Pop two unsigned integers from the stack; divide the next-to-top value
by the top value, and push the quotient. If the divisor is zero,
terminate with an error. rem_signed(0x07): a b ⇒ a modulo b-
Pop two signed integers from the stack; divide the next-to-top value by
the top value, and push the remainder. If the divisor is zero,
terminate with an error. rem_unsigned(0x08): a b ⇒ a modulo b-
Pop two unsigned integers from the stack; divide the next-to-top value
by the top value, and push the remainder. If the divisor is zero,
terminate with an error. lsh(0x09): a b ⇒ a<<b-
Pop two integers from the stack; let a be the next-to-top value,
and b be the top value. Shift a left by b bits, and
push the result. rsh_signed(0x0a): a b ⇒(signed)a>>b-
Pop two integers from the stack; let a be the next-to-top value,
and b be the top value. Shift a right by b bits,
inserting copies of the top bit at the high end, and push the result. rsh_unsigned(0x0b): a b ⇒ a>>b-
Pop two integers from the stack; let a be the next-to-top value,
and b be the top value. Shift a right by b bits,
inserting zero bits at the high end, and push the result. log_not(0x0e): a ⇒ !a-
Pop an integer from the stack; if it is zero, push the value one;
otherwise, push the value zero. bit_and(0x0f): a b ⇒ a&b-
Pop two integers from the stack, and push their bitwise
and. bit_or(0x10): a b ⇒ a|b-
Pop two integers from the stack, and push their bitwise
or. bit_xor(0x11): a b ⇒ a^b-
Pop two integers from the stack, and push their bitwise
exclusive-or. bit_not(0x12): a ⇒ ~a-
Pop an integer from the stack, and push its bitwise complement.
equal(0x13): a b ⇒ a=b-
Pop two integers from the stack; if they are equal, push the value one;
otherwise, push the value zero. less_signed(0x14): a b ⇒ a<b-
Pop two signed integers from the stack; if the next-to-top value is less
than the top value, push the value one; otherwise, push the value zero. less_unsigned(0x15): a b ⇒ a<b-
Pop two unsigned integers from the stack; if the next-to-top value is less
than the top value, push the value one; otherwise, push the value zero. ext(0x16) n: a ⇒ a, sign-extended from n bits-
Pop an unsigned value from the stack; treating it as an n-bit
twos-complement value, extend it to full length. This means that all
bits to the left of bit n-1 (where the least significant bit is bit
0) are set to the value of bit n-1. Note that n may be
larger than or equal to the width of the stack elements of the bytecode
engine; in this case, the bytecode should have no effect.The number of source bits to preserve, n, is encoded as a single
byte unsigned integer following theextbytecode. zero_ext(0x2a) n: a ⇒ a, zero-extended from n bits-
Pop an unsigned value from the stack; zero all but the bottom n
bits.The number of source bits to preserve, n, is encoded as a single
byte unsigned integer following thezero_extbytecode. ref8(0x17): addr ⇒ aref16(0x18): addr ⇒ aref32(0x19): addr ⇒ aref64(0x1a): addr ⇒ a-
Pop an address addr from the stack. For bytecode
refn, fetch an n-bit value from addr, using the
natural target endianness. Push the fetched value as an unsigned
integer.Note that addr may not be aligned in any particular way; the
refnbytecodes should operate correctly for any address.If attempting to access memory at addr would cause a processor
exception of some sort, terminate with an error. ref_float(0x1b): addr ⇒ dref_double(0x1c): addr ⇒ dref_long_double(0x1d): addr ⇒ dl_to_d(0x1e): a ⇒ dd_to_l(0x1f): d ⇒ a-
Not implemented yet.
dup(0x28): a => a a-
Push another copy of the stack’s top element.
swap(0x2b): a b => b a-
Exchange the top two items on the stack.
pop(0x29): a =>-
Discard the top value on the stack.
pick(0x32) n: a … b => a … b a-
Duplicate an item from the stack and push it on the top of the stack.
n, a single byte, indicates the stack item to copy. If n
is zero, this is the same asdup; if n is one, it copies
the item under the top item, etc. If n exceeds the number of
items on the stack, terminate with an error. rot(0x33): a b c => c a b-
Rotate the top three items on the stack. The top item (c) becomes the third
item, the next-to-top item (b) becomes the top item and the third item (a) from
the top becomes the next-to-top item. if_goto(0x20) offset: a ⇒-
Pop an integer off the stack; if it is non-zero, branch to the given
offset in the bytecode string. Otherwise, continue to the next
instruction in the bytecode stream. In other words, if a is
non-zero, set thepcregister tostart+ offset.
Thus, an offset of zero denotes the beginning of the expression.The offset is stored as a sixteen-bit unsigned value, stored
immediately following theif_gotobytecode. It is always stored
most significant byte first, regardless of the target’s normal
endianness. The offset is not guaranteed to fall at any particular
alignment within the bytecode stream; thus, on machines where fetching a
16-bit on an unaligned address raises an exception, you should fetch the
offset one byte at a time. goto(0x21) offset: ⇒-
Branch unconditionally to offset; in other words, set the
pcregister tostart+ offset.The offset is stored in the same way as for the
if_gotobytecode. const8(0x22) n: ⇒ nconst16(0x23) n: ⇒ nconst32(0x24) n: ⇒ nconst64(0x25) n: ⇒ n-
Push the integer constant n on the stack, without sign extension.
To produce a small negative value, push a small twos-complement value,
and then sign-extend it using theextbytecode.The constant n is stored in the appropriate number of bytes
following theconstb bytecode. The constant n is
always stored most significant byte first, regardless of the target’s
normal endianness. The constant is not guaranteed to fall at any
particular alignment within the bytecode stream; thus, on machines where
fetching a 16-bit on an unaligned address raises an exception, you
should fetch n one byte at a time. reg(0x26) n: ⇒ a-
Push the value of register number n, without sign extension. The
registers are numbered following GDB’s conventions.The register number n is encoded as a 16-bit unsigned integer
immediately following theregbytecode. It is always stored most
significant byte first, regardless of the target’s normal endianness.
The register number is not guaranteed to fall at any particular
alignment within the bytecode stream; thus, on machines where fetching a
16-bit on an unaligned address raises an exception, you should fetch the
register number one byte at a time. getv(0x2c) n: ⇒ v-
Push the value of trace state variable number n, without sign
extension.The variable number n is encoded as a 16-bit unsigned integer
immediately following thegetvbytecode. It is always stored most
significant byte first, regardless of the target’s normal endianness.
The variable number is not guaranteed to fall at any particular
alignment within the bytecode stream; thus, on machines where fetching a
16-bit on an unaligned address raises an exception, you should fetch the
register number one byte at a time. setv(0x2d) n: v ⇒ v-
Set trace state variable number n to the value found on the top
of the stack. The stack is unchanged, so that the value is readily
available if the assignment is part of a larger expression. The
handling of n is as described forgetv. trace(0x0c): addr size ⇒-
Record the contents of the size bytes at addr in a trace
buffer, for later retrieval by GDB. trace_quick(0x0d) size: addr ⇒ addr-
Record the contents of the size bytes at addr in a trace
buffer, for later retrieval by GDB. size is a single byte
unsigned integer following thetraceopcode.This bytecode is equivalent to the sequence
dup const8 size, but we provide it anyway to save space in bytecode strings.
trace trace16(0x30) size: addr ⇒ addr-
Identical to trace_quick, except that size is a 16-bit big-endian
unsigned integer, not a single byte. This should probably have been
namedtrace_quick16, for consistency. tracev(0x2e) n: ⇒ a-
Record the value of trace state variable number n in the trace
buffer. The handling of n is as described forgetv. tracenz(0x2f) addr size ⇒-
Record the bytes at addr in a trace buffer, for later retrieval
by GDB. Stop at either the first zero byte, or when size bytes
have been recorded, whichever occurs first. printf(0x34) numargs string ⇒-
Do a formatted print, in the style of the C function
printf).
The value of numargs is the number of arguments to expect on the
stack, while string is the format string, prefixed with a
two-byte length. The last byte of the string must be zero, and is
included in the length. The format string includes escaped sequences
just as it appears in C source, so for instance the format string
"t%dn"is six characters long, and the output will consist of
a tab character, a decimal number, and a newline. At the top of the
stack, above the values to be printed, this bytecode will pop a
“function” and “channel”. If the function is nonzero, then the
target may treat it as a function and call it, passing the channel as
a first argument, as with the C functionfprintf. If the
function is zero, then the target may simply call a standard formatted
print function of its choice. In all, this bytecode pops 2 +
numargs stack elements, and pushes nothing. end(0x27): ⇒-
Stop executing bytecode; the result should be the top element of the
stack. If the purpose of the expression was to compute an lvalue or a
range of memory, then the next-to-top of the stack is the lvalue’s
address, and the top of the stack is the lvalue’s size, in bytes.
F.3 Using Agent Expressions
Agent expressions can be used in several different ways by GDB,
and the debugger can generate different bytecode sequences as appropriate.
One possibility is to do expression evaluation on the target rather
than the host, such as for the conditional of a conditional
tracepoint. In such a case, GDB compiles the source
expression into a bytecode sequence that simply gets values from
registers or memory, does arithmetic, and returns a result.
Another way to use agent expressions is for tracepoint data
collection. GDB generates a different bytecode sequence for
collection; in addition to bytecodes that do the calculation,
GDB adds trace bytecodes to save the pieces of
memory that were used.
- The user selects trace points in the program’s code at which GDB should
collect data. - The user specifies expressions to evaluate at each trace point. These
expressions may denote objects in memory, in which case those objects’
contents are recorded as the program runs, or computed values, in which
case the values themselves are recorded. - GDB transmits the tracepoints and their associated expressions to the
GDB agent, running on the debugging target. - The agent arranges to be notified when a trace point is hit.
- When execution on the target reaches a trace point, the agent evaluates
the expressions associated with that trace point, and records the
resulting values and memory ranges. - Later, when the user selects a given trace event and inspects the
objects and expression values recorded, GDB talks to the agent to
retrieve recorded data as necessary to meet the user’s requests. If the
user asks to see an object whose contents have not been recorded, GDB
reports an error.
F.4 Varying Target Capabilities
Some targets don’t support floating-point, and some would rather not
have to deal with long long operations. Also, different targets
will have different stack sizes, and different bytecode buffer lengths.
Thus, GDB needs a way to ask the target about itself. We haven’t worked
out the details yet, but in general, GDB should be able to send the
target a packet asking it to describe itself. The reply should be a
packet whose length is explicit, so we can add new information to the
packet in future revisions of the agent, without confusing old versions
of GDB, and it should contain a version number. It should contain at
least the following information:
- whether floating point is supported
- whether
long longis supported - maximum acceptable size of bytecode stack
- maximum acceptable length of bytecode expressions
- which registers are actually available for collection
- whether the target supports disabled tracepoints
F.5 Rationale
Some of the design decisions apparent above are arguable.
- What about stack overflow/underflow?
-
GDB should be able to query the target to discover its stack size.
Given that information, GDB can determine at translation time whether a
given expression will overflow the stack. But this spec isn’t about
what kinds of error-checking GDB ought to do. - Why are you doing everything in LONGEST?
-
Speed isn’t important, but agent code size is; using LONGEST brings in a
bunch of support code to do things like division, etc. So this is a
serious concern.First, note that you don’t need different bytecodes for different
operand sizes. You can generate code without knowing how big the
stack elements actually are on the target. If the target only supports
32-bit ints, and you don’t send any 64-bit bytecodes, everything just
works. The observation here is that the MIPS and the Alpha have only
fixed-size registers, and you can still get C’s semantics even though
most instructions only operate on full-sized words. You just need to
make sure everything is properly sign-extended at the right times. So
there is no need for 32- and 64-bit variants of the bytecodes. Just
implement everything using the largest size you support.GDB should certainly check to see what sizes the target supports, so the
user can get an error earlier, rather than later. But this information
is not necessary for correctness. - Why don’t you have
>or<=operators? -
I want to keep the interpreter small, and we don’t need them. We can
combine theless_opcodes withlog_not, and swap the order
of the operands, yielding all four asymmetrical comparison operators.
For example,(x <= y)is! (x > y), which is! (y <.
x) - Why do you have
log_not? - Why do you have
ext? - Why do you have
zero_ext? -
These are all easily synthesized from other instructions, but I expect
them to be used frequently, and they’re simple, so I include them to
keep bytecode strings short.log_notis equivalent toconst8 0 equal; it’s used in half
the relational operators.ext nis equivalent toconst8 s-n lsh const8, where s is the size of the stack elements;
s-n rsh_signed
it followsrefmand reg bytecodes when the value
should be signed. See the next bulleted item.zero_ext nis equivalent toconstm mask; it’s used whenever we push the value of a register, because we
log_and
can’t assume the upper bits of the register aren’t garbage. - Why not have sign-extending variants of the
refoperators? -
Because that would double the number of
refoperators, and we
need theextbytecode anyway for accessing bitfields. - Why not have constant-address variants of the
refoperators? -
Because that would double the number of
refoperators again, and
const32 address ref32is only one byte longer. - Why do the
refnoperators have to support unaligned fetches? -
GDB will generate bytecode that fetches multi-byte values at unaligned
addresses whenever the executable’s debugging information tells it to.
Furthermore, GDB does not know the value the pointer will have when GDB
generates the bytecode, so it cannot determine whether a particular
fetch will be aligned or not.In particular, structure bitfields may be several bytes long, but follow
no alignment rules; members of packed structures are not necessarily
aligned either.In general, there are many cases where unaligned references occur in
correct C code, either at the programmer’s explicit request, or at the
compiler’s discretion. Thus, it is simpler to make the GDB agent
bytecodes work correctly in all circumstances than to make GDB guess in
each case whether the compiler did the usual thing. - Why are there no side-effecting operators?
-
Because our current client doesn’t want them? That’s a cheap answer. I
think the real answer is that I’m afraid of implementing function
calls. We should re-visit this issue after the present contract is
delivered. - Why aren’t the
gotoops PC-relative? -
The interpreter has the base address around anyway for PC bounds
checking, and it seemed simpler. - Why is there only one offset size for the
gotoops? -
Offsets are currently sixteen bits. I’m not happy with this situation
either:Suppose we have multiple branch ops with different offset sizes. As I
generate code left-to-right, all my jumps are forward jumps (there are
no loops in expressions), so I never know the target when I emit the
jump opcode. Thus, I have to either always assume the largest offset
size, or do jump relaxation on the code after I generate it, which seems
like a big waste of time.I can imagine a reasonable expression being longer than 256 bytes. I
can’t imagine one being longer than 64k. Thus, we need 16-bit offsets.
This kind of reasoning is so bogus, but relaxation is pathetic.The other approach would be to generate code right-to-left. Then I’d
always know my offset size. That might be fun. - Where is the function call bytecode?
-
When we add side-effects, we should add this.
- Why does the
regbytecode take a 16-bit register number? -
Intel’s IA-64 architecture has 128 general-purpose registers,
and 128 floating-point registers, and I’m sure it has some random
control registers. - Why do we need
traceandtrace_quick? -
Because GDB needs to record all the memory contents and registers an
expression touches. If the user wants to evaluate an expression
x->y->z, the agent must record the values ofxand
x->yas well as the value ofx->y->z. - Don’t the
tracebytecodes make the interpreter less general? -
They do mean that the interpreter contains special-purpose code, but
that doesn’t mean the interpreter can only be used for that purpose. If
an expression doesn’t use thetracebytecodes, they don’t get in
its way. - Why doesn’t
trace_quickconsume its arguments the way everything else does? -
In general, you do want your operators to consume their arguments; it’s
consistent, and generally reduces the amount of stack rearrangement
necessary. However,trace_quickis a kludge to save space; it
only exists so we needn’t writedup const8 SIZE trace
before every memory reference. Therefore, it’s okay for it not to
consume its arguments; it’s meant for a specific context in which we
know exactly what it should do with the stack. If we’re going to have a
kludge, it should be an effective kludge. - Why does
trace16exist? -
That opcode was added by the customer that contracted Cygnus for the
data tracing work. I personally think it is unnecessary; objects that
large will be quite rare, so it is okay to usedup const16in those cases.
size traceWhatever we decide to do with
trace16, we should at least leave
opcode 0x30 reserved, to remain compatible with the customer who added
it.
Appendix G Target Descriptions
One of the challenges of using GDB to debug embedded systems
is that there are so many minor variants of each processor
architecture in use. It is common practice for vendors to start with
a standard processor core — ARM, PowerPC, or MIPS, for example —
and then make changes to adapt it to a particular market niche. Some
architectures have hundreds of variants, available from dozens of
vendors. This leads to a number of problems:
- With so many different customized processors, it is difficult for
the GDB maintainers to keep up with the changes. - Since individual variants may have short lifetimes or limited
audiences, it may not be worthwhile to carry information about every
variant in the GDB source tree. - When GDB does support the architecture of the embedded system
at hand, the task of finding the correct architecture name to give the
set architecturecommand can be error-prone.
To address these problems, the GDB remote protocol allows a
target system to not only identify itself to GDB, but to
actually describe its own features. This lets GDB support
processor variants it has never seen before — to the extent that the
descriptions are accurate, and that GDB understands them.
GDB must be linked with the Expat library to support XML
target descriptions. See Expat.
G.1 Retrieving Descriptions
Target descriptions can be read from the target automatically, or
specified by the user manually. The default behavior is to read the
description from the target. GDB retrieves it via the remote
protocol using ‘qXfer’ requests (see qXfer). The annex in the ‘qXfer’ packet will be
‘target.xml’. The contents of the ‘target.xml’ annex are an
XML document, of the form described in Target Description Format.
Alternatively, you can specify a file to read for the target description.
If a file is set, the target will not be queried. The commands to
specify a file are:
set tdesc filename path-
Read the target description from path.
unset tdesc filename-
Do not read the XML target description from a file. GDB
will use the description supplied by the current target. show tdesc filename-
Show the filename to read for a target description, if any.
G.2 Target Description Format
A target description annex is an XML
document which complies with the Document Type Definition provided in
the GDB sources in gdb/features/gdb-target.dtd. This
means you can use generally available tools like xmllint to
check that your feature descriptions are well-formed and valid.
However, to help people unfamiliar with XML write descriptions for
their targets, we also describe the grammar here.
Target descriptions can identify the architecture of the remote target
and (for some architectures) provide information about custom register
sets. They can also identify the OS ABI of the remote target.
GDB can use this information to autoconfigure for your
target, or to warn you if you connect to an unsupported target.
Here is a simple target description:
<target version="1.0"> <architecture>i386:x86-64</architecture> </target>
This minimal description only says that the target uses
the x86-64 architecture.
A target description has the following overall form, with [ ] marking
optional elements and … marking repeatable elements. The elements
are explained further below.
<?xml version="1.0"?> <!DOCTYPE target SYSTEM "gdb-target.dtd"> <target version="1.0"> [architecture] [osabi] [compatible] [feature…] </target>
The description is generally insensitive to whitespace and line
breaks, under the usual common-sense rules. The XML version
declaration and document type declaration can generally be omitted
(GDB does not require them), but specifying them may be
useful for XML validation tools. The ‘version’ attribute for
‘<target>’ may also be omitted, but we recommend
including it; if future versions of GDB use an incompatible
revision of gdb-target.dtd, they will detect and report
the version mismatch.
G.2.1 Inclusion
It can sometimes be valuable to split a target description up into
several different annexes, either for organizational purposes, or to
share files between different possible target descriptions. You can
divide a description into multiple files by replacing any element of
the target description with an inclusion directive of the form:
<xi:include href="document"/>
When GDB encounters an element of this form, it will retrieve
the named XML document, and replace the inclusion directive with
the contents of that document. If the current description was read
using ‘qXfer’, then so will be the included document;
document will be interpreted as the name of an annex. If the
current description was read from a file, GDB will look for
document as a file in the same directory where it found the
original description.
G.2.2 Architecture
An ‘<architecture>’ element has this form:
<architecture>arch</architecture>
arch is one of the architectures from the set accepted by
set architecture (see Specifying a Debugging Target).
G.2.3 OS ABI
This optional field was introduced in GDB version 7.0.
Previous versions of GDB ignore it.
An ‘<osabi>’ element has this form:
abi-name is an OS ABI name from the same selection accepted by
set osabi (see Configuring the Current ABI).
G.2.4 Compatible Architecture
This optional field was introduced in GDB version 7.0.
Previous versions of GDB ignore it.
A ‘<compatible>’ element has this form:
<compatible>arch</compatible>
arch is one of the architectures from the set accepted by
set architecture (see Specifying a Debugging Target).
A ‘<compatible>’ element is used to specify that the target
is able to run binaries in some other than the main target architecture
given by the ‘<architecture>’ element. For example, on the
Cell Broadband Engine, the main architecture is powerpc:common
or powerpc:common64, but the system is able to run binaries
in the spu architecture as well. The way to describe this
capability with ‘<compatible>’ is as follows:
<architecture>powerpc:common</architecture> <compatible>spu</compatible>
G.2.5 Features
Each ‘<feature>’ describes some logical portion of the target
system. Features are currently used to describe available CPU
registers and the types of their contents. A ‘<feature>’ element
has this form:
<feature name="name"> [type…] reg… </feature>
Each feature’s name should be unique within the description. The name
of a feature does not matter unless GDB has some special
knowledge of the contents of that feature; if it does, the feature
should have its standard name. See Standard Target Features.
G.2.6 Types
Any register’s value is a collection of bits which GDB must
interpret. The default interpretation is a two’s complement integer,
but other types can be requested by name in the register description.
Some predefined types are provided by GDB (see Predefined Target Types), and the description can define additional composite
and enum types.
Each type element must have an ‘id’ attribute, which gives
a unique (within the containing ‘<feature>’) name to the type.
Types must be defined before they are used.
Some targets offer vector registers, which can be treated as arrays
of scalar elements. These types are written as ‘<vector>’ elements,
specifying the array element type, type, and the number of elements,
count:
<vector id="id" type="type" count="count"/>
If a register’s value is usefully viewed in multiple ways, define it
with a union type containing the useful representations. The
‘<union>’ element contains one or more ‘<field>’ elements,
each of which has a name and a type:
<union id="id"> <field name="name" type="type"/> … </union>
If a register’s value is composed from several separate values, define
it with either a structure type or a flags type.
A flags type may only contain bitfields.
A structure type may either contain only bitfields or contain no bitfields.
If the value contains only bitfields, its total size in bytes must be
specified.
Non-bitfield values have a name and type.
<struct id="id"> <field name="name" type="type"/> … </struct>
Both name and type values are required.
No implicit padding is added.
Bitfield values have a name, start, end and type.
<struct id="id" size="size"> <field name="name" start="start" end="end" type="type"/> … </struct>
<flags id="id" size="size"> <field name="name" start="start" end="end" type="type"/> … </flags>
The name value is required.
Bitfield values may be named with the empty string, ‘«»’,
in which case the field is “filler” and its value is not printed.
Not all bits need to be specified, so “filler” fields are optional.
The start and end values are required, and type
is optional.
The field’s start must be less than or equal to its end,
and zero represents the least significant bit.
The default value of type is bool for single bit fields,
and an unsigned integer otherwise.
Which to choose? Structures or flags?
Registers defined with ‘flags’ have these advantages over
defining them with ‘struct’:
- Arithmetic may be performed on them as if they were integers.
- They are printed in a more readable fashion.
Registers defined with ‘struct’ have one advantage over
defining them with ‘flags’:
- One can fetch individual fields like in ‘C’.
(gdb) print $my_struct_reg.field3 $1 = 42
G.2.7 Registers
Each register is represented as an element with this form:
<reg name="name"
bitsize="size"
[regnum="num"]
[save-restore="save-restore"]
[type="type"]
[group="group"]/>
The components are as follows:
- name
-
The register’s name; it must be unique within the target description.
- bitsize
-
The register’s size, in bits.
- regnum
-
The register’s number. If omitted, a register’s number is one greater
than that of the previous register (either in the current feature or in
a preceding feature); the first register in the target description
defaults to zero. This register number is used to read or write
the register; e.g. it is used in the remotepandP
packets, and registers appear in thegandGpackets
in order of increasing register number. - save-restore
-
Whether the register should be preserved across inferior function
calls; this must be eitheryesorno. The default is
yes, which is appropriate for most registers except for
some system control registers; this is not related to the target’s
ABI. - type
-
The type of the register. It may be a predefined type, a type
defined in the current feature, or one of the special typesint
andfloat.intis an integer type of the correct size
for bitsize, andfloatis a floating point type (in the
architecture’s normal floating point format) of the correct size for
bitsize. The default isint. - group
-
The register group to which this register belongs. It can be one of the
standard register groupsgeneral,float,vectoror an
arbitrary string. Group names should be limited to alphanumeric characters.
If a group name is made up of multiple words the words may be separated by
hyphens; e.g.special-grouporultra-special-group. If no
group is specified, GDB will not display the register in
info registers.
G.3 Predefined Target Types
Type definitions in the self-description can build up composite types
from basic building blocks, but can not define fundamental types. Instead,
standard identifiers are provided by GDB for the fundamental
types. The currently supported types are:
bool-
Boolean type, occupying a single bit.
int8int16int24int32int64int128-
Signed integer types holding the specified number of bits.
uint8uint16uint24uint32uint64uint128-
Unsigned integer types holding the specified number of bits.
code_ptrdata_ptr-
Pointers to unspecified code and data. The program counter and
any dedicated return address register may be marked as code
pointers; printing a code pointer converts it into a symbolic
address. The stack pointer and any dedicated address registers
may be marked as data pointers. ieee_half-
Half precision IEEE floating point.
ieee_single-
Single precision IEEE floating point.
ieee_double-
Double precision IEEE floating point.
bfloat16-
The 16-bit brain floating point format used e.g. by x86 and ARM.
arm_fpa_ext-
The 12-byte extended precision format used by ARM FPA registers.
i387_ext-
The 10-byte extended precision format used by x87 registers.
i386_eflags-
32bit EFLAGS register used by x86.
i386_mxcsr-
32bit MXCSR register used by x86.
G.4 Enum Target Types
Enum target types are useful in ‘struct’ and ‘flags’
register descriptions. See Target Description Format.
Enum types have a name, size and a list of name/value pairs.
<enum id="id" size="size"> <evalue name="name" value="value"/> … </enum>
Enums must be defined before they are used.
<enum id="levels_type" size="4"> <evalue name="low" value="0"/> <evalue name="high" value="1"/> </enum> <flags id="flags_type" size="4"> <field name="X" start="0"/> <field name="LEVEL" start="1" end="1" type="levels_type"/> </flags> <reg name="flags" bitsize="32" type="flags_type"/>
Given that description, a value of 3 for the ‘flags’ register
would be printed as:
(gdb) info register flags flags 0x3 [ X LEVEL=high ]
G.5 Standard Target Features
A target description must contain either no registers or all the
target’s registers. If the description contains no registers, then
GDB will assume a default register layout, selected based on
the architecture. If the description contains any registers, the
default layout will not be used; the standard registers must be
described in the target description, in such a way that GDB
can recognize them.
This is accomplished by giving specific names to feature elements
which contain standard registers. GDB will look for features
with those names and verify that they contain the expected registers;
if any known feature is missing required registers, or if any required
feature is missing, GDB will reject the target
description. You can add additional registers to any of the
standard features — GDB will display them just as if
they were added to an unrecognized feature.
This section lists the known features and their expected contents.
Sample XML documents for these features are included in the
GDB source tree, in the directory gdb/features.
Names recognized by GDB should include the name of the
company or organization which selected the name, and the overall
architecture to which the feature applies; so e.g. the feature
containing ARM core registers is named ‘org.gnu.gdb.arm.core’.
The names of registers are not case sensitive for the purpose
of recognizing standard features, but GDB will only display
registers using the capitalization used in the description.
G.5.1 AArch64 Features
The ‘org.gnu.gdb.aarch64.core’ feature is required for AArch64
targets. It should contain registers ‘x0’ through ‘x30’,
‘sp’, ‘pc’, and ‘cpsr’.
The ‘org.gnu.gdb.aarch64.fpu’ feature is optional. If present,
it should contain registers ‘v0’ through ‘v31’, ‘fpsr’,
and ‘fpcr’.
The ‘org.gnu.gdb.aarch64.sve’ feature is optional. If present,
it should contain registers ‘z0’ through ‘z31’, ‘p0’
through ‘p15’, ‘ffr’ and ‘vg’.
The ‘org.gnu.gdb.aarch64.pauth’ feature is optional. If present,
it should contain registers ‘pauth_dmask’ and ‘pauth_cmask’.
G.5.2 ARC Features
ARC processors are so configurable that even core registers and their numbers
are not predetermined completely. Moreover, flags and PC
registers, which are important to GDB, are not “core” registers in
ARC. Therefore, there are two features that their presence is mandatory:
‘org.gnu.gdb.arc.core’ and ‘org.gnu.gdb.arc.aux’.
The ‘org.gnu.gdb.arc.core’ feature is required for all targets. It must
contain registers:
- — ‘r0’ through ‘r25’ for normal register file targets.
- — ‘r0’ through ‘r3’, and ‘r10’ through ‘r15’ for reduced
register file targets. - — ‘gp’, ‘fp’, ‘sp’, ‘r30’23,
‘blink’, ‘lp_count’, ‘pcl’.
In case of an ARCompact target (ARCv1 ISA), the ‘org.gnu.gdb.arc.core’
feature may contain registers ‘ilink1’ and ‘ilink2’. While in case
of ARC EM and ARC HS targets (ARCv2 ISA), register ‘ilink’ may be present.
The difference between ARCv1 and ARCv2 is the naming of registers 29th
and 30th. They are called ‘ilink1’ and ‘ilink2’ for ARCv1 and
are optional. For ARCv2, they are called ‘ilink’ and ‘r30’ and only
‘ilink’ is optional. The optionality of ‘ilink*’ registers is
because of their inaccessibility during user space debugging sessions.
Extension core registers ‘r32’ through ‘r59’ are optional and their
existence depends on the configuration. When debugging GNU/Linux applications,
i.e. user space debugging, these core registers are not available.
The ‘org.gnu.gdb.arc.aux’ feature is required for all ARC targets. Here
is the list of registers pertinent to this feature:
- — mandatory: ‘pc’ and ‘status32’.
- — optional: ‘lp_start’, ‘lp_end’, and ‘bta’.
G.5.3 ARM Features
The ‘org.gnu.gdb.arm.core’ feature is required for non-M-profile
ARM targets.
It should contain registers ‘r0’ through ‘r13’, ‘sp’,
‘lr’, ‘pc’, and ‘cpsr’.
For M-profile targets (e.g. Cortex-M3), the ‘org.gnu.gdb.arm.core’
feature is replaced by ‘org.gnu.gdb.arm.m-profile’. It should contain
registers ‘r0’ through ‘r13’, ‘sp’, ‘lr’, ‘pc’,
and ‘xpsr’.
The ‘org.gnu.gdb.arm.fpa’ feature is optional. If present, it
should contain registers ‘f0’ through ‘f7’ and ‘fps’.
The ‘org.gnu.gdb.arm.m-profile-mve’ feature is optional. If present, it
must contain register ‘vpr’.
If the ‘org.gnu.gdb.arm.m-profile-mve’ feature is available, GDB
will synthesize the ‘p0’ pseudo register from ‘vpr’ contents.
If the ‘org.gnu.gdb.arm.vfp’ feature is available alongside the
‘org.gnu.gdb.arm.m-profile-mve’ feature, GDB will
synthesize the ‘q’ pseudo registers from ‘d’ register
contents.
The ‘org.gnu.gdb.xscale.iwmmxt’ feature is optional. If present,
it should contain at least registers ‘wR0’ through ‘wR15’ and
‘wCGR0’ through ‘wCGR3’. The ‘wCID’, ‘wCon’,
‘wCSSF’, and ‘wCASF’ registers are optional.
The ‘org.gnu.gdb.arm.vfp’ feature is optional. If present, it
should contain at least registers ‘d0’ through ‘d15’. If
they are present, ‘d16’ through ‘d31’ should also be included.
GDB will synthesize the single-precision registers from
halves of the double-precision registers.
The ‘org.gnu.gdb.arm.neon’ feature is optional. It does not
need to contain registers; it instructs GDB to display the
VFP double-precision registers as vectors and to synthesize the
quad-precision registers from pairs of double-precision registers.
If this feature is present, ‘org.gnu.gdb.arm.vfp’ must also
be present and include 32 double-precision registers.
The ‘org.gnu.gdb.arm.m-profile-pacbti’ feature is optional, and
acknowledges support for the ARMv8.1-m PACBTI extensions. GDB
will track return address signing states and will decorate backtraces using
the [PAC] marker, similar to AArch64’s PAC extension.
See AArch64 PAC.
G.5.4 i386 Features
The ‘org.gnu.gdb.i386.core’ feature is required for i386/amd64
targets. It should describe the following registers:
- — ‘eax’ through ‘edi’ plus ‘eip’ for i386
- — ‘rax’ through ‘r15’ plus ‘rip’ for amd64
- — ‘eflags’, ‘cs’, ‘ss’, ‘ds’, ‘es’,
‘fs’, ‘gs’ - — ‘st0’ through ‘st7’
- — ‘fctrl’, ‘fstat’, ‘ftag’, ‘fiseg’, ‘fioff’,
‘foseg’, ‘fooff’ and ‘fop’
The register sets may be different, depending on the target.
The ‘org.gnu.gdb.i386.sse’ feature is optional. It should
describe registers:
- — ‘xmm0’ through ‘xmm7’ for i386
- — ‘xmm0’ through ‘xmm15’ for amd64
- — ‘mxcsr’
The ‘org.gnu.gdb.i386.avx’ feature is optional and requires the
‘org.gnu.gdb.i386.sse’ feature. It should
describe the upper 128 bits of YMM registers:
- — ‘ymm0h’ through ‘ymm7h’ for i386
- — ‘ymm0h’ through ‘ymm15h’ for amd64
The ‘org.gnu.gdb.i386.mpx’ is an optional feature representing Intel
Memory Protection Extension (MPX). It should describe the following registers:
- — ‘bnd0raw’ through ‘bnd3raw’ for i386 and amd64.
- — ‘bndcfgu’ and ‘bndstatus’ for i386 and amd64.
The ‘org.gnu.gdb.i386.linux’ feature is optional. It should
describe a single register, ‘orig_eax’.
The ‘org.gnu.gdb.i386.segments’ feature is optional. It should
describe two system registers: ‘fs_base’ and ‘gs_base’.
The ‘org.gnu.gdb.i386.avx512’ feature is optional and requires the
‘org.gnu.gdb.i386.avx’ feature. It should
describe additional XMM registers:
- — ‘xmm16h’ through ‘xmm31h’, only valid for amd64.
It should describe the upper 128 bits of additional YMM registers:
- — ‘ymm16h’ through ‘ymm31h’, only valid for amd64.
It should
describe the upper 256 bits of ZMM registers:
- — ‘zmm0h’ through ‘zmm7h’ for i386.
- — ‘zmm0h’ through ‘zmm15h’ for amd64.
It should
describe the additional ZMM registers:
- — ‘zmm16h’ through ‘zmm31h’, only valid for amd64.
The ‘org.gnu.gdb.i386.pkeys’ feature is optional. It should
describe a single register, ‘pkru’. It is a 32-bit register
valid for i386 and amd64.
G.5.5 LoongArch Features
The ‘org.gnu.gdb.loongarch.base’ feature is required for LoongArch
targets. It should contain the registers ‘r0’ through ‘r31’,
‘pc’, and ‘badv’. Either the architectural names (‘r0’,
‘r1’, etc) can be used, or the ABI names (‘zero’, ‘ra’, etc).
The ‘org.gnu.gdb.loongarch.fpu’ feature is optional. If present,
it should contain registers ‘f0’ through ‘f31’, ‘fcc’,
and ‘fcsr’.
G.5.6 MicroBlaze Features
The ‘org.gnu.gdb.microblaze.core’ feature is required for MicroBlaze
targets. It should contain registers ‘r0’ through ‘r31’,
‘rpc’, ‘rmsr’, ‘rear’, ‘resr’, ‘rfsr’, ‘rbtr’,
‘rpvr’, ‘rpvr1’ through ‘rpvr11’, ‘redr’, ‘rpid’,
‘rzpr’, ‘rtlbx’, ‘rtlbsx’, ‘rtlblo’, and ‘rtlbhi’.
The ‘org.gnu.gdb.microblaze.stack-protect’ feature is optional.
If present, it should contain registers ‘rshr’ and ‘rslr’
G.5.7 MIPS Features
The ‘org.gnu.gdb.mips.cpu’ feature is required for MIPS targets.
It should contain registers ‘r0’ through ‘r31’, ‘lo’,
‘hi’, and ‘pc’. They may be 32-bit or 64-bit depending
on the target.
The ‘org.gnu.gdb.mips.cp0’ feature is also required. It should
contain at least the ‘status’, ‘badvaddr’, and ‘cause’
registers. They may be 32-bit or 64-bit depending on the target.
The ‘org.gnu.gdb.mips.fpu’ feature is currently required, though
it may be optional in a future version of GDB. It should
contain registers ‘f0’ through ‘f31’, ‘fcsr’, and
‘fir’. They may be 32-bit or 64-bit depending on the target.
The ‘org.gnu.gdb.mips.dsp’ feature is optional. It should
contain registers ‘hi1’ through ‘hi3’, ‘lo1’ through
‘lo3’, and ‘dspctl’. The ‘dspctl’ register should
be 32-bit and the rest may be 32-bit or 64-bit depending on the target.
The ‘org.gnu.gdb.mips.linux’ feature is optional. It should
contain a single register, ‘restart’, which is used by the
Linux kernel to control restartable syscalls.
G.5.8 M68K Features
‘org.gnu.gdb.m68k.core’‘org.gnu.gdb.coldfire.core’‘org.gnu.gdb.fido.core’-
One of those features must be always present.
The feature that is present determines which flavor of m68k is
used. The feature that is present should contain registers
‘d0’ through ‘d7’, ‘a0’ through ‘a5’, ‘fp’,
‘sp’, ‘ps’ and ‘pc’. ‘org.gnu.gdb.coldfire.fp’-
This feature is optional. If present, it should contain registers
‘fp0’ through ‘fp7’, ‘fpcontrol’, ‘fpstatus’ and
‘fpiaddr’.Note that, despite the fact that this feature’s name says
‘coldfire’, it is used to describe any floating point registers.
The size of the registers must match the main m68k flavor; so, for
example, if the primary feature is reported as ‘coldfire’, then
64-bit floating point registers are required.
G.5.9 NDS32 Features
The ‘org.gnu.gdb.nds32.core’ feature is required for NDS32
targets. It should contain at least registers ‘r0’ through
‘r10’, ‘r15’, ‘fp’, ‘gp’, ‘lp’, ‘sp’,
and ‘pc’.
The ‘org.gnu.gdb.nds32.fpu’ feature is optional. If present,
it should contain 64-bit double-precision floating-point registers
‘fd0’ through fdN, which should be ‘fd3’, ‘fd7’,
‘fd15’, or ‘fd31’ based on the FPU configuration implemented.
Note: The first sixteen 64-bit double-precision floating-point
registers are overlapped with the thirty-two 32-bit single-precision
floating-point registers. The 32-bit single-precision registers, if
not being listed explicitly, will be synthesized from halves of the
overlapping 64-bit double-precision registers. Listing 32-bit
single-precision registers explicitly is deprecated, and the
support to it could be totally removed some day.
G.5.10 Nios II Features
The ‘org.gnu.gdb.nios2.cpu’ feature is required for Nios II
targets. It should contain the 32 core registers (‘zero’,
‘at’, ‘r2’ through ‘r23’, ‘et’ through ‘ra’),
‘pc’, and the 16 control registers (‘status’ through
‘mpuacc’).
G.5.11 Openrisc 1000 Features
The ‘org.gnu.gdb.or1k.group0’ feature is required for OpenRISC 1000
targets. It should contain the 32 general purpose registers (‘r0’
through ‘r31’), ‘ppc’, ‘npc’ and ‘sr’.
G.5.12 PowerPC Features
The ‘org.gnu.gdb.power.core’ feature is required for PowerPC
targets. It should contain registers ‘r0’ through ‘r31’,
‘pc’, ‘msr’, ‘cr’, ‘lr’, ‘ctr’, and
‘xer’. They may be 32-bit or 64-bit depending on the target.
The ‘org.gnu.gdb.power.fpu’ feature is optional. It should
contain registers ‘f0’ through ‘f31’ and ‘fpscr’.
The ‘org.gnu.gdb.power.altivec’ feature is optional. It should
contain registers ‘vr0’ through ‘vr31’, ‘vscr’, and
‘vrsave’. GDB will define pseudo-registers ‘v0’
through ‘v31’ as aliases for the corresponding ‘vrX’
registers.
The ‘org.gnu.gdb.power.vsx’ feature is optional. It should
contain registers ‘vs0h’ through ‘vs31h’. GDB will
combine these registers with the floating point registers (‘f0’
through ‘f31’) and the altivec registers (‘vr0’ through
‘vr31’) to present the 128-bit wide registers ‘vs0’ through
‘vs63’, the set of vector-scalar registers for POWER7.
Therefore, this feature requires both ‘org.gnu.gdb.power.fpu’ and
‘org.gnu.gdb.power.altivec’.
The ‘org.gnu.gdb.power.spe’ feature is optional. It should
contain registers ‘ev0h’ through ‘ev31h’, ‘acc’, and
‘spefscr’. SPE targets should provide 32-bit registers in
‘org.gnu.gdb.power.core’ and provide the upper halves in
‘ev0h’ through ‘ev31h’. GDB will combine
these to present registers ‘ev0’ through ‘ev31’ to the
user.
The ‘org.gnu.gdb.power.ppr’ feature is optional. It should
contain the 64-bit register ‘ppr’.
The ‘org.gnu.gdb.power.dscr’ feature is optional. It should
contain the 64-bit register ‘dscr’.
The ‘org.gnu.gdb.power.tar’ feature is optional. It should
contain the 64-bit register ‘tar’.
The ‘org.gnu.gdb.power.ebb’ feature is optional. It should
contain registers ‘bescr’, ‘ebbhr’ and ‘ebbrr’, all
64-bit wide.
The ‘org.gnu.gdb.power.linux.pmu’ feature is optional. It should
contain registers ‘mmcr0’, ‘mmcr2’, ‘siar’, ‘sdar’
and ‘sier’, all 64-bit wide. This is the subset of the isa 2.07
server PMU registers provided by GNU/Linux.
The ‘org.gnu.gdb.power.htm.spr’ feature is optional. It should
contain registers ‘tfhar’, ‘texasr’ and ‘tfiar’, all
64-bit wide.
The ‘org.gnu.gdb.power.htm.core’ feature is optional. It should
contain the checkpointed general-purpose registers ‘cr0’ through
‘cr31’, as well as the checkpointed registers ‘clr’ and
‘cctr’. These registers may all be either 32-bit or 64-bit
depending on the target. It should also contain the checkpointed
registers ‘ccr’ and ‘cxer’, which should both be 32-bit
wide.
The ‘org.gnu.gdb.power.htm.fpu’ feature is optional. It should
contain the checkpointed 64-bit floating-point registers ‘cf0’
through ‘cf31’, as well as the checkpointed 64-bit register
‘cfpscr’.
The ‘org.gnu.gdb.power.htm.altivec’ feature is optional. It
should contain the checkpointed altivec registers ‘cvr0’ through
‘cvr31’, all 128-bit wide. It should also contain the
checkpointed registers ‘cvscr’ and ‘cvrsave’, both 32-bit
wide.
The ‘org.gnu.gdb.power.htm.vsx’ feature is optional. It should
contain registers ‘cvs0h’ through ‘cvs31h’. GDB
will combine these registers with the checkpointed floating point
registers (‘cf0’ through ‘cf31’) and the checkpointed
altivec registers (‘cvr0’ through ‘cvr31’) to present the
128-bit wide checkpointed vector-scalar registers ‘cvs0’ through
‘cvs63’. Therefore, this feature requires both
‘org.gnu.gdb.power.htm.altivec’ and
‘org.gnu.gdb.power.htm.fpu’.
The ‘org.gnu.gdb.power.htm.ppr’ feature is optional. It should
contain the 64-bit checkpointed register ‘cppr’.
The ‘org.gnu.gdb.power.htm.dscr’ feature is optional. It should
contain the 64-bit checkpointed register ‘cdscr’.
The ‘org.gnu.gdb.power.htm.tar’ feature is optional. It should
contain the 64-bit checkpointed register ‘ctar’.
G.5.13 RISC-V Features
The ‘org.gnu.gdb.riscv.cpu’ feature is required for RISC-V
targets. It should contain the registers ‘x0’ through
‘x31’, and ‘pc’. Either the architectural names (‘x0’,
‘x1’, etc) can be used, or the ABI names (‘zero’, ‘ra’,
etc).
The ‘org.gnu.gdb.riscv.fpu’ feature is optional. If present, it
should contain registers ‘f0’ through ‘f31’, ‘fflags’,
‘frm’, and ‘fcsr’. As with the cpu feature, either the
architectural register names, or the ABI names can be used.
The ‘org.gnu.gdb.riscv.virtual’ feature is optional. If present,
it should contain registers that are not backed by real registers on
the target, but are instead virtual, where the register value is
derived from other target state. In many ways these are like
GDBs pseudo-registers, except implemented by the target.
Currently the only register expected in this set is the one byte
‘priv’ register that contains the target’s privilege level in the
least significant two bits.
The ‘org.gnu.gdb.riscv.csr’ feature is optional. If present, it
should contain all of the target’s standard CSRs. Standard CSRs are
those defined in the RISC-V specification documents. There is some
overlap between this feature and the fpu feature; the ‘fflags’,
‘frm’, and ‘fcsr’ registers could be in either feature. The
expectation is that these registers will be in the fpu feature if the
target has floating point hardware, but can be moved into the csr
feature if the target has the floating point control registers, but no
other floating point hardware.
The ‘org.gnu.gdb.riscv.vector’ feature is optional. If present,
it should contain registers ‘v0’ through ‘v31’, all of which
must be the same size. These requirements are based on the v0.10
draft vector extension, as the vector extension is not yet final. In
the event that the register set of the vector extension changes for
the final specification, the requirements given here could change for
future releases of GDB.
G.5.14 RX Features
The ‘org.gnu.gdb.rx.core’ feature is required for RX
targets. It should contain the registers ‘r0’ through
‘r15’, ‘usp’, ‘isp’, ‘psw’, ‘pc’, ‘intb’,
‘bpsw’, ‘bpc’, ‘fintv’, ‘fpsw’, and ‘acc’.
G.5.15 S/390 and System z Features
The ‘org.gnu.gdb.s390.core’ feature is required for S/390 and
System z targets. It should contain the PSW and the 16 general
registers. In particular, System z targets should provide the 64-bit
registers ‘pswm’, ‘pswa’, and ‘r0’ through ‘r15’.
S/390 targets should provide the 32-bit versions of these registers.
A System z target that runs in 31-bit addressing mode should provide
32-bit versions of ‘pswm’ and ‘pswa’, as well as the general
register’s upper halves ‘r0h’ through ‘r15h’, and their
lower halves ‘r0l’ through ‘r15l’.
The ‘org.gnu.gdb.s390.fpr’ feature is required. It should
contain the 64-bit registers ‘f0’ through ‘f15’, and
‘fpc’.
The ‘org.gnu.gdb.s390.acr’ feature is required. It should
contain the 32-bit registers ‘acr0’ through ‘acr15’.
The ‘org.gnu.gdb.s390.linux’ feature is optional. It should
contain the register ‘orig_r2’, which is 64-bit wide on System z
targets and 32-bit otherwise. In addition, the feature may contain
the ‘last_break’ register, whose width depends on the addressing
mode, as well as the ‘system_call’ register, which is always
32-bit wide.
The ‘org.gnu.gdb.s390.tdb’ feature is optional. It should
contain the 64-bit registers ‘tdb0’, ‘tac’, ‘tct’,
‘atia’, and ‘tr0’ through ‘tr15’.
The ‘org.gnu.gdb.s390.vx’ feature is optional. It should contain
64-bit wide registers ‘v0l’ through ‘v15l’, which will be
combined by GDB with the floating point registers ‘f0’
through ‘f15’ to present the 128-bit wide vector registers
‘v0’ through ‘v15’. In addition, this feature should
contain the 128-bit wide vector registers ‘v16’ through
‘v31’.
The ‘org.gnu.gdb.s390.gs’ feature is optional. It should contain
the 64-bit wide guarded-storage-control registers ‘gsd’,
‘gssm’, and ‘gsepla’.
The ‘org.gnu.gdb.s390.gsbc’ feature is optional. It should contain
the 64-bit wide guarded-storage broadcast control registers
‘bc_gsd’, ‘bc_gssm’, and ‘bc_gsepla’.
G.5.16 Sparc Features
The ‘org.gnu.gdb.sparc.cpu’ feature is required for sparc32/sparc64
targets. It should describe the following registers:
- — ‘g0’ through ‘g7’
- — ‘o0’ through ‘o7’
- — ‘l0’ through ‘l7’
- — ‘i0’ through ‘i7’
They may be 32-bit or 64-bit depending on the target.
Also the ‘org.gnu.gdb.sparc.fpu’ feature is required for sparc32/sparc64
targets. It should describe the following registers:
- — ‘f0’ through ‘f31’
- — ‘f32’ through ‘f62’ for sparc64
The ‘org.gnu.gdb.sparc.cp0’ feature is required for sparc32/sparc64
targets. It should describe the following registers:
- — ‘y’, ‘psr’, ‘wim’, ‘tbr’, ‘pc’, ‘npc’,
‘fsr’, and ‘csr’ for sparc32 - — ‘pc’, ‘npc’, ‘state’, ‘fsr’, ‘fprs’, and ‘y’
for sparc64
G.5.17 TMS320C6x Features
The ‘org.gnu.gdb.tic6x.core’ feature is required for TMS320C6x
targets. It should contain registers ‘A0’ through ‘A15’,
registers ‘B0’ through ‘B15’, ‘CSR’ and ‘PC’.
The ‘org.gnu.gdb.tic6x.gp’ feature is optional. It should
contain registers ‘A16’ through ‘A31’ and ‘B16’
through ‘B31’.
The ‘org.gnu.gdb.tic6x.c6xp’ feature is optional. It should
contain registers ‘TSR’, ‘ILC’ and ‘RILC’.
Appendix H Operating System Information
Users of GDB often wish to obtain information about the state of
the operating system running on the target—for example the list of
processes, or the list of open files. This section describes the
mechanism that makes it possible. This mechanism is similar to the
target features mechanism (see Target Descriptions), but focuses
on a different aspect of target.
Operating system information is retrieved from the target via the
remote protocol, using ‘qXfer’ requests (see qXfer osdata read). The object name in the request should be ‘osdata’, and
the annex identifies the data to be fetched.
H.1 Process list
When requesting the process list, the annex field in the
‘qXfer’ request should be ‘processes’. The returned data is
an XML document. The formal syntax of this document is defined in
gdb/features/osdata.dtd.
An example document is:
<?xml version="1.0"?>
<!DOCTYPE target SYSTEM "osdata.dtd">
<osdata type="processes">
<item>
<column name="pid">1</column>
<column name="user">root</column>
<column name="command">/sbin/init</column>
<column name="cores">1,2,3</column>
</item>
</osdata>
Each item should include a column whose name is ‘pid’. The value
of that column should identify the process on the target. The
‘user’ and ‘command’ columns are optional, and will be
displayed by GDB. The ‘cores’ column, if present,
should contain a comma-separated list of cores that this process
is running on. Target may provide additional columns,
which GDB currently ignores.
Appendix I Trace File Format
The trace file comes in three parts: a header, a textual description
section, and a trace frame section with binary data.
The header has the form x7fTRACE0n. The first byte is
0x7f so as to indicate that the file contains binary data,
while the 0 is a version number that may have different values
in the future.
The description section consists of multiple lines of ASCII text
separated by newline characters (0xa). The lines may include a
variety of optional descriptive or context-setting information, such
as tracepoint definitions or register set size. GDB will
ignore any line that it does not recognize. An empty line marks the end
of this section.
R size-
Specifies the size of a register block in bytes. This is equal to the
size of agpacket payload in the remote protocol. size
is an ascii decimal number. There should be only one such line in
a single trace file. status status-
Trace status. status has the same format as a
qTStatus
remote packet reply. There should be only one such line in a single trace
file. tp payload-
Tracepoint definition. The payload has the same format as
qTfP/qTsPremote packet reply payload. A single tracepoint
may take multiple lines of definition, corresponding to the multiple
reply packets. tsv payload-
Trace state variable definition. The payload has the same format as
qTfV/qTsVremote packet reply payload. A single variable
may take multiple lines of definition, corresponding to the multiple
reply packets. tdesc payload-
Target description in XML format. The payload is a single line of
the XML file. All such lines should be concatenated together to get
the original XML file. This file is in the same format asqXfer
featurespayload, and corresponds to the maintarget.xml
file. Includes are not allowed.
The trace frame section consists of a number of consecutive frames.
Each frame begins with a two-byte tracepoint number, followed by a
four-byte size giving the amount of data in the frame. The data in
the frame consists of a number of blocks, each introduced by a
character indicating its type (at least register, memory, and trace
state variable). The data in this section is raw binary, not a
hexadecimal or other encoding; its endianness matches the target’s
endianness.
R bytes-
Register block. The number and ordering of bytes matches that of a
gpacket in the remote protocol. Note that these are the
actual bytes, in target order, not a hexadecimal encoding. M address length bytes...-
Memory block. This is a contiguous block of memory, at the 8-byte
address address, with a 2-byte length length, followed by
length bytes. V number value-
Trace state variable block. This records the 8-byte signed value
value of trace state variable numbered number.
Future enhancements of the trace file format may include additional types
of blocks.
Appendix J .gdb_index section format
This section documents the index section that is created by save (see Index Files). The index section is
gdb-index
DWARF-specific; some knowledge of DWARF is assumed in this
description.
The mapped index file format is designed to be directly
mmapable on any architecture. In most cases, a datum is
represented using a little-endian 32-bit integer value, called an
offset_type. Big endian machines must byte-swap the values
before using them. Exceptions to this rule are noted. The data is
laid out such that alignment is always respected.
A mapped index consists of several areas, laid out in order.
- The file header. This is a sequence of values, of
offset_type
unless otherwise noted:- The version number, currently 8. Versions 1, 2 and 3 are obsolete.
Version 4 uses a different hashing function from versions 5 and 6.
Version 6 includes symbols for inlined functions, whereas versions 4
and 5 do not. Version 7 adds attributes to the CU indices in the
symbol table. Version 8 specifies that symbols from DWARF type units
(‘DW_TAG_type_unit’) refer to the type unit’s symbol table and not the
compilation unit (‘DW_TAG_comp_unit’) using the type.GDB will only read version 4, 5, or 6 indices
by specifyingset use-deprecated-index-sections on.
GDB has a workaround for potentially broken version 7 indices so it is
currently not flagged as deprecated. - The offset, from the start of the file, of the CU list.
- The offset, from the start of the file, of the types CU list. Note
that this area can be empty, in which case this offset will be equal
to the next offset. - The offset, from the start of the file, of the address area.
- The offset, from the start of the file, of the symbol table.
- The offset, from the start of the file, of the constant pool.
- The version number, currently 8. Versions 1, 2 and 3 are obsolete.
- The CU list. This is a sequence of pairs of 64-bit little-endian
values, sorted by the CU offset. The first element in each pair is
the offset of a CU in the.debug_infosection. The second
element in each pair is the length of that CU. References to a CU
elsewhere in the map are done using a CU index, which is just the
0-based index into this table. Note that if there are type CUs, then
conceptually CUs and type CUs form a single list for the purposes of
CU indices. - The types CU list. This is a sequence of triplets of 64-bit
little-endian values. In a triplet, the first value is the CU offset,
the second value is the type offset in the CU, and the third value is
the type signature. The types CU list is not sorted. - The address area. The address area consists of a sequence of address
entries. Each address entry has three elements:- The low address. This is a 64-bit little-endian value.
- The high address. This is a 64-bit little-endian value. Like
DW_AT_high_pc, the value is one byte beyond the end. - The CU index. This is an
offset_typevalue.
- The symbol table. This is an open-addressed hash table. The size of
the hash table is always a power of 2.Each slot in the hash table consists of a pair of
offset_type
values. The first value is the offset of the symbol’s name in the
constant pool. The second value is the offset of the CU vector in the
constant pool.If both values are 0, then this slot in the hash table is empty. This
is ok because while 0 is a valid constant pool index, it cannot be a
valid index for both a string and a CU vector.The hash value for a table entry is computed by applying an
iterative hash function to the symbol’s name. Starting with an
initial value ofr = 0, each (unsigned) character ‘c’ in
the string is incorporated into the hash using the formula depending on the
index version:- Version 4
-
The formula is
r = r * 67 + c - 113. - Versions 5 to 7
-
The formula is
r = r * 67 + tolower (c) - 113.
The terminating ‘’ is not incorporated into the hash.
The step size used in the hash table is computed via
((hash * 17) & (size - 1)) | 1, where ‘hash’ is the hash
value, and ‘size’ is the size of the hash table. The step size
is used to find the next candidate slot when handling a hash
collision.The names of C++ symbols in the hash table are canonicalized. We
don’t currently have a simple description of the canonicalization
algorithm; if you intend to create new index sections, you must read
the code. - The constant pool. This is simply a bunch of bytes. It is organized
so that alignment is correct: CU vectors are stored first, followed by
strings.A CU vector in the constant pool is a sequence of
offset_type
values. The first value is the number of CU indices in the vector.
Each subsequent value is the index and symbol attributes of a CU in
the CU list. This element in the hash table is used to indicate which
CUs define the symbol and how the symbol is used.
See below for the format of each CU index+attributes entry.A string in the constant pool is zero-terminated.
Attributes were added to CU index values in .gdb_index version 7.
If a symbol has multiple uses within a CU then there is one
CU index+attributes value for each use.
The format of each CU index+attributes entry is as follows
(bit 0 = LSB):
- Bits 0-23
-
This is the index of the CU in the CU list.
- Bits 24-27
-
These bits are reserved for future purposes and must be zero.
- Bits 28-30
-
The kind of the symbol in the CU.
- 0
-
This value is reserved and should not be used.
By reserving zero the fulloffset_typevalue is backwards compatible
with previous versions of the index. - 1
-
The symbol is a type.
- 2
-
The symbol is a variable or an enum value.
- 3
-
The symbol is a function.
- 4
-
Any other kind of symbol.
- 5,6,7
-
These values are reserved.
- Bit 31
-
This bit is zero if the value is global and one if it is static.
The determination of whether a symbol is global or static is complicated.
The authorative reference is the file dwarf2read.c in
GDB sources.
This pseudo-code describes the computation of a symbol’s kind and
global/static attributes in the index.
is_external = get_attribute (die, DW_AT_external);
language = get_attribute (cu_die, DW_AT_language);
switch (die->tag)
{
case DW_TAG_typedef:
case DW_TAG_base_type:
case DW_TAG_subrange_type:
kind = TYPE;
is_static = 1;
break;
case DW_TAG_enumerator:
kind = VARIABLE;
is_static = language != CPLUS;
break;
case DW_TAG_subprogram:
kind = FUNCTION;
is_static = ! (is_external || language == ADA);
break;
case DW_TAG_constant:
kind = VARIABLE;
is_static = ! is_external;
break;
case DW_TAG_variable:
kind = VARIABLE;
is_static = ! is_external;
break;
case DW_TAG_namespace:
kind = TYPE;
is_static = 0;
break;
case DW_TAG_class_type:
case DW_TAG_interface_type:
case DW_TAG_structure_type:
case DW_TAG_union_type:
case DW_TAG_enumeration_type:
kind = TYPE;
is_static = language != CPLUS;
break;
default:
assert (0);
}
Appendix K Download debugging resources with Debuginfod
debuginfod is an HTTP server for distributing ELF, DWARF and source
files.
With the debuginfod client library, libdebuginfod, GDB
can query servers using the build IDs associated with missing debug info,
executables and source files in order to download them on demand.
For instructions on building GDB with libdebuginfod,
see –with-debuginfod. debuginfod is packaged
with elfutils, starting with version 0.178. See
https://sourceware.org/elfutils/Debuginfod.html for more information
regarding debuginfod.
K.1 Debuginfod Settings
GDB provides the following commands for configuring debuginfod.
set debuginfod enabledset debuginfod enabled on-
GDB will attempt to query
debuginfodservers when missing debug
info or source files. set debuginfod enabled off-
GDB will not attempt to query
debuginfodservers when missing
debug info or source files. By default,debuginfod enabledis set to
offfor non-interactive sessions. set debuginfod enabled ask-
GDB will prompt the user to enable or disable
debuginfodbefore
attempting to perform the next query. By default,debuginfod enabled
is set toaskfor interactive sessions. show debuginfod enabled-
Display whether
debuginfod enabledis set toon,offor
ask. set debuginfod urlsset debuginfod urls urls-
Set the space-separated list of URLs that
debuginfodwill attempt to
query. Onlyhttp://,https://andfile://protocols
should be used. The default value ofdebuginfod urlsis copied from
the DEBUGINFOD_URLS environment variable. show debuginfod urls-
Display the list of URLs that
debuginfodwill attempt to query. set debuginfod verboseset debuginfod verbose n-
Enable or disable
debuginfod-related output. Use a non-zero value
to enable and0to disable.debuginfodoutput is shown by
default. show debuginfod verbose-
Show the current verbosity setting.
Appendix L Manual pages
gdb man
gdb man
gdb [OPTIONS] [prog|prog procID|prog core]
The purpose of a debugger such as GDB is to allow you to see what is
going on “inside” another program while it executes – or what another
program was doing at the moment it crashed.
GDB can do four main kinds of things (plus other things in support of
these) to help you catch bugs in the act:
- Start your program, specifying anything that might affect its behavior.
- Make your program stop on specified conditions.
- Examine what has happened, when your program has stopped.
- Change things in your program, so you can experiment with correcting the
effects of one bug and go on to learn about another.
You can use GDB to debug programs written in C, C++, Fortran and
Modula-2.
GDB is invoked with the shell command gdb. Once started, it reads
commands from the terminal until you tell it to exit with the GDB
command quit or exit. You can get online help from GDB itself
by using the command help.
You can run gdb with no arguments or options; but the most
usual way to start GDB is with one argument or two, specifying an
executable program as the argument:
You can also start with both an executable program and a core file specified:
You can, instead, specify a process ID as a second argument or use option
-p, if you want to debug a running process:
gdb program 1234 gdb -p 1234
would attach GDB to process 1234. With option -p you
can omit the program filename.
Here are some of the most frequently needed GDB commands:
break [file:][function|line]-
Set a breakpoint at function or line (in file).
run [arglist]-
Start your program (with arglist, if specified).
bt-
Backtrace: display the program stack.
print expr-
Display the value of an expression.
c-
Continue running your program (after stopping, e.g. at a breakpoint).
next-
Execute next program line (after stopping); step over any
function calls in the line. edit [file:]function-
look at the program line where it is presently stopped.
list [file:]function-
type the text of the program in the vicinity of where it is presently stopped.
step-
Execute next program line (after stopping); step into any
function calls in the line. help [name]-
Show information about GDB command name, or general information
about using GDB. quitexit-
Exit from GDB.
Any arguments other than options specify an executable
file and core file (or process ID); that is, the first argument
encountered with no
associated option flag is equivalent to a —se option, and the second,
if any, is equivalent to a -c option if it’s the name of a file.
Many options have
both long and abbreviated forms; both are shown here. The long forms are also
recognized if you truncate them, so long as enough of the option is
present to be unambiguous.
The abbreviated forms are shown here with ‘—’ and long forms are shown
with ‘—’ to reflect how they are shown in —help. However,
GDB recognizes all of the following conventions for most options:
--option=value--option value-option=value-option value--o=value--o value-o=value-o value
All the options and command line arguments you give are processed
in sequential order. The order makes a difference when the -x
option is used.
--help-h-
List all options, with brief explanations.
--symbols=file-s file-
Read symbol table from file.
--write-
Enable writing into executable and core files.
--exec=file-e file-
Use file as the executable file to execute when
appropriate, and for examining pure data in conjunction with a core
dump. --se=file-
Read symbol table from file and use it as the executable
file. --core=file-c file-
Use file as a core dump to examine.
--command=file-x file-
Execute GDB commands from file.
--eval-command=command-ex command-
Execute given GDB command.
--init-eval-command=command-iex-
Execute GDB command before loading the inferior.
--directory=directory-d directory-
Add directory to the path to search for source files.
--nh-
Do not execute commands from ~/.config/gdb/gdbinit,
~/.gdbinit, ~/.config/gdb/gdbearlyinit, or
~/.gdbearlyinit --nx-n-
Do not execute commands from any .gdbinit or
.gdbearlyinit initialization files. --quiet--silent-q-
“Quiet”. Do not print the introductory and copyright messages. These
messages are also suppressed in batch mode. --batch-
Run in batch mode. Exit with status
0after processing all the command
files specified with -x (and .gdbinit, if not inhibited).
Exit with nonzero status if an error occurs in executing the GDB
commands in the command files.Batch mode may be useful for running GDB as a filter, for example to
download and run a program on another computer; in order to make this
more useful, the message(which is ordinarily issued whenever a program running under GDB control
terminates) is not issued when running in batch mode. --batch-silent-
Run in batch mode, just like —batch, but totally silent. All GDB
output is supressed (stderr is unaffected). This is much quieter than
—silent and would be useless for an interactive session.This is particularly useful when using targets that give ‘Loading section’
messages, for example.Note that targets that give their output via GDB, as opposed to writing
directly tostdout, will also be made silent. --args prog [arglist]-
Change interpretation of command line so that arguments following this
option are passed as arguments to the inferior. As an example, take
the following command:It would start GDB with -q, not printing the introductory message. On
the other hand, using:starts GDB with the introductory message, and passes the option to the inferior.
--pid=pid-
Attach GDB to an already running program, with the PID pid.
--tui-
Open the terminal user interface.
--readnow-
Read all symbols from the given symfile on the first access.
--readnever-
Do not read symbol files.
--return-child-result-
GDB’s exit code will be the same as the child’s exit code.
--configuration-
Print details about GDB configuration and then exit.
--version-
Print version information and then exit.
--cd=directory-
Run GDB using directory as its working directory,
instead of the current directory. --data-directory=directory-D-
Run GDB using directory as its data directory. The data
directory is where GDB searches for its auxiliary files. --fullname-f-
Emacs sets this option when it runs GDB as a subprocess. It tells
GDB to output the full file name and line number in a standard,
recognizable fashion each time a stack frame is displayed (which
includes each time the program stops). This recognizable format looks
like two ‘32’ characters, followed by the file name, line number
and character position separated by colons, and a newline. The
Emacs-to-GDB interface program uses the two ‘32’
characters as a signal to display the source code for the frame. -b baudrate-
Set the line speed (baud rate or bits per second) of any serial
interface used by GDB for remote debugging. -l timeout-
Set timeout, in seconds, for remote debugging.
--tty=device-
Run using device for your program’s standard input and output.
gdbserver man
gdbserver man
gdbserver comm prog [args…] gdbserver –attach comm pid gdbserver –multi comm
gdbserver is a program that allows you to run GDB on a different machine
than the one which is running the program being debugged.
Usage (server (target) side)
First, you need to have a copy of the program you want to debug put onto
the target system. The program can be stripped to save space if needed, as
gdbserver doesn’t care about symbols. All symbol handling is taken care of by
the GDB running on the host system.
To use the server, you log on to the target system, and run the gdbserver
program. You must tell it (a) how to communicate with GDB, (b) the name of
your program, and (c) its arguments. The general syntax is:
target> gdbserver comm program [args ...]
For example, using a serial port, you might say:
target> gdbserver /dev/com1 emacs foo.txt
This tells gdbserver to debug emacs with an argument of foo.txt, and
to communicate with GDB via /dev/com1. gdbserver now
waits patiently for the host GDB to communicate with it.
To use a TCP connection, you could say:
target> gdbserver host:2345 emacs foo.txt
This says pretty much the same thing as the last example, except that we are
going to communicate with the host GDB via TCP. The host:2345 argument means
that we are expecting to see a TCP connection from host to local TCP port
2345. (Currently, the host part is ignored.) You can choose any number you
want for the port number as long as it does not conflict with any existing TCP
ports on the target system. This same port number must be used in the host
GDBs target remote command, which will be described shortly. Note that if
you chose a port number that conflicts with another service, gdbserver will
print an error message and exit.
gdbserver can also attach to running programs.
This is accomplished via the —attach argument. The syntax is:
target> gdbserver --attach comm pid
pid is the process ID of a currently running process. It isn’t
necessary to point gdbserver at a binary for the running process.
To start gdbserver without supplying an initial command to run
or process ID to attach, use the —multi command line option.
In such case you should connect using target extended-remote to start
the program you want to debug.
target> gdbserver --multi comm
Usage (host side)
You need an unstripped copy of the target program on your host system, since
GDB needs to examine its symbol tables and such. Start up GDB as you normally
would, with the target program as the first argument. (You may need to use the
—baud option if the serial line is running at anything except 9600 baud.)
That is gdb TARGET-PROG, or gdb --baud BAUD TARGET-PROG. After that, the only
new command you need to know about is target remote
(or target extended-remote). Its argument is either
a device name (usually a serial device, like /dev/ttyb), or a HOST:PORT
descriptor. For example:
(gdb) target remote /dev/ttyb
communicates with the server via serial line /dev/ttyb, and:
(gdb) target remote the-target:2345
communicates via a TCP connection to port 2345 on host ‘the-target’, where
you previously started up gdbserver with the same port number. Note that for
TCP connections, you must start up gdbserver prior to using the ‘target remote’
command, otherwise you may get an error that looks something like
‘Connection refused’.
gdbserver can also debug multiple inferiors at once,
described in
Inferiors Connections and Programs.
In such case use the extended-remote GDB command variant:
(gdb) target extended-remote the-target:2345
The gdbserver option —multi may or may not be used in such
case.
There are three different modes for invoking gdbserver:
- Debug a specific program specified by its program name:
gdbserver comm prog [args…]
The comm parameter specifies how should the server communicate
with GDB; it is either a device name (to use a serial line),
a TCP port number (:1234), or-orstdioto use
stdin/stdout ofgdbserver. Specify the name of the program to
debug in prog. Any remaining arguments will be passed to the
program verbatim. When the program exits, GDB will close the
connection, andgdbserverwill exit. - Debug a specific program by specifying the process ID of a running
program:gdbserver --attach comm pid
The comm parameter is as described above. Supply the process ID
of a running program in pid; GDB will do everything
else. Like with the previous mode, when the process pid exits,
GDB will close the connection, andgdbserverwill exit. - Multi-process mode – debug more than one program/process:
In this mode, GDB can instruct
gdbserverwhich
command(s) to run. Unlike the other 2 modes, GDB will not
close the connection when a process being debugged exits, so you can
debug several processes in the same session.
In each of the modes you may specify these options:
--help-
List all options, with brief explanations.
--version-
This option causes
gdbserverto print its version number and exit. --attach-
gdbserverwill attach to a running program. The syntax is:target> gdbserver --attach comm pid
pid is the process ID of a currently running process. It isn’t
necessary to pointgdbserverat a binary for the running process. --multi-
To start
gdbserverwithout supplying an initial command to run
or process ID to attach, use this command line option.
Then you can connect using target extended-remote and start
the program you want to debug. The syntax is:target> gdbserver --multi comm
--debug-
Instruct
gdbserverto display extra status information about the debugging
process.
This option is intended forgdbserverdevelopment and for bug reports to
the developers. --remote-debug-
Instruct
gdbserverto display remote protocol debug output.
This option is intended forgdbserverdevelopment and for bug reports to
the developers. --debug-file=filename-
Instruct
gdbserverto send any debug output to the given filename.
This option is intended forgdbserverdevelopment and for bug reports to
the developers. --debug-format=option1[,option2,...]-
Instruct
gdbserverto include extra information in each line
of debugging output.
See Other Command-Line Arguments for gdbserver. --wrapper-
Specify a wrapper to launch programs
for debugging. The option should be followed by the name of the
wrapper, then any command-line arguments to pass to the wrapper, then
-- indicating the end of the wrapper arguments. --once-
By default,
gdbserverkeeps the listening TCP port open, so that
additional connections are possible. However, if you startgdbserver
with the —once option, it will stop listening for any further
connection attempts after connecting to the first GDB session.
gcore man
gcore
gcore [-a] [-o prefix] pid1 [pid2...pidN]
Generate core dumps of one or more running programs with process IDs
pid1, pid2, etc. A core file produced by gcore
is equivalent to one produced by the kernel when the process crashes
(and when ulimit -c was used to set up an appropriate core dump
limit). However, unlike after a crash, after gcore finishes
its job the program remains running without any change.
-a-
Dump all memory mappings. The actual effect of this option depends on
the Operating System. On GNU/Linux, it will disable
use-coredump-filter(see set use-coredump-filter) and
enabledump-excluded-mappings(see set dump-excluded-mappings). -o prefix-
The optional argument prefix specifies the prefix to be used
when composing the file names of the core dumps. The file name is
composed as prefix.pid, where pid is the
process ID of the running program being analyzed bygcore.
If not specified, prefix defaults to gcore.
gdbinit man
gdbinit
~/.config/gdb/gdbinit ~/.gdbinit ./.gdbinit
These files contain GDB commands to automatically execute during
GDB startup. The lines of contents are canned sequences of commands,
described in
Sequences.
Please read more in
Startup.
(not enabled with--with-system-gdbinitduring compilation)-
System-wide initialization file. It is executed unless user specified
GDB option-nxor-n.
See more in (not enabled with--with-system-gdbinit-dirduring compilation)-
System-wide initialization directory. All files in this directory are
executed on startup unless user specified GDB option-nxor
-n, as long as they have a recognized file extension.
See more in
System-wide configuration. ~/.config/gdb/gdbinit or ~/.gdbinit-
User initialization file. It is executed unless user specified
GDB options-nx,-nor-nh. .gdbinit-
Initialization file for current directory. It may need to be enabled with
GDB security commandset auto-load local-gdbinit.
See more in
Init File in the Current Directory.
gdb-add-index man
gdb-add-index
gdb-add-index filename
When GDB finds a symbol file, it scans the symbols in the
file in order to construct an internal symbol table. This lets most
GDB operations work quickly–at the cost of a delay early on.
For large programs, this delay can be quite lengthy, so GDB
provides a way to build an index, which speeds up startup.
To determine whether a file contains such an index, use the command
readelf -S filename: the index is stored in a section named
.gdb_index. The index file can only be produced on systems
which use ELF binaries and DWARF debug information (i.e., sections
named .debug_*).
gdb-add-index uses GDB and objdump found
in the PATH environment variable. If you want to use different
versions of these programs, you can specify them through the
GDB and OBJDUMP environment variables.
See more in
Index Files.
Appendix M GNU GENERAL PUBLIC LICENSE
Version 3, 29 June 2007
Copyright © 2007 Free Software Foundation, Inc. http://fsf.org/ Everyone is permitted to copy and distribute verbatim copies of this license document, but changing it is not allowed.
Preamble
The GNU General Public License is a free, copyleft license for
software and other kinds of works.
The licenses for most software and other practical works are designed
to take away your freedom to share and change the works. By contrast,
the GNU General Public License is intended to guarantee your freedom
to share and change all versions of a program—to make sure it remains
free software for all its users. We, the Free Software Foundation,
use the GNU General Public License for most of our software; it
applies also to any other work released this way by its authors. You
can apply it to your programs, too.
When we speak of free software, we are referring to freedom, not
price. Our General Public Licenses are designed to make sure that you
have the freedom to distribute copies of free software (and charge for
them if you wish), that you receive source code or can get it if you
want it, that you can change the software or use pieces of it in new
free programs, and that you know you can do these things.
To protect your rights, we need to prevent others from denying you
these rights or asking you to surrender the rights. Therefore, you
have certain responsibilities if you distribute copies of the
software, or if you modify it: responsibilities to respect the freedom
of others.
For example, if you distribute copies of such a program, whether
gratis or for a fee, you must pass on to the recipients the same
freedoms that you received. You must make sure that they, too,
receive or can get the source code. And you must show them these
terms so they know their rights.
Developers that use the GNU GPL protect your rights with two steps:
(1) assert copyright on the software, and (2) offer you this License
giving you legal permission to copy, distribute and/or modify it.
For the developers’ and authors’ protection, the GPL clearly explains
that there is no warranty for this free software. For both users’ and
authors’ sake, the GPL requires that modified versions be marked as
changed, so that their problems will not be attributed erroneously to
authors of previous versions.
Some devices are designed to deny users access to install or run
modified versions of the software inside them, although the
manufacturer can do so. This is fundamentally incompatible with the
aim of protecting users’ freedom to change the software. The
systematic pattern of such abuse occurs in the area of products for
individuals to use, which is precisely where it is most unacceptable.
Therefore, we have designed this version of the GPL to prohibit the
practice for those products. If such problems arise substantially in
other domains, we stand ready to extend this provision to those
domains in future versions of the GPL, as needed to protect the
freedom of users.
Finally, every program is threatened constantly by software patents.
States should not allow patents to restrict development and use of
software on general-purpose computers, but in those that do, we wish
to avoid the special danger that patents applied to a free program
could make it effectively proprietary. To prevent this, the GPL
assures that patents cannot be used to render the program non-free.
The precise terms and conditions for copying, distribution and
modification follow.
TERMS AND CONDITIONS
- Definitions.
“This License” refers to version 3 of the GNU General Public License.
“Copyright” also means copyright-like laws that apply to other kinds
of works, such as semiconductor masks.“The Program” refers to any copyrightable work licensed under this
License. Each licensee is addressed as “you”. “Licensees” and
“recipients” may be individuals or organizations.To “modify” a work means to copy from or adapt all or part of the work
in a fashion requiring copyright permission, other than the making of
an exact copy. The resulting work is called a “modified version” of
the earlier work or a work “based on” the earlier work.A “covered work” means either the unmodified Program or a work based
on the Program.To “propagate” a work means to do anything with it that, without
permission, would make you directly or secondarily liable for
infringement under applicable copyright law, except executing it on a
computer or modifying a private copy. Propagation includes copying,
distribution (with or without modification), making available to the
public, and in some countries other activities as well.To “convey” a work means any kind of propagation that enables other
parties to make or receive copies. Mere interaction with a user
through a computer network, with no transfer of a copy, is not
conveying.An interactive user interface displays “Appropriate Legal Notices” to
the extent that it includes a convenient and prominently visible
feature that (1) displays an appropriate copyright notice, and (2)
tells the user that there is no warranty for the work (except to the
extent that warranties are provided), that licensees may convey the
work under this License, and how to view a copy of this License. If
the interface presents a list of user commands or options, such as a
menu, a prominent item in the list meets this criterion. - Source Code.
The “source code” for a work means the preferred form of the work for
making modifications to it. “Object code” means any non-source form
of a work.A “Standard Interface” means an interface that either is an official
standard defined by a recognized standards body, or, in the case of
interfaces specified for a particular programming language, one that
is widely used among developers working in that language.The “System Libraries” of an executable work include anything, other
than the work as a whole, that (a) is included in the normal form of
packaging a Major Component, but which is not part of that Major
Component, and (b) serves only to enable use of the work with that
Major Component, or to implement a Standard Interface for which an
implementation is available to the public in source code form. A
“Major Component”, in this context, means a major essential component
(kernel, window system, and so on) of the specific operating system
(if any) on which the executable work runs, or a compiler used to
produce the work, or an object code interpreter used to run it.The “Corresponding Source” for a work in object code form means all
the source code needed to generate, install, and (for an executable
work) run the object code and to modify the work, including scripts to
control those activities. However, it does not include the work’s
System Libraries, or general-purpose tools or generally available free
programs which are used unmodified in performing those activities but
which are not part of the work. For example, Corresponding Source
includes interface definition files associated with source files for
the work, and the source code for shared libraries and dynamically
linked subprograms that the work is specifically designed to require,
such as by intimate data communication or control flow between those
subprograms and other parts of the work.The Corresponding Source need not include anything that users can
regenerate automatically from other parts of the Corresponding Source.The Corresponding Source for a work in source code form is that same
work. - Basic Permissions.
All rights granted under this License are granted for the term of
copyright on the Program, and are irrevocable provided the stated
conditions are met. This License explicitly affirms your unlimited
permission to run the unmodified Program. The output from running a
covered work is covered by this License only if the output, given its
content, constitutes a covered work. This License acknowledges your
rights of fair use or other equivalent, as provided by copyright law.You may make, run and propagate covered works that you do not convey,
without conditions so long as your license otherwise remains in force.
You may convey covered works to others for the sole purpose of having
them make modifications exclusively for you, or provide you with
facilities for running those works, provided that you comply with the
terms of this License in conveying all material for which you do not
control copyright. Those thus making or running the covered works for
you must do so exclusively on your behalf, under your direction and
control, on terms that prohibit them from making any copies of your
copyrighted material outside their relationship with you.Conveying under any other circumstances is permitted solely under the
conditions stated below. Sublicensing is not allowed; section 10
makes it unnecessary. - Protecting Users’ Legal Rights From Anti-Circumvention Law.
No covered work shall be deemed part of an effective technological
measure under any applicable law fulfilling obligations under article
11 of the WIPO copyright treaty adopted on 20 December 1996, or
similar laws prohibiting or restricting circumvention of such
measures.When you convey a covered work, you waive any legal power to forbid
circumvention of technological measures to the extent such
circumvention is effected by exercising rights under this License with
respect to the covered work, and you disclaim any intention to limit
operation or modification of the work as a means of enforcing, against
the work’s users, your or third parties’ legal rights to forbid
circumvention of technological measures. - Conveying Verbatim Copies.
You may convey verbatim copies of the Program’s source code as you
receive it, in any medium, provided that you conspicuously and
appropriately publish on each copy an appropriate copyright notice;
keep intact all notices stating that this License and any
non-permissive terms added in accord with section 7 apply to the code;
keep intact all notices of the absence of any warranty; and give all
recipients a copy of this License along with the Program.You may charge any price or no price for each copy that you convey,
and you may offer support or warranty protection for a fee. - Conveying Modified Source Versions.
You may convey a work based on the Program, or the modifications to
produce it from the Program, in the form of source code under the
terms of section 4, provided that you also meet all of these
conditions:- The work must carry prominent notices stating that you modified it,
and giving a relevant date. - The work must carry prominent notices stating that it is released
under this License and any conditions added under section 7. This
requirement modifies the requirement in section 4 to “keep intact all
notices”. - You must license the entire work, as a whole, under this License to
anyone who comes into possession of a copy. This License will
therefore apply, along with any applicable section 7 additional terms,
to the whole of the work, and all its parts, regardless of how they
are packaged. This License gives no permission to license the work in
any other way, but it does not invalidate such permission if you have
separately received it. - If the work has interactive user interfaces, each must display
Appropriate Legal Notices; however, if the Program has interactive
interfaces that do not display Appropriate Legal Notices, your work
need not make them do so.
A compilation of a covered work with other separate and independent
works, which are not by their nature extensions of the covered work,
and which are not combined with it such as to form a larger program,
in or on a volume of a storage or distribution medium, is called an
“aggregate” if the compilation and its resulting copyright are not
used to limit the access or legal rights of the compilation’s users
beyond what the individual works permit. Inclusion of a covered work
in an aggregate does not cause this License to apply to the other
parts of the aggregate. - The work must carry prominent notices stating that you modified it,
- Conveying Non-Source Forms.
You may convey a covered work in object code form under the terms of
sections 4 and 5, provided that you also convey the machine-readable
Corresponding Source under the terms of this License, in one of these
ways:- Convey the object code in, or embodied in, a physical product
(including a physical distribution medium), accompanied by the
Corresponding Source fixed on a durable physical medium customarily
used for software interchange. - Convey the object code in, or embodied in, a physical product
(including a physical distribution medium), accompanied by a written
offer, valid for at least three years and valid for as long as you
offer spare parts or customer support for that product model, to give
anyone who possesses the object code either (1) a copy of the
Corresponding Source for all the software in the product that is
covered by this License, on a durable physical medium customarily used
for software interchange, for a price no more than your reasonable
cost of physically performing this conveying of source, or (2) access
to copy the Corresponding Source from a network server at no charge. - Convey individual copies of the object code with a copy of the written
offer to provide the Corresponding Source. This alternative is
allowed only occasionally and noncommercially, and only if you
received the object code with such an offer, in accord with subsection
6b. - Convey the object code by offering access from a designated place
(gratis or for a charge), and offer equivalent access to the
Corresponding Source in the same way through the same place at no
further charge. You need not require recipients to copy the
Corresponding Source along with the object code. If the place to copy
the object code is a network server, the Corresponding Source may be
on a different server (operated by you or a third party) that supports
equivalent copying facilities, provided you maintain clear directions
next to the object code saying where to find the Corresponding Source.
Regardless of what server hosts the Corresponding Source, you remain
obligated to ensure that it is available for as long as needed to
satisfy these requirements. - Convey the object code using peer-to-peer transmission, provided you
inform other peers where the object code and Corresponding Source of
the work are being offered to the general public at no charge under
subsection 6d.
A separable portion of the object code, whose source code is excluded
from the Corresponding Source as a System Library, need not be
included in conveying the object code work.A “User Product” is either (1) a “consumer product”, which means any
tangible personal property which is normally used for personal,
family, or household purposes, or (2) anything designed or sold for
incorporation into a dwelling. In determining whether a product is a
consumer product, doubtful cases shall be resolved in favor of
coverage. For a particular product received by a particular user,
“normally used” refers to a typical or common use of that class of
product, regardless of the status of the particular user or of the way
in which the particular user actually uses, or expects or is expected
to use, the product. A product is a consumer product regardless of
whether the product has substantial commercial, industrial or
non-consumer uses, unless such uses represent the only significant
mode of use of the product.“Installation Information” for a User Product means any methods,
procedures, authorization keys, or other information required to
install and execute modified versions of a covered work in that User
Product from a modified version of its Corresponding Source. The
information must suffice to ensure that the continued functioning of
the modified object code is in no case prevented or interfered with
solely because modification has been made.If you convey an object code work under this section in, or with, or
specifically for use in, a User Product, and the conveying occurs as
part of a transaction in which the right of possession and use of the
User Product is transferred to the recipient in perpetuity or for a
fixed term (regardless of how the transaction is characterized), the
Corresponding Source conveyed under this section must be accompanied
by the Installation Information. But this requirement does not apply
if neither you nor any third party retains the ability to install
modified object code on the User Product (for example, the work has
been installed in ROM).The requirement to provide Installation Information does not include a
requirement to continue to provide support service, warranty, or
updates for a work that has been modified or installed by the
recipient, or for the User Product in which it has been modified or
installed. Access to a network may be denied when the modification
itself materially and adversely affects the operation of the network
or violates the rules and protocols for communication across the
network.Corresponding Source conveyed, and Installation Information provided,
in accord with this section must be in a format that is publicly
documented (and with an implementation available to the public in
source code form), and must require no special password or key for
unpacking, reading or copying. - Convey the object code in, or embodied in, a physical product
- Additional Terms.
“Additional permissions” are terms that supplement the terms of this
License by making exceptions from one or more of its conditions.
Additional permissions that are applicable to the entire Program shall
be treated as though they were included in this License, to the extent
that they are valid under applicable law. If additional permissions
apply only to part of the Program, that part may be used separately
under those permissions, but the entire Program remains governed by
this License without regard to the additional permissions.When you convey a copy of a covered work, you may at your option
remove any additional permissions from that copy, or from any part of
it. (Additional permissions may be written to require their own
removal in certain cases when you modify the work.) You may place
additional permissions on material, added by you to a covered work,
for which you have or can give appropriate copyright permission.Notwithstanding any other provision of this License, for material you
add to a covered work, you may (if authorized by the copyright holders
of that material) supplement the terms of this License with terms:- Disclaiming warranty or limiting liability differently from the terms
of sections 15 and 16 of this License; or - Requiring preservation of specified reasonable legal notices or author
attributions in that material or in the Appropriate Legal Notices
displayed by works containing it; or - Prohibiting misrepresentation of the origin of that material, or
requiring that modified versions of such material be marked in
reasonable ways as different from the original version; or - Limiting the use for publicity purposes of names of licensors or
authors of the material; or - Declining to grant rights under trademark law for use of some trade
names, trademarks, or service marks; or - Requiring indemnification of licensors and authors of that material by
anyone who conveys the material (or modified versions of it) with
contractual assumptions of liability to the recipient, for any
liability that these contractual assumptions directly impose on those
licensors and authors.
All other non-permissive additional terms are considered “further
restrictions” within the meaning of section 10. If the Program as you
received it, or any part of it, contains a notice stating that it is
governed by this License along with a term that is a further
restriction, you may remove that term. If a license document contains
a further restriction but permits relicensing or conveying under this
License, you may add to a covered work material governed by the terms
of that license document, provided that the further restriction does
not survive such relicensing or conveying.If you add terms to a covered work in accord with this section, you
must place, in the relevant source files, a statement of the
additional terms that apply to those files, or a notice indicating
where to find the applicable terms.Additional terms, permissive or non-permissive, may be stated in the
form of a separately written license, or stated as exceptions; the
above requirements apply either way. - Disclaiming warranty or limiting liability differently from the terms
- Termination.
You may not propagate or modify a covered work except as expressly
provided under this License. Any attempt otherwise to propagate or
modify it is void, and will automatically terminate your rights under
this License (including any patent licenses granted under the third
paragraph of section 11).However, if you cease all violation of this License, then your license
from a particular copyright holder is reinstated (a) provisionally,
unless and until the copyright holder explicitly and finally
terminates your license, and (b) permanently, if the copyright holder
fails to notify you of the violation by some reasonable means prior to
60 days after the cessation.Moreover, your license from a particular copyright holder is
reinstated permanently if the copyright holder notifies you of the
violation by some reasonable means, this is the first time you have
received notice of violation of this License (for any work) from that
copyright holder, and you cure the violation prior to 30 days after
your receipt of the notice.Termination of your rights under this section does not terminate the
licenses of parties who have received copies or rights from you under
this License. If your rights have been terminated and not permanently
reinstated, you do not qualify to receive new licenses for the same
material under section 10. - Acceptance Not Required for Having Copies.
You are not required to accept this License in order to receive or run
a copy of the Program. Ancillary propagation of a covered work
occurring solely as a consequence of using peer-to-peer transmission
to receive a copy likewise does not require acceptance. However,
nothing other than this License grants you permission to propagate or
modify any covered work. These actions infringe copyright if you do
not accept this License. Therefore, by modifying or propagating a
covered work, you indicate your acceptance of this License to do so. - Automatic Licensing of Downstream Recipients.
Each time you convey a covered work, the recipient automatically
receives a license from the original licensors, to run, modify and
propagate that work, subject to this License. You are not responsible
for enforcing compliance by third parties with this License.An “entity transaction” is a transaction transferring control of an
organization, or substantially all assets of one, or subdividing an
organization, or merging organizations. If propagation of a covered
work results from an entity transaction, each party to that
transaction who receives a copy of the work also receives whatever
licenses to the work the party’s predecessor in interest had or could
give under the previous paragraph, plus a right to possession of the
Corresponding Source of the work from the predecessor in interest, if
the predecessor has it or can get it with reasonable efforts.You may not impose any further restrictions on the exercise of the
rights granted or affirmed under this License. For example, you may
not impose a license fee, royalty, or other charge for exercise of
rights granted under this License, and you may not initiate litigation
(including a cross-claim or counterclaim in a lawsuit) alleging that
any patent claim is infringed by making, using, selling, offering for
sale, or importing the Program or any portion of it. - Patents.
A “contributor” is a copyright holder who authorizes use under this
License of the Program or a work on which the Program is based. The
work thus licensed is called the contributor’s “contributor version”.A contributor’s “essential patent claims” are all patent claims owned
or controlled by the contributor, whether already acquired or
hereafter acquired, that would be infringed by some manner, permitted
by this License, of making, using, or selling its contributor version,
but do not include claims that would be infringed only as a
consequence of further modification of the contributor version. For
purposes of this definition, “control” includes the right to grant
patent sublicenses in a manner consistent with the requirements of
this License.Each contributor grants you a non-exclusive, worldwide, royalty-free
patent license under the contributor’s essential patent claims, to
make, use, sell, offer for sale, import and otherwise run, modify and
propagate the contents of its contributor version.In the following three paragraphs, a “patent license” is any express
agreement or commitment, however denominated, not to enforce a patent
(such as an express permission to practice a patent or covenant not to
sue for patent infringement). To “grant” such a patent license to a
party means to make such an agreement or commitment not to enforce a
patent against the party.If you convey a covered work, knowingly relying on a patent license,
and the Corresponding Source of the work is not available for anyone
to copy, free of charge and under the terms of this License, through a
publicly available network server or other readily accessible means,
then you must either (1) cause the Corresponding Source to be so
available, or (2) arrange to deprive yourself of the benefit of the
patent license for this particular work, or (3) arrange, in a manner
consistent with the requirements of this License, to extend the patent
license to downstream recipients. “Knowingly relying” means you have
actual knowledge that, but for the patent license, your conveying the
covered work in a country, or your recipient’s use of the covered work
in a country, would infringe one or more identifiable patents in that
country that you have reason to believe are valid.If, pursuant to or in connection with a single transaction or
arrangement, you convey, or propagate by procuring conveyance of, a
covered work, and grant a patent license to some of the parties
receiving the covered work authorizing them to use, propagate, modify
or convey a specific copy of the covered work, then the patent license
you grant is automatically extended to all recipients of the covered
work and works based on it.A patent license is “discriminatory” if it does not include within the
scope of its coverage, prohibits the exercise of, or is conditioned on
the non-exercise of one or more of the rights that are specifically
granted under this License. You may not convey a covered work if you
are a party to an arrangement with a third party that is in the
business of distributing software, under which you make payment to the
third party based on the extent of your activity of conveying the
work, and under which the third party grants, to any of the parties
who would receive the covered work from you, a discriminatory patent
license (a) in connection with copies of the covered work conveyed by
you (or copies made from those copies), or (b) primarily for and in
connection with specific products or compilations that contain the
covered work, unless you entered into that arrangement, or that patent
license was granted, prior to 28 March 2007.Nothing in this License shall be construed as excluding or limiting
any implied license or other defenses to infringement that may
otherwise be available to you under applicable patent law. - No Surrender of Others’ Freedom.
If conditions are imposed on you (whether by court order, agreement or
otherwise) that contradict the conditions of this License, they do not
excuse you from the conditions of this License. If you cannot convey
a covered work so as to satisfy simultaneously your obligations under
this License and any other pertinent obligations, then as a
consequence you may not convey it at all. For example, if you agree
to terms that obligate you to collect a royalty for further conveying
from those to whom you convey the Program, the only way you could
satisfy both those terms and this License would be to refrain entirely
from conveying the Program. - Use with the GNU Affero General Public License.
Notwithstanding any other provision of this License, you have
permission to link or combine any covered work with a work licensed
under version 3 of the GNU Affero General Public License into a single
combined work, and to convey the resulting work. The terms of this
License will continue to apply to the part which is the covered work,
but the special requirements of the GNU Affero General Public License,
section 13, concerning interaction through a network will apply to the
combination as such. - Revised Versions of this License.
The Free Software Foundation may publish revised and/or new versions
of the GNU General Public License from time to time. Such new
versions will be similar in spirit to the present version, but may
differ in detail to address new problems or concerns.Each version is given a distinguishing version number. If the Program
specifies that a certain numbered version of the GNU General Public
License “or any later version” applies to it, you have the option of
following the terms and conditions either of that numbered version or
of any later version published by the Free Software Foundation. If
the Program does not specify a version number of the GNU General
Public License, you may choose any version ever published by the Free
Software Foundation.If the Program specifies that a proxy can decide which future versions
of the GNU General Public License can be used, that proxy’s public
statement of acceptance of a version permanently authorizes you to
choose that version for the Program.Later license versions may give you additional or different
permissions. However, no additional obligations are imposed on any
author or copyright holder as a result of your choosing to follow a
later version. - Disclaimer of Warranty.
THERE IS NO WARRANTY FOR THE PROGRAM, TO THE EXTENT PERMITTED BY
APPLICABLE LAW. EXCEPT WHEN OTHERWISE STATED IN WRITING THE COPYRIGHT
HOLDERS AND/OR OTHER PARTIES PROVIDE THE PROGRAM “AS IS” WITHOUT
WARRANTY OF ANY KIND, EITHER EXPRESSED OR IMPLIED, INCLUDING, BUT NOT
LIMITED TO, THE IMPLIED WARRANTIES OF MERCHANTABILITY AND FITNESS FOR
A PARTICULAR PURPOSE. THE ENTIRE RISK AS TO THE QUALITY AND
PERFORMANCE OF THE PROGRAM IS WITH YOU. SHOULD THE PROGRAM PROVE
DEFECTIVE, YOU ASSUME THE COST OF ALL NECESSARY SERVICING, REPAIR OR
CORRECTION. - Limitation of Liability.
IN NO EVENT UNLESS REQUIRED BY APPLICABLE LAW OR AGREED TO IN WRITING
WILL ANY COPYRIGHT HOLDER, OR ANY OTHER PARTY WHO MODIFIES AND/OR
CONVEYS THE PROGRAM AS PERMITTED ABOVE, BE LIABLE TO YOU FOR DAMAGES,
INCLUDING ANY GENERAL, SPECIAL, INCIDENTAL OR CONSEQUENTIAL DAMAGES
ARISING OUT OF THE USE OR INABILITY TO USE THE PROGRAM (INCLUDING BUT
NOT LIMITED TO LOSS OF DATA OR DATA BEING RENDERED INACCURATE OR
LOSSES SUSTAINED BY YOU OR THIRD PARTIES OR A FAILURE OF THE PROGRAM
TO OPERATE WITH ANY OTHER PROGRAMS), EVEN IF SUCH HOLDER OR OTHER
PARTY HAS BEEN ADVISED OF THE POSSIBILITY OF SUCH DAMAGES. - Interpretation of Sections 15 and 16.
If the disclaimer of warranty and limitation of liability provided
above cannot be given local legal effect according to their terms,
reviewing courts shall apply local law that most closely approximates
an absolute waiver of all civil liability in connection with the
Program, unless a warranty or assumption of liability accompanies a
copy of the Program in return for a fee.
END OF TERMS AND CONDITIONS
How to Apply These Terms to Your New Programs
If you develop a new program, and you want it to be of the greatest
possible use to the public, the best way to achieve this is to make it
free software which everyone can redistribute and change under these
terms.
To do so, attach the following notices to the program. It is safest
to attach them to the start of each source file to most effectively
state the exclusion of warranty; and each file should have at least
the “copyright” line and a pointer to where the full notice is found.
one line to give the program's name and a brief idea of what it does. Copyright (C) year name of author This program is free software: you can redistribute it and/or modify it under the terms of the GNU General Public License as published by the Free Software Foundation, either version 3 of the License, or (at your option) any later version. This program is distributed in the hope that it will be useful, but WITHOUT ANY WARRANTY; without even the implied warranty of MERCHANTABILITY or FITNESS FOR A PARTICULAR PURPOSE. See the GNU General Public License for more details. You should have received a copy of the GNU General Public License along with this program. If not, see http://www.gnu.org/licenses/.
Also add information on how to contact you by electronic and paper mail.
If the program does terminal interaction, make it output a short
notice like this when it starts in an interactive mode:
program Copyright (C) year name of author This program comes with ABSOLUTELY NO WARRANTY; for details type ‘show w’. This is free software, and you are welcome to redistribute it under certain conditions; type ‘show c’ for details.
The hypothetical commands ‘show w’ and ‘show c’ should show
the appropriate parts of the General Public License. Of course, your
program’s commands might be different; for a GUI interface, you would
use an “about box”.
You should also get your employer (if you work as a programmer) or school,
if any, to sign a “copyright disclaimer” for the program, if necessary.
For more information on this, and how to apply and follow the GNU GPL, see
http://www.gnu.org/licenses/.
The GNU General Public License does not permit incorporating your
program into proprietary programs. If your program is a subroutine
library, you may consider it more useful to permit linking proprietary
applications with the library. If this is what you want to do, use
the GNU Lesser General Public License instead of this License. But
first, please read http://www.gnu.org/philosophy/why-not-lgpl.html.
Appendix N GNU Free Documentation License
Version 1.3, 3 November 2008
Copyright © 2000, 2001, 2002, 2007, 2008 Free Software Foundation, Inc. http://fsf.org/ Everyone is permitted to copy and distribute verbatim copies of this license document, but changing it is not allowed.
- PREAMBLE
The purpose of this License is to make a manual, textbook, or other
functional and useful document free in the sense of freedom: to
assure everyone the effective freedom to copy and redistribute it,
with or without modifying it, either commercially or noncommercially.
Secondarily, this License preserves for the author and publisher a way
to get credit for their work, while not being considered responsible
for modifications made by others.This License is a kind of “copyleft”, which means that derivative
works of the document must themselves be free in the same sense. It
complements the GNU General Public License, which is a copyleft
license designed for free software.We have designed this License in order to use it for manuals for free
software, because free software needs free documentation: a free
program should come with manuals providing the same freedoms that the
software does. But this License is not limited to software manuals;
it can be used for any textual work, regardless of subject matter or
whether it is published as a printed book. We recommend this License
principally for works whose purpose is instruction or reference. - APPLICABILITY AND DEFINITIONS
This License applies to any manual or other work, in any medium, that
contains a notice placed by the copyright holder saying it can be
distributed under the terms of this License. Such a notice grants a
world-wide, royalty-free license, unlimited in duration, to use that
work under the conditions stated herein. The “Document”, below,
refers to any such manual or work. Any member of the public is a
licensee, and is addressed as “you”. You accept the license if you
copy, modify or distribute the work in a way requiring permission
under copyright law.A “Modified Version” of the Document means any work containing the
Document or a portion of it, either copied verbatim, or with
modifications and/or translated into another language.A “Secondary Section” is a named appendix or a front-matter section
of the Document that deals exclusively with the relationship of the
publishers or authors of the Document to the Document’s overall
subject (or to related matters) and contains nothing that could fall
directly within that overall subject. (Thus, if the Document is in
part a textbook of mathematics, a Secondary Section may not explain
any mathematics.) The relationship could be a matter of historical
connection with the subject or with related matters, or of legal,
commercial, philosophical, ethical or political position regarding
them.The “Invariant Sections” are certain Secondary Sections whose titles
are designated, as being those of Invariant Sections, in the notice
that says that the Document is released under this License. If a
section does not fit the above definition of Secondary then it is not
allowed to be designated as Invariant. The Document may contain zero
Invariant Sections. If the Document does not identify any Invariant
Sections then there are none.The “Cover Texts” are certain short passages of text that are listed,
as Front-Cover Texts or Back-Cover Texts, in the notice that says that
the Document is released under this License. A Front-Cover Text may
be at most 5 words, and a Back-Cover Text may be at most 25 words.A “Transparent” copy of the Document means a machine-readable copy,
represented in a format whose specification is available to the
general public, that is suitable for revising the document
straightforwardly with generic text editors or (for images composed of
pixels) generic paint programs or (for drawings) some widely available
drawing editor, and that is suitable for input to text formatters or
for automatic translation to a variety of formats suitable for input
to text formatters. A copy made in an otherwise Transparent file
format whose markup, or absence of markup, has been arranged to thwart
or discourage subsequent modification by readers is not Transparent.
An image format is not Transparent if used for any substantial amount
of text. A copy that is not “Transparent” is called “Opaque”.Examples of suitable formats for Transparent copies include plain
ASCII without markup, Texinfo input format, LaTeX input
format, SGML or XML using a publicly available
DTD, and standard-conforming simple HTML,
PostScript or PDF designed for human modification. Examples
of transparent image formats include PNG, XCF and
JPG. Opaque formats include proprietary formats that can be
read and edited only by proprietary word processors, SGML or
XML for which the DTD and/or processing tools are
not generally available, and the machine-generated HTML,
PostScript or PDF produced by some word processors for
output purposes only.The “Title Page” means, for a printed book, the title page itself,
plus such following pages as are needed to hold, legibly, the material
this License requires to appear in the title page. For works in
formats which do not have any title page as such, “Title Page” means
the text near the most prominent appearance of the work’s title,
preceding the beginning of the body of the text.The “publisher” means any person or entity that distributes copies
of the Document to the public.A section “Entitled XYZ” means a named subunit of the Document whose
title either is precisely XYZ or contains XYZ in parentheses following
text that translates XYZ in another language. (Here XYZ stands for a
specific section name mentioned below, such as “Acknowledgements”,
“Dedications”, “Endorsements”, or “History”.) To “Preserve the Title”
of such a section when you modify the Document means that it remains a
section “Entitled XYZ” according to this definition.The Document may include Warranty Disclaimers next to the notice which
states that this License applies to the Document. These Warranty
Disclaimers are considered to be included by reference in this
License, but only as regards disclaiming warranties: any other
implication that these Warranty Disclaimers may have is void and has
no effect on the meaning of this License. - VERBATIM COPYING
You may copy and distribute the Document in any medium, either
commercially or noncommercially, provided that this License, the
copyright notices, and the license notice saying this License applies
to the Document are reproduced in all copies, and that you add no other
conditions whatsoever to those of this License. You may not use
technical measures to obstruct or control the reading or further
copying of the copies you make or distribute. However, you may accept
compensation in exchange for copies. If you distribute a large enough
number of copies you must also follow the conditions in section 3.You may also lend copies, under the same conditions stated above, and
you may publicly display copies. - COPYING IN QUANTITY
If you publish printed copies (or copies in media that commonly have
printed covers) of the Document, numbering more than 100, and the
Document’s license notice requires Cover Texts, you must enclose the
copies in covers that carry, clearly and legibly, all these Cover
Texts: Front-Cover Texts on the front cover, and Back-Cover Texts on
the back cover. Both covers must also clearly and legibly identify
you as the publisher of these copies. The front cover must present
the full title with all words of the title equally prominent and
visible. You may add other material on the covers in addition.
Copying with changes limited to the covers, as long as they preserve
the title of the Document and satisfy these conditions, can be treated
as verbatim copying in other respects.If the required texts for either cover are too voluminous to fit
legibly, you should put the first ones listed (as many as fit
reasonably) on the actual cover, and continue the rest onto adjacent
pages.If you publish or distribute Opaque copies of the Document numbering
more than 100, you must either include a machine-readable Transparent
copy along with each Opaque copy, or state in or with each Opaque copy
a computer-network location from which the general network-using
public has access to download using public-standard network protocols
a complete Transparent copy of the Document, free of added material.
If you use the latter option, you must take reasonably prudent steps,
when you begin distribution of Opaque copies in quantity, to ensure
that this Transparent copy will remain thus accessible at the stated
location until at least one year after the last time you distribute an
Opaque copy (directly or through your agents or retailers) of that
edition to the public.It is requested, but not required, that you contact the authors of the
Document well before redistributing any large number of copies, to give
them a chance to provide you with an updated version of the Document. - MODIFICATIONS
You may copy and distribute a Modified Version of the Document under
the conditions of sections 2 and 3 above, provided that you release
the Modified Version under precisely this License, with the Modified
Version filling the role of the Document, thus licensing distribution
and modification of the Modified Version to whoever possesses a copy
of it. In addition, you must do these things in the Modified Version:- Use in the Title Page (and on the covers, if any) a title distinct
from that of the Document, and from those of previous versions
(which should, if there were any, be listed in the History section
of the Document). You may use the same title as a previous version
if the original publisher of that version gives permission. - List on the Title Page, as authors, one or more persons or entities
responsible for authorship of the modifications in the Modified
Version, together with at least five of the principal authors of the
Document (all of its principal authors, if it has fewer than five),
unless they release you from this requirement. - State on the Title page the name of the publisher of the
Modified Version, as the publisher. - Preserve all the copyright notices of the Document.
- Add an appropriate copyright notice for your modifications
adjacent to the other copyright notices. - Include, immediately after the copyright notices, a license notice
giving the public permission to use the Modified Version under the
terms of this License, in the form shown in the Addendum below. - Preserve in that license notice the full lists of Invariant Sections
and required Cover Texts given in the Document’s license notice. - Include an unaltered copy of this License.
- Preserve the section Entitled “History”, Preserve its Title, and add
to it an item stating at least the title, year, new authors, and
publisher of the Modified Version as given on the Title Page. If
there is no section Entitled “History” in the Document, create one
stating the title, year, authors, and publisher of the Document as
given on its Title Page, then add an item describing the Modified
Version as stated in the previous sentence. - Preserve the network location, if any, given in the Document for
public access to a Transparent copy of the Document, and likewise
the network locations given in the Document for previous versions
it was based on. These may be placed in the “History” section.
You may omit a network location for a work that was published at
least four years before the Document itself, or if the original
publisher of the version it refers to gives permission. - For any section Entitled “Acknowledgements” or “Dedications”, Preserve
the Title of the section, and preserve in the section all the
substance and tone of each of the contributor acknowledgements and/or
dedications given therein. - Preserve all the Invariant Sections of the Document,
unaltered in their text and in their titles. Section numbers
or the equivalent are not considered part of the section titles. - Delete any section Entitled “Endorsements”. Such a section
may not be included in the Modified Version. - Do not retitle any existing section to be Entitled “Endorsements” or
to conflict in title with any Invariant Section. - Preserve any Warranty Disclaimers.
If the Modified Version includes new front-matter sections or
appendices that qualify as Secondary Sections and contain no material
copied from the Document, you may at your option designate some or all
of these sections as invariant. To do this, add their titles to the
list of Invariant Sections in the Modified Version’s license notice.
These titles must be distinct from any other section titles.You may add a section Entitled “Endorsements”, provided it contains
nothing but endorsements of your Modified Version by various
parties—for example, statements of peer review or that the text has
been approved by an organization as the authoritative definition of a
standard.You may add a passage of up to five words as a Front-Cover Text, and a
passage of up to 25 words as a Back-Cover Text, to the end of the list
of Cover Texts in the Modified Version. Only one passage of
Front-Cover Text and one of Back-Cover Text may be added by (or
through arrangements made by) any one entity. If the Document already
includes a cover text for the same cover, previously added by you or
by arrangement made by the same entity you are acting on behalf of,
you may not add another; but you may replace the old one, on explicit
permission from the previous publisher that added the old one.The author(s) and publisher(s) of the Document do not by this License
give permission to use their names for publicity for or to assert or
imply endorsement of any Modified Version. - Use in the Title Page (and on the covers, if any) a title distinct
- COMBINING DOCUMENTS
You may combine the Document with other documents released under this
License, under the terms defined in section 4 above for modified
versions, provided that you include in the combination all of the
Invariant Sections of all of the original documents, unmodified, and
list them all as Invariant Sections of your combined work in its
license notice, and that you preserve all their Warranty Disclaimers.The combined work need only contain one copy of this License, and
multiple identical Invariant Sections may be replaced with a single
copy. If there are multiple Invariant Sections with the same name but
different contents, make the title of each such section unique by
adding at the end of it, in parentheses, the name of the original
author or publisher of that section if known, or else a unique number.
Make the same adjustment to the section titles in the list of
Invariant Sections in the license notice of the combined work.In the combination, you must combine any sections Entitled “History”
in the various original documents, forming one section Entitled
“History”; likewise combine any sections Entitled “Acknowledgements”,
and any sections Entitled “Dedications”. You must delete all
sections Entitled “Endorsements.” - COLLECTIONS OF DOCUMENTS
You may make a collection consisting of the Document and other documents
released under this License, and replace the individual copies of this
License in the various documents with a single copy that is included in
the collection, provided that you follow the rules of this License for
verbatim copying of each of the documents in all other respects.You may extract a single document from such a collection, and distribute
it individually under this License, provided you insert a copy of this
License into the extracted document, and follow this License in all
other respects regarding verbatim copying of that document. - AGGREGATION WITH INDEPENDENT WORKS
A compilation of the Document or its derivatives with other separate
and independent documents or works, in or on a volume of a storage or
distribution medium, is called an “aggregate” if the copyright
resulting from the compilation is not used to limit the legal rights
of the compilation’s users beyond what the individual works permit.
When the Document is included in an aggregate, this License does not
apply to the other works in the aggregate which are not themselves
derivative works of the Document.If the Cover Text requirement of section 3 is applicable to these
copies of the Document, then if the Document is less than one half of
the entire aggregate, the Document’s Cover Texts may be placed on
covers that bracket the Document within the aggregate, or the
electronic equivalent of covers if the Document is in electronic form.
Otherwise they must appear on printed covers that bracket the whole
aggregate. - TRANSLATION
Translation is considered a kind of modification, so you may
distribute translations of the Document under the terms of section 4.
Replacing Invariant Sections with translations requires special
permission from their copyright holders, but you may include
translations of some or all Invariant Sections in addition to the
original versions of these Invariant Sections. You may include a
translation of this License, and all the license notices in the
Document, and any Warranty Disclaimers, provided that you also include
the original English version of this License and the original versions
of those notices and disclaimers. In case of a disagreement between
the translation and the original version of this License or a notice
or disclaimer, the original version will prevail.If a section in the Document is Entitled “Acknowledgements”,
“Dedications”, or “History”, the requirement (section 4) to Preserve
its Title (section 1) will typically require changing the actual
title. - TERMINATION
You may not copy, modify, sublicense, or distribute the Document
except as expressly provided under this License. Any attempt
otherwise to copy, modify, sublicense, or distribute it is void, and
will automatically terminate your rights under this License.However, if you cease all violation of this License, then your license
from a particular copyright holder is reinstated (a) provisionally,
unless and until the copyright holder explicitly and finally
terminates your license, and (b) permanently, if the copyright holder
fails to notify you of the violation by some reasonable means prior to
60 days after the cessation.Moreover, your license from a particular copyright holder is
reinstated permanently if the copyright holder notifies you of the
violation by some reasonable means, this is the first time you have
received notice of violation of this License (for any work) from that
copyright holder, and you cure the violation prior to 30 days after
your receipt of the notice.Termination of your rights under this section does not terminate the
licenses of parties who have received copies or rights from you under
this License. If your rights have been terminated and not permanently
reinstated, receipt of a copy of some or all of the same material does
not give you any rights to use it. - FUTURE REVISIONS OF THIS LICENSE
The Free Software Foundation may publish new, revised versions
of the GNU Free Documentation License from time to time. Such new
versions will be similar in spirit to the present version, but may
differ in detail to address new problems or concerns. See
http://www.gnu.org/copyleft/.Each version of the License is given a distinguishing version number.
If the Document specifies that a particular numbered version of this
License “or any later version” applies to it, you have the option of
following the terms and conditions either of that specified version or
of any later version that has been published (not as a draft) by the
Free Software Foundation. If the Document does not specify a version
number of this License, you may choose any version ever published (not
as a draft) by the Free Software Foundation. If the Document
specifies that a proxy can decide which future versions of this
License can be used, that proxy’s public statement of acceptance of a
version permanently authorizes you to choose that version for the
Document. - RELICENSING
“Massive Multiauthor Collaboration Site” (or “MMC Site”) means any
World Wide Web server that publishes copyrightable works and also
provides prominent facilities for anybody to edit those works. A
public wiki that anybody can edit is an example of such a server. A
“Massive Multiauthor Collaboration” (or “MMC”) contained in the
site means any set of copyrightable works thus published on the MMC
site.“CC-BY-SA” means the Creative Commons Attribution-Share Alike 3.0
license published by Creative Commons Corporation, a not-for-profit
corporation with a principal place of business in San Francisco,
California, as well as future copyleft versions of that license
published by that same organization.“Incorporate” means to publish or republish a Document, in whole or
in part, as part of another Document.An MMC is “eligible for relicensing” if it is licensed under this
License, and if all works that were first published under this License
somewhere other than this MMC, and subsequently incorporated in whole
or in part into the MMC, (1) had no cover texts or invariant sections,
and (2) were thus incorporated prior to November 1, 2008.The operator of an MMC Site may republish an MMC contained in the site
under CC-BY-SA on the same site at any time before August 1, 2009,
provided the MMC is eligible for relicensing.
ADDENDUM: How to use this License for your documents
To use this License in a document you have written, include a copy of
the License in the document and put the following copyright and
license notices just after the title page:
Copyright (C) year your name. Permission is granted to copy, distribute and/or modify this document under the terms of the GNU Free Documentation License, Version 1.3 or any later version published by the Free Software Foundation; with no Invariant Sections, no Front-Cover Texts, and no Back-Cover Texts. A copy of the license is included in the section entitled ``GNU Free Documentation License''.
If you have Invariant Sections, Front-Cover Texts and Back-Cover Texts,
replace the “with…Texts.” line with this:
with the Invariant Sections being list their titles, with
the Front-Cover Texts being list, and with the Back-Cover Texts
being list.
If you have Invariant Sections without Cover Texts, or some other
combination of the three, merge those two alternatives to suit the
situation.
If your document contains nontrivial examples of program code, we
recommend releasing these examples in parallel under your choice of
free software license, such as the GNU General Public License,
to permit their use in free software.
Concept Index
| Jump to: | ! « # $ & — . / : < ? _ { A B C D E F G H I J K L M N O P Q R S T U V W X Y Z |
|---|
| Index Entry | Section | ||
|---|---|---|---|
|
|
|||
| ! | |||
| ‘!’ packet: | Packets | ||
|
|
|||
| « | |||
| “No symbol «foo» in current context”: | Variables | ||
|
|
|||
| # | |||
# in Modula-2: |
GDB/M2 | ||
|
|
|||
| $ | |||
$: |
Value History | ||
$$: |
Value History | ||
$_ and info breakpoints: |
Set Breaks | ||
$_ and info line: |
Machine Code | ||
$_, $__, and value history: |
Memory | ||
|
|
|||
| & | |||
&, background execution of commands: |
Background Execution | ||
|
|
|||
| — | |||
--annotate: |
Mode Options | ||
--args: |
Mode Options | ||
—attach, gdbserver option: |
Server | ||
--batch: |
Mode Options | ||
--batch-silent: |
Mode Options | ||
--baud: |
Mode Options | ||
--cd: |
Mode Options | ||
--command: |
File Options | ||
--configuration: |
Mode Options | ||
--core: |
File Options | ||
--data-directory: |
Mode Options | ||
—debug, gdbserver option: |
Server | ||
—debug-file, gdbserver option: |
Server | ||
—debug-format, gdbserver option: |
Server | ||
--directory: |
File Options | ||
--early-init-command: |
File Options | ||
--early-init-eval-command: |
File Options | ||
--eval-command: |
File Options | ||
--exec: |
File Options | ||
--fullname: |
Mode Options | ||
--init-command: |
File Options | ||
--init-eval-command: |
File Options | ||
--interpreter: |
Mode Options | ||
—multi, gdbserver option: |
Connecting | ||
--nh: |
Mode Options | ||
--nowindows: |
Mode Options | ||
--nx: |
Mode Options | ||
—once, gdbserver option: |
Server | ||
--pid: |
File Options | ||
--quiet: |
Mode Options | ||
--readnever, command-line option: |
File Options | ||
--readnow: |
File Options | ||
—remote-debug, gdbserver option: |
Server | ||
--return-child-result: |
Mode Options | ||
--se: |
File Options | ||
| —selftest: | Server | ||
--silent: |
Mode Options | ||
--statistics: |
Mode Options | ||
--symbols: |
File Options | ||
--tty: |
Mode Options | ||
--tui: |
Mode Options | ||
--version: |
Mode Options | ||
--windows: |
Mode Options | ||
| ‘—with-gdb-datadir’: | Data Files | ||
| ‘—with-relocated-sources’: | Source Path | ||
| ‘—with-sysroot’: | Files | ||
—wrapper, gdbserver option: |
Server | ||
--write: |
Mode Options | ||
-b: |
Mode Options | ||
-c: |
File Options | ||
-d: |
File Options | ||
-D: |
Mode Options | ||
-e: |
File Options | ||
-eiex: |
File Options | ||
-eix: |
File Options | ||
-ex: |
File Options | ||
-f: |
Mode Options | ||
-iex: |
File Options | ||
-info-gdb-mi-command: |
GDB/MI Support Commands | ||
-ix: |
File Options | ||
-l: |
Mode Options | ||
-n: |
Mode Options | ||
-nw: |
Mode Options | ||
-p: |
File Options | ||
-q: |
Mode Options | ||
-r: |
File Options | ||
-readnever, option for symbol-file command: |
Files | ||
-s: |
File Options | ||
-t: |
Mode Options | ||
-w: |
Mode Options | ||
-x: |
File Options | ||
|
|
|||
| . | |||
., Modula-2 scope operator: |
M2 Scope | ||
| .build-id directory: | Separate Debug Files | ||
| .debug subdirectories: | Separate Debug Files | ||
.debug_gdb_scripts section: |
dotdebug_gdb_scripts section | ||
| .gdbinit: | Initialization Files | ||
| ‘.gdb_index’ section: | Index Files | ||
| .gdb_index section format: | Index Section Format | ||
| ‘.gnu_debugdata’ section: | MiniDebugInfo | ||
.gnu_debuglink sections: |
Separate Debug Files | ||
.note.gnu.build-id sections: |
Separate Debug Files | ||
| .o files, reading symbols from: | Files | ||
|
|
|||
| / | |||
| /proc: | Process Information | ||
|
|
|||
| : | |||
::, context for variables/functions: |
Variables | ||
|
|
|||
| < | |||
| <architecture>: | Target Description Format | ||
<compatible>: |
Target Description Format | ||
| <feature>: | Target Description Format | ||
| <flags>: | Target Description Format | ||
| <not saved> values: | Registers | ||
<osabi>: |
Target Description Format | ||
| <reg>: | Target Description Format | ||
| <struct>: | Target Description Format | ||
| <union>: | Target Description Format | ||
| <vector>: | Target Description Format | ||
| <xi:include>: | Target Description Format | ||
|
|
|||
| ? | |||
| ‘?’ packet: | Packets | ||
|
|
|||
| _ | |||
_NSPrintForDebugger, and printing Objective-C objects: |
The Print Command with Objective-C | ||
|
|
|||
| { | |||
| {type}: | Expressions | ||
|
|
|||
| A | |||
| ‘A’ packet: | Packets | ||
| AArch64 Memory Tagging Extension.: | AArch64 | ||
| AArch64 Pointer Authentication.: | AArch64 | ||
| AArch64 support: | AArch64 | ||
| AArch64 SVE.: | AArch64 | ||
| abbreviation: | Command Syntax | ||
| acknowledgment, for GDB remote: | Packet Acknowledgment | ||
| active targets: | Active Targets | ||
| Ada: | Ada | ||
| Ada exception catching: | Set Catchpoints | ||
| Ada exception handlers catching: | Set Catchpoints | ||
| Ada mode, general: | Ada Mode Intro | ||
| Ada task switching: | Ada Tasks | ||
| Ada tasking and core file debugging: | Ada Tasks and Core Files | ||
| Ada, deviations from: | Additions to Ada | ||
| Ada, omissions from: | Omissions from Ada | ||
| Ada, problems: | Ada Glitches | ||
| Ada, source character set: | Ada Source Character Set | ||
| Ada, tasking: | Ada Tasks | ||
| add new commands for external monitor: | Connecting | ||
| address locations: | Address Locations | ||
| address of a symbol: | Symbols | ||
| address size for remote targets: | Remote Configuration | ||
| addressable memory unit: | Memory | ||
| aggregates (Ada): | Omissions from Ada | ||
| AIX threads: | Debugging Output | ||
| aliases for commands: | Aliases | ||
| aliases for commands, default arguments: | Command aliases default args | ||
| alignment of remote memory accesses: | Packets | ||
| all-stop mode: | All-Stop Mode | ||
| Alpha stack: | MIPS | ||
| ambiguous expressions: | Ambiguous Expressions | ||
| annotations: | Annotations Overview | ||
| annotations for errors, warnings and interrupts: | Errors | ||
| annotations for invalidation messages: | Invalidation | ||
| annotations for prompts: | Prompting | ||
| annotations for running programs: | Annotations for Running | ||
| annotations for source display: | Source Annotations | ||
| append data to a file: | Dump/Restore Files | ||
| Application Data Integrity: | Sparc64 | ||
| apply a command to all frames (ignoring errors and empty output): | Frame Apply | ||
| apply a command to all frames of all threads (ignoring errors and empty output): | Threads | ||
| apply command to all threads (ignoring errors and empty output): | Threads | ||
| apply command to several frames: | Frame Apply | ||
| apply command to several threads: | Threads | ||
| ARC EM: | ARC | ||
| ARC HS: | ARC | ||
| ARC specific commands: | ARC | ||
| ARC600: | ARC | ||
| ARC700: | ARC | ||
| architecture debugging info: | Debugging Output | ||
| argument count in user-defined commands: | Define | ||
| arguments (to your program): | Arguments | ||
arguments, to gdbserver: |
Server | ||
| arguments, to user-defined commands: | Define | ||
| ARM 32-bit mode: | ARM | ||
| ARM AArch64: | Debugging Output | ||
| array aggregates (Ada): | Omissions from Ada | ||
| arrays: | Arrays | ||
| arrays in expressions: | Expressions | ||
| arrays slices (Fortran): | Special Fortran Commands | ||
| artificial array: | Arrays | ||
| assembly instructions: | Machine Code | ||
| assignment: | Assignment | ||
| async output in GDB/MI: | GDB/MI Output Syntax | ||
| async records in GDB/MI: | GDB/MI Async Records | ||
| asynchronous execution: | Background Execution | ||
| asynchronous execution: | Asynchronous and non-stop modes | ||
| asynchronous execution, and process record and replay: | Process Record and Replay | ||
| AT&T disassembly flavor: | Machine Code | ||
| attach: | Attach | ||
attach to a program, gdbserver: |
Server | ||
| auto-loading: | Auto-loading | ||
| auto-loading extensions: | Auto-loading extensions | ||
| auto-loading init file in the current directory: | Init File in the Current Directory | ||
| auto-loading libthread_db.so.1: | libthread_db.so.1 file | ||
| auto-loading safe-path: | Auto-loading safe path | ||
| auto-loading verbose mode: | Auto-loading verbose mode | ||
| auto-retry, for remote TCP target: | Remote Configuration | ||
| automatic display: | Auto Display | ||
| automatic hardware breakpoints: | Set Breaks | ||
| automatic overlay debugging: | Automatic Overlay Debugging | ||
| automatic symbol index cache: | Index Files | ||
| automatic thread selection: | All-Stop Mode | ||
| auxiliary vector: | OS Information | ||
| AVR: | AVR | ||
|
|
|||
| B | |||
| ‘b’ packet: | Packets | ||
| ‘B’ packet: | Packets | ||
| background execution: | Background Execution | ||
| background execution: | Asynchronous and non-stop modes | ||
backtrace beyond main function: |
Backtrace | ||
| backtrace limit: | Backtrace | ||
| base name differences: | Files | ||
| baud rate for remote targets: | Remote Configuration | ||
| ‘bc’ packet: | Packets | ||
| bcache statistics: | Maintenance Commands | ||
| bits in remote address: | Remote Configuration | ||
| blocks in guile: | Blocks In Guile | ||
| blocks in python: | Blocks In Python | ||
| bookmark: | Checkpoint/Restart | ||
| boundary violations, Intel MPX: | Signals | ||
| branch trace configuration format: | Branch Trace Configuration Format | ||
| branch trace format: | Branch Trace Format | ||
| branch trace store: | Process Record and Replay | ||
| break in overloaded functions: | Debugging C Plus Plus | ||
| break on a system call.: | Set Catchpoints | ||
| break on fork/exec: | Set Catchpoints | ||
| BREAK signal instead of Ctrl-C: | Remote Configuration | ||
| breakpoint address adjusted: | Breakpoint-related Warnings | ||
| breakpoint at static probe point: | Linespec Locations | ||
| breakpoint commands: | Break Commands | ||
| breakpoint commands for GDB/MI: | GDB/MI Breakpoint Commands | ||
| breakpoint commands, in remote protocol: | General Query Packets | ||
| breakpoint conditions: | Conditions | ||
| breakpoint kinds, ARM: | ARM Breakpoint Kinds | ||
| breakpoint kinds, MIPS: | MIPS Breakpoint Kinds | ||
| breakpoint lists: | Breakpoints | ||
| breakpoint numbers: | Breakpoints | ||
| breakpoint on events: | Breakpoints | ||
| breakpoint on memory address: | Breakpoints | ||
| breakpoint on variable modification: | Breakpoints | ||
| breakpoint ranges: | Breakpoints | ||
breakpoint subroutine, remote: |
Stub Contents | ||
| breakpointing Ada elaboration code: | Stopping Before Main Program | ||
| breakpoints: | Breakpoints | ||
| breakpoints and tasks, in Ada: | Ada Tasks | ||
| breakpoints and threads: | Thread-Specific Breakpoints | ||
| breakpoints at functions matching a regexp: | Set Breaks | ||
| breakpoints in guile: | Breakpoints In Guile | ||
| breakpoints in overlays: | Overlay Commands | ||
| breakpoints in python: | Breakpoints In Python | ||
| breakpoints, multiple locations: | Set Breaks | ||
| ‘bs’ packet: | Packets | ||
| bug criteria: | Bug Criteria | ||
| bug reports: | Bug Reporting | ||
| bugs in GDB: | GDB Bugs | ||
| build ID sections: | Separate Debug Files | ||
| build ID, and separate debugging files: | Separate Debug Files | ||
| building GDB, requirements for: | Requirements | ||
| built-in simulator target: | Target Commands | ||
| builtin Go functions: | Go | ||
| builtin Go types: | Go | ||
|
|
|||
| C | |||
| C and C++: | C | ||
| C and C++ checks: | C Checks | ||
| C and C++ constants: | C Constants | ||
| C and C++ defaults: | C Defaults | ||
| C and C++ operators: | C Operators | ||
| ‘c’ packet: | Packets | ||
| ‘C’ packet: | Packets | ||
| C++: | C | ||
| C++ compilers: | C Plus Plus Expressions | ||
| C++ demangling: | Debugging C Plus Plus | ||
| C++ exception handling: | Debugging C Plus Plus | ||
| C++ overload debugging info: | Debugging Output | ||
| C++ scope resolution: | Variables | ||
| C++ symbol decoding style: | Print Settings | ||
| C++ symbol display: | Debugging C Plus Plus | ||
| caching data of targets: | Caching Target Data | ||
| caching of bfd objects: | File Caching | ||
| caching of opened files: | File Caching | ||
| call dummy stack unwinding: | Calling | ||
| call dummy stack unwinding on unhandled exception.: | Calling | ||
| call overloaded functions: | C Plus Plus Expressions | ||
| call stack: | Stack | ||
| call stack traces: | Backtrace | ||
| call-clobbered registers: | Registers | ||
| caller-saved registers: | Registers | ||
| calling functions: | Calling | ||
| calling functions in the program, disabling: | Calling | ||
| calling make: | Shell Commands | ||
| case sensitivity in symbol names: | Symbols | ||
| case-insensitive symbol names: | Symbols | ||
| casts, in expressions: | Expressions | ||
| casts, to view memory: | Expressions | ||
| catch Ada exceptions: | Set Catchpoints | ||
| catch Ada exceptions when handled: | Set Catchpoints | ||
| catch syscalls from inferior, remote request: | General Query Packets | ||
| catchpoints: | Breakpoints | ||
| catchpoints, setting: | Set Catchpoints | ||
| change GDB’s working directory: | Working Directory | ||
| change inferior’s working directory: | Working Directory | ||
| character sets: | Character Sets | ||
| charset: | Character Sets | ||
| checkpoint: | Checkpoint/Restart | ||
| checkpoints and process id: | Checkpoint/Restart | ||
| checks, range: | Type Checking | ||
| checks, type: | Checks | ||
| checksum, for GDB remote: | Overview | ||
| choosing target byte order: | Byte Order | ||
| circular trace buffer: | Starting and Stopping Trace Experiments | ||
| clearing breakpoints, watchpoints, catchpoints: | Delete Breaks | ||
| CLI commands in python: | CLI Commands In Python | ||
| close, file-i/o system call: | close | ||
| closest symbol and offset for an address: | Symbols | ||
| code address and its source line: | Machine Code | ||
| code compression, MIPS: | MIPS | ||
| code location: | Location Specifications | ||
| COFF/PE exported symbols: | Debugging Output | ||
| collected data discarded: | Starting and Stopping Trace Experiments | ||
| colon, doubled as scope operator: | M2 Scope | ||
| colon-colon, context for variables/functions: | Variables | ||
| colors: | Output Styling | ||
| command editing: | Readline Bare Essentials | ||
| command files: | Command Files | ||
| command history: | Command History | ||
| command hooks: | Hooks | ||
| command interpreters: | Interpreters | ||
| command line editing: | Editing | ||
| command options: | Command Options | ||
| command options, boolean: | Command Options | ||
| command options, raw input: | Command Options | ||
| command scripts, debugging: | Messages/Warnings | ||
| command tracing: | Messages/Warnings | ||
| commands for C++: | Debugging C Plus Plus | ||
| commands in guile: | Commands In Guile | ||
| commands in python, CLI: | CLI Commands In Python | ||
| commands in python, GDB/MI: | GDB/MI Commands In Python | ||
| commands to access guile: | Guile Commands | ||
| commands to access python: | Python Commands | ||
| comment: | Command Syntax | ||
COMMON blocks, Fortran: |
Special Fortran Commands | ||
| common targets: | Target Commands | ||
| compatibility, GDB/MI and CLI: | GDB/MI Compatibility with CLI | ||
| compilation directory: | Source Path | ||
| compile C++ type conversion: | Compiling and Injecting Code | ||
| compile command debugging info: | Compiling and Injecting Code | ||
| compile command driver filename override: | Compiling and Injecting Code | ||
| compile command options override: | Compiling and Injecting Code | ||
| compiling code: | Compiling and Injecting Code | ||
| completion: | Completion | ||
| completion of Guile commands: | Commands In Guile | ||
| completion of Python commands: | CLI Commands In Python | ||
| completion of quoted strings: | Completion | ||
| completion of structure field names: | Completion | ||
| completion of union field names: | Completion | ||
| compressed debug sections: | Requirements | ||
| conditional breakpoints: | Conditions | ||
| conditional tracepoints: | Tracepoint Conditions | ||
| configure debuginfod URLs: | Debuginfod Settings | ||
| configuring GDB: | Running Configure | ||
| confirmation: | Messages/Warnings | ||
| connection timeout, for remote TCP target: | Remote Configuration | ||
| connections in python: | Connections In Python | ||
| console i/o as part of file-i/o: | Console I/O | ||
| console interpreter: | Interpreters | ||
| console output in GDB/MI: | GDB/MI Output Syntax | ||
| constants, in file-i/o protocol: | Constants | ||
| continuing: | Continuing and Stepping | ||
| continuing threads: | Thread Stops | ||
| control C, and remote debugging: | Bootstrapping | ||
| controlling terminal: | Input/Output | ||
| convenience functions: | Convenience Funs | ||
| convenience functions in python: | Functions In Python | ||
| convenience variables: | Convenience Vars | ||
| convenience variables for tracepoints: | Tracepoint Variables | ||
| convenience variables, and trace state variables: | Trace State Variables | ||
| convenience variables, initializing: | Convenience Vars | ||
| core dump file: | Files | ||
| core dump file target: | Target Commands | ||
| crash of debugger: | Bug Criteria | ||
| CRC algorithm definition: | Separate Debug Files | ||
| CRC of memory block, remote request: | General Query Packets | ||
| CRIS: | CRIS | ||
| CRIS mode: | CRIS | ||
| CRIS version: | CRIS | ||
| Ctrl-BREAK, MS-Windows: | Cygwin Native | ||
| ctrl-c message, in file-i/o protocol: | The Ctrl-C Message | ||
| current Ada task ID: | Ada Tasks | ||
| current directory: | Source Path | ||
| current Go package: | Go | ||
| current thread: | Threads | ||
| current thread, remote request: | General Query Packets | ||
| custom JIT debug info: | Custom Debug Info | ||
| Cygwin DLL, debugging: | Cygwin Native | ||
| Cygwin-specific commands: | Cygwin Native | ||
|
|
|||
| D | |||
| D: | D | ||
| ‘d’ packet: | Packets | ||
| ‘D’ packet: | Packets | ||
| Darwin: | Darwin | ||
| data breakpoints: | Breakpoints | ||
| data manipulation, in GDB/MI: | GDB/MI Data Manipulation | ||
| dcache line-size: | Caching Target Data | ||
| dcache size: | Caching Target Data | ||
| dcache, flushing: | Caching Target Data | ||
| dead names, GNU Hurd: | Hurd Native | ||
| debug expression parser: | Debugging Output | ||
| debug formats and C++: | C Plus Plus Expressions | ||
| debug link sections: | Separate Debug Files | ||
| debug remote protocol: | Debugging Output | ||
| debugger crash: | Bug Criteria | ||
| debugging agent: | In-Process Agent | ||
| debugging C++ programs: | C Plus Plus Expressions | ||
| debugging information directory, global: | Separate Debug Files | ||
| debugging information in separate files: | Separate Debug Files | ||
debugging libthread_db: |
Threads | ||
| debugging multiple processes: | Forks | ||
| debugging optimized code: | Optimized Code | ||
| debugging stub, example: | Remote Stub | ||
| debugging target: | Targets | ||
| debugging the Cygwin DLL: | Cygwin Native | ||
debugging threads: |
Threads | ||
| debuginfod: | Debuginfod | ||
| debuginfod verbosity: | Debuginfod Settings | ||
| decimal floating point format: | Decimal Floating Point | ||
| default behavior of commands, changing: | Command Settings | ||
| default collection action: | Tracepoint Actions | ||
| default data directory: | Data Files | ||
| default settings, changing: | Command Settings | ||
| default source path substitution: | Source Path | ||
| default system root: | Files | ||
| define trace state variable, remote request: | Tracepoint Packets | ||
| defining macros interactively: | Macros | ||
| definition of a macro, showing: | Macros | ||
| delete breakpoints: | Delete Breaks | ||
| deleting breakpoints, watchpoints, catchpoints: | Delete Breaks | ||
| deliver a signal to a program: | Signaling | ||
| demangle: | Symbols | ||
| demangler crashes: | Maintenance Commands | ||
| demangler crashes: | Maintenance Commands | ||
| demangler crashes: | Maintenance Commands | ||
| demangling C++ names: | Print Settings | ||
| deprecated commands: | Maintenance Commands | ||
| derived type of an object, printing: | Print Settings | ||
| descriptor tables display: | DJGPP Native | ||
| detach from task, GNU Hurd: | Hurd Native | ||
| detach from thread, GNU Hurd: | Hurd Native | ||
| direct memory access (DMA) on MS-DOS: | DJGPP Native | ||
| directories for source files: | Source Path | ||
| directory, compilation: | Source Path | ||
| directory, current: | Source Path | ||
| disable address space randomization, remote request: | General Query Packets | ||
| disabling calling functions in the program: | Calling | ||
| disassembler in Python, global vs. specific: | Disassembly In Python | ||
| disassembler options: | Machine Code | ||
| disconnected tracing: | Starting and Stopping Trace Experiments | ||
| displaced stepping debugging info: | Debugging Output | ||
| displaced stepping support: | Maintenance Commands | ||
| displaced stepping, and process record and replay: | Process Record and Replay | ||
| display command history: | Command History | ||
| display derived types: | Print Settings | ||
| display disabled out of scope: | Auto Display | ||
| display GDB copyright: | Help | ||
| display of expressions: | Auto Display | ||
| display remote monitor communications: | Target Commands | ||
| display remote packets: | Debugging Output | ||
| DJGPP debugging: | DJGPP Native | ||
| DLLs with no debugging symbols: | Non-debug DLL Symbols | ||
| do not print frame arguments: | Print Settings | ||
| documentation: | Formatting Documentation | ||
| don’t repeat command: | Define | ||
| don’t repeat Guile command: | Commands In Guile | ||
| don’t repeat Python command: | CLI Commands In Python | ||
| DOS file-name semantics of file names.: | Files | ||
| DOS serial data link, remote debugging: | DJGPP Native | ||
| DOS serial port status: | DJGPP Native | ||
| DPMI: | DJGPP Native | ||
| dprintf: | Dynamic Printf | ||
| dump all data collected at tracepoint: | tdump | ||
| dump core from inferior: | Core File Generation | ||
| dump data to a file: | Dump/Restore Files | ||
| dump/restore files: | Dump/Restore Files | ||
| DVC register: | PowerPC Embedded | ||
| DWARF compilation units cache: | Maintenance Commands | ||
| DWARF DIEs: | Debugging Output | ||
| DWARF frame unwinders: | Maintenance Commands | ||
| DWARF Line Tables: | Debugging Output | ||
| DWARF Reading: | Debugging Output | ||
| DWARF-2 CFI and CRIS: | CRIS | ||
| dynamic linking: | Files | ||
| dynamic printf: | Dynamic Printf | ||
| dynamic varobj: | GDB/MI Variable Objects | ||
|
|
|||
| E | |||
| early initialization: | Initialization Files | ||
| early initialization file: | Startup | ||
| editing: | Editing | ||
| editing command lines: | Readline Bare Essentials | ||
| editing source files: | Edit | ||
| eight-bit characters in strings: | Print Settings | ||
| elaboration phase: | Starting | ||
| ELinOS system-wide configuration script: | System-wide Configuration Scripts | ||
| Emacs: | Emacs | ||
| empty response, for unsupported packets: | Overview | ||
| enable debuginfod: | Debuginfod Settings | ||
| enable/disable a breakpoint: | Disabling | ||
| enabling and disabling probes: | Static Probe Points | ||
| entering numbers: | Numbers | ||
| environment (of your program): | Environment | ||
| errno values, in file-i/o protocol: | Errno Values | ||
| error on valid input: | Bug Criteria | ||
| event debugging info: | Debugging Output | ||
| event designators: | Event Designators | ||
| event handling: | Set Catchpoints | ||
| event-loop debugging: | Debugging Output | ||
| examine process image: | Process Information | ||
| examining data: | Data | ||
| examining memory: | Memory | ||
| exception handlers: | Set Catchpoints | ||
| exceptions, guile: | Guile Exception Handling | ||
| exceptions, python: | Exception Handling | ||
| exec events, remote reply: | Stop Reply Packets | ||
| executable file: | Files | ||
| executable file target: | Target Commands | ||
| executable file, for remote target: | Remote Configuration | ||
| execute commands from a file: | Command Files | ||
| execute forward or backward in time: | Reverse Execution | ||
| execute remote command, remote request: | General Query Packets | ||
| execution, foreground, background and asynchronous: | Background Execution | ||
| execution, foreground, background and asynchronous: | Asynchronous and non-stop modes | ||
| exit status of shell commands: | Convenience Vars | ||
| exiting GDB: | Quitting GDB | ||
| expand macro once: | Macros | ||
| expanding preprocessor macros: | Macros | ||
| explicit locations: | Explicit Locations | ||
| explore type: | Data | ||
| explore value: | Data | ||
| exploring hierarchical data structures: | Data | ||
| expression debugging info: | Debugging Output | ||
| expression parser, debugging info: | Debugging Output | ||
| expressions: | Expressions | ||
| expressions in Ada: | Ada | ||
| expressions in C or C++: | C | ||
| expressions in C++: | C Plus Plus Expressions | ||
| expressions in Modula-2: | Modula-2 | ||
| extend GDB for remote targets: | Connecting | ||
| extending GDB: | Extending GDB | ||
| extra signal information: | Signals | ||
|
|
|||
| F | |||
| ‘F’ packet: | Packets | ||
F reply packet: |
The F Reply Packet | ||
F request packet: |
The F Request Packet | ||
| fast tracepoints: | Set Tracepoints | ||
| fast tracepoints, setting: | Create and Delete Tracepoints | ||
| fatal signal: | Bug Criteria | ||
| fatal signals: | Signals | ||
| features of the remote protocol: | General Query Packets | ||
| fetch memory tags: | General Query Packets | ||
| file name canonicalization: | Files | ||
| file transfer: | File Transfer | ||
| file transfer, remote protocol: | Host I/O Packets | ||
| file-i/o examples: | File-I/O Examples | ||
| file-i/o overview: | File-I/O Overview | ||
| File-I/O remote protocol extension: | File-I/O Remote Protocol Extension | ||
| file-i/o reply packet: | The F Reply Packet | ||
| file-i/o request packet: | The F Request Packet | ||
| filename-display: | Backtrace | ||
| find trace snapshot: | tfind | ||
| flinching: | Messages/Warnings | ||
| float promotion: | ABI | ||
| floating point: | Floating Point Hardware | ||
| floating point registers: | Registers | ||
| floating point, MIPS remote: | MIPS Embedded | ||
| focus of debugging: | Threads | ||
| foo: | Symbol Errors | ||
| foreground execution: | Background Execution | ||
| foreground execution: | Asynchronous and non-stop modes | ||
| fork events, remote reply: | Stop Reply Packets | ||
| fork, debugging programs which call: | Forks | ||
| format options: | Print Settings | ||
| formatted output: | Output Formats | ||
| Fortran: | Summary | ||
| fortran array slicing debugging info: | Debugging Output | ||
| Fortran Defaults: | Fortran | ||
| Fortran Intrinsics: | Fortran Intrinsics | ||
| Fortran modules, information about: | Symbols | ||
| Fortran operators and expressions: | Fortran Operators | ||
| Fortran Types: | Fortran Types | ||
| Fortran-specific support in GDB: | Fortran | ||
| frame debugging info: | Debugging Output | ||
| frame decorator api: | Frame Decorator API | ||
| frame filters api: | Frame Filter API | ||
| frame information, printing: | Print Settings | ||
| frame level: | Frames | ||
| frame number: | Frames | ||
| frame pointer: | Frames | ||
| frame pointer register: | Registers | ||
| frame, definition: | Frames | ||
| frameless execution: | Frames | ||
| frames in guile: | Frames In Guile | ||
| frames in python: | Frames In Python | ||
| free memory information (MS-DOS): | DJGPP Native | ||
| FreeBSD: | FreeBSD | ||
| FreeBSD LWP debug messages: | Debugging Output | ||
| FreeBSD native target debug messages: | Debugging Output | ||
| fstat, file-i/o system call: | stat/fstat | ||
| Fujitsu: | Remote Stub | ||
| full symbol tables, listing GDB’s internal: | Symbols | ||
| function call arguments, optimized out: | Backtrace | ||
| function entry/exit, wrong values of variables: | Variables | ||
| functions and variables by Fortran module: | Symbols | ||
| functions without line info, and stepping: | Continuing and Stepping | ||
|
|
|||
| G | |||
| ‘g’ packet: | Packets | ||
| ‘G’ packet: | Packets | ||
g++, GNU C++ compiler: |
C | ||
| garbled pointers: | DJGPP Native | ||
| GCC and C++: | C Plus Plus Expressions | ||
| GDB bugs, reporting: | Bug Reporting | ||
| GDB internal error: | Maintenance Commands | ||
| gdb module: | Basic Python | ||
| gdb objects: | GDB Scheme Data Types | ||
| GDB reference card: | Formatting Documentation | ||
| GDB startup: | Startup | ||
| GDB version number: | Help | ||
| gdb.ini: | Initialization Files | ||
| gdb.printing: | gdb.printing | ||
| gdb.prompt: | gdb.prompt | ||
| gdb.types: | gdb.types | ||
gdb.Value: |
Values From Inferior | ||
| GDB/MI development: | GDB/MI Development and Front Ends | ||
| GDB/MI General Design: | GDB/MI General Design | ||
| GDB/MI, async records: | GDB/MI Async Records | ||
| GDB/MI, breakpoint commands: | GDB/MI Breakpoint Commands | ||
| GDB/MI, compatibility with CLI: | GDB/MI Compatibility with CLI | ||
| GDB/MI, data manipulation: | GDB/MI Data Manipulation | ||
| GDB/MI, input syntax: | GDB/MI Input Syntax | ||
| GDB/MI, its purpose: | GDB/MI | ||
| GDB/MI, output syntax: | GDB/MI Output Syntax | ||
| GDB/MI, result records: | GDB/MI Result Records | ||
| GDB/MI, simple examples: | GDB/MI Simple Examples | ||
| GDB/MI, stream records: | GDB/MI Stream Records | ||
| gdbarch debugging info: | Debugging Output | ||
GDBHISTFILE, environment variable: |
Command History | ||
GDBHISTSIZE, environment variable: |
Command History | ||
| gdbinit: | Initialization Files | ||
gdbserver, command-line arguments: |
Server | ||
gdbserver, connecting: |
Connecting | ||
gdbserver, search path for libthread_db: |
Server | ||
gdbserver, send all debug output to a single file: |
Server | ||
gdbserver, target extended-remote mode: |
Connecting | ||
gdbserver, target remote mode: |
Connecting | ||
gdbserver, types of connections: |
Connecting | ||
| GDT: | DJGPP Native | ||
| general initialization: | Initialization Files | ||
| get thread information block address: | General Query Packets | ||
| get thread-local storage address, remote request: | General Query Packets | ||
| gettimeofday, file-i/o system call: | gettimeofday | ||
| getting structure elements using gdb.Field objects as subscripts: | Values From Inferior | ||
| global debugging information directories: | Separate Debug Files | ||
| global thread identifier (GDB): | Threads | ||
| global thread number: | Threads | ||
| GNAT descriptive types: | Ada Glitches | ||
| GNAT encoding: | Ada Glitches | ||
| GNU C++: | C | ||
| GNU Emacs: | Emacs | ||
| GNU Hurd debugging: | Hurd Native | ||
| GNU/Hurd debug messages: | Debugging Output | ||
| GNU/Linux namespaces debug messages: | Debugging Output | ||
| GNU/Linux native target debug messages: | Debugging Output | ||
| Go (programming language): | Go | ||
| guile api: | Guile API | ||
| guile architectures: | Architectures In Guile | ||
| guile auto-loading: | Guile Auto-loading | ||
| guile commands: | Guile Commands | ||
| guile commands: | Commands In Guile | ||
| guile configuration: | Guile Configuration | ||
| guile exceptions: | Guile Exception Handling | ||
| guile gdb module: | Basic Guile | ||
| guile iterators: | Iterators In Guile | ||
| guile modules: | Guile Modules | ||
| guile pagination: | Basic Guile | ||
| guile parameters: | Parameters In Guile | ||
| guile pretty printing api: | Guile Pretty Printing API | ||
| guile scripting: | Guile | ||
| guile scripts directory: | Guile Introduction | ||
| guile stdout: | Basic Guile | ||
| guile, working with types: | Types In Guile | ||
| guile, working with values from inferior: | Values From Inferior In Guile | ||
|
|
|||
| H | |||
| ‘H’ packet: | Packets | ||
| handling signals: | Signals | ||
| hardware breakpoints: | Set Breaks | ||
| hardware debug registers: | Maintenance Commands | ||
| hardware watchpoints: | Set Watchpoints | ||
| hash mark while downloading: | Target Commands | ||
heuristic-fence-post (Alpha, MIPS): |
MIPS | ||
| history events: | Event Designators | ||
| history expansion: | History Interaction | ||
| history expansion, turn on/off: | Command History | ||
| history file: | Command History | ||
| history number: | Value History | ||
| history of values printed by GDB: | Value History | ||
| history size: | Command History | ||
| history substitution: | Command History | ||
| hooks, for commands: | Hooks | ||
| hooks, post-command: | Hooks | ||
| hooks, pre-command: | Hooks | ||
| host character set: | Character Sets | ||
| Host I/O, remote protocol: | Host I/O Packets | ||
| how many arguments (user-defined commands): | Define | ||
| HPPA support: | HPPA | ||
|
|
|||
| I | |||
| ‘i’ packet: | Packets | ||
| ‘I’ packet: | Packets | ||
| i/o: | Input/Output | ||
| I/O registers (Atmel AVR): | AVR | ||
| i386: | Remote Stub | ||
| i386-stub.c: | Remote Stub | ||
| IDT: | DJGPP Native | ||
| ignore count (of breakpoint): | Conditions | ||
| in-process agent protocol: | In-Process Agent Protocol | ||
| incomplete type: | Symbols | ||
| indentation in structure display: | Print Settings | ||
| index files: | Index Files | ||
| index section format: | Index Section Format | ||
| inferior: | Inferiors Connections and Programs | ||
| inferior debugging info: | Debugging Output | ||
| inferior events in Python: | Events In Python | ||
| inferior function call debugging info: | Debugging Output | ||
| inferior functions, calling: | Calling | ||
| inferior tty: | Input/Output | ||
| inferiors in Python: | Inferiors In Python | ||
| infinite recursion in user-defined commands: | Define | ||
| info for known .debug_gdb_scripts-loaded scripts: | Maintenance Commands | ||
| info for known object files: | Maintenance Commands | ||
| info line, repeated calls: | Machine Code | ||
| info proc cmdline: | Process Information | ||
| info proc cwd: | Process Information | ||
| info proc exe: | Process Information | ||
| info proc files: | Process Information | ||
| information about static tracepoint markers: | Listing Static Tracepoint Markers | ||
| information about tracepoints: | Listing Tracepoints | ||
| inheritance: | Debugging C Plus Plus | ||
| init file: | Startup | ||
| init file name: | Initialization Files | ||
| initial frame: | Frames | ||
| initialization file: | Initialization Files | ||
| initialization file, readline: | Readline Init File | ||
| injecting code: | Compiling and Injecting Code | ||
| inline functions, debugging: | Inline Functions | ||
| innermost frame: | Frames | ||
| input syntax for GDB/MI: | GDB/MI Input Syntax | ||
| installation: | Installing GDB | ||
| instructions, assembly: | Machine Code | ||
| integral datatypes, in file-i/o protocol: | Integral Datatypes | ||
| Intel: | Remote Stub | ||
| Intel disassembly flavor: | Machine Code | ||
| Intel Memory Protection Extensions (MPX).: | i386 | ||
| Intel MPX boundary violations: | Signals | ||
| Intel Processor Trace: | Process Record and Replay | ||
| interaction, readline: | Readline Interaction | ||
| internal commands: | Maintenance Commands | ||
| internal errors, control of GDB behavior: | Maintenance Commands | ||
| internal GDB breakpoints: | Set Breaks | ||
| interrupt: | Quitting GDB | ||
| interrupt debuggee on MS-Windows: | Cygwin Native | ||
| interrupt remote programs: | Remote Configuration | ||
| interrupt remote programs: | Remote Configuration | ||
| interrupting remote programs: | Connecting | ||
| interrupting remote targets: | Bootstrapping | ||
| interrupts (remote protocol): | Interrupts | ||
| invalid input: | Bug Criteria | ||
| invoke another interpreter: | Interpreters | ||
| ipa protocol commands: | IPA Protocol Commands | ||
| ipa protocol objects: | IPA Protocol Objects | ||
| isatty, file-i/o system call: | isatty | ||
|
|
|||
| J | |||
| JIT compilation interface: | JIT Interface | ||
| JIT debug info reader: | Custom Debug Info | ||
| just-in-time compilation: | JIT Interface | ||
| just-in-time compilation, debugging messages: | Debugging Output | ||
|
|
|||
| K | |||
| ‘k’ packet: | Packets | ||
| kernel crash dump: | BSD libkvm Interface | ||
| kernel memory image: | BSD libkvm Interface | ||
| kill ring: | Readline Killing Commands | ||
| killing text: | Readline Killing Commands | ||
|
|
|||
| L | |||
| languages: | Languages | ||
| last tracepoint number: | Create and Delete Tracepoints | ||
| latest breakpoint: | Set Breaks | ||
| lazy strings in guile: | Lazy Strings In Guile | ||
| lazy strings in python: | Lazy Strings In Python | ||
| LDT: | DJGPP Native | ||
| leaving GDB: | Quitting GDB | ||
| libkvm: | BSD libkvm Interface | ||
| library list format, remote protocol: | Library List Format | ||
| library list format, remote protocol: | Library List Format for SVR4 Targets | ||
| limit hardware breakpoints and watchpoints: | Remote Configuration | ||
| limit hardware watchpoints length: | Remote Configuration | ||
| limit on number of printed array elements: | Print Settings | ||
| limits, in file-i/o protocol: | Limits | ||
| line tables in python: | Line Tables In Python | ||
| line tables, listing GDB’s internal: | Symbols | ||
| linespec locations: | Linespec Locations | ||
| Linux native targets: | Debugging Output | ||
| list active threads, remote request: | General Query Packets | ||
| list of supported file-i/o calls: | List of Supported Calls | ||
| list output in GDB/MI: | GDB/MI Output Syntax | ||
list, how many lines to display: |
List | ||
| listing GDB’s internal line tables: | Symbols | ||
| listing GDB’s internal symbol tables: | Symbols | ||
| listing machine instructions: | Machine Code | ||
| listing mapped overlays: | Overlay Commands | ||
| lists of breakpoints: | Breakpoints | ||
| load address, overlay’s: | How Overlays Work | ||
| load shared library: | Files | ||
| load symbols from memory: | Files | ||
local socket, target remote: |
Connecting | ||
| local variables: | Symbols | ||
| locate address: | Output Formats | ||
| location resolution: | Location Specifications | ||
| location spec: | Location Specifications | ||
| lock scheduler: | All-Stop Mode | ||
| locspec: | Location Specifications | ||
| log output in GDB/MI: | GDB/MI Output Syntax | ||
| logging file name: | Logging Output | ||
| logging GDB output: | Logging Output | ||
| look up of disassembler in Python: | Disassembly In Python | ||
| lseek flags, in file-i/o protocol: | Lseek Flags | ||
| lseek, file-i/o system call: | lseek | ||
|
|
|||
| M | |||
| ‘m’ packet: | Packets | ||
| ‘M’ packet: | Packets | ||
| m680x0: | Remote Stub | ||
| m68k-stub.c: | Remote Stub | ||
| Mach-O symbols processing: | Debugging Output | ||
| machine instructions: | Machine Code | ||
| macro definition, showing: | Macros | ||
| macro expansion, showing the results of preprocessor: | Macros | ||
| macros, example of debugging with: | Macros | ||
| macros, from debug info: | Macros | ||
| macros, user-defined: | Macros | ||
| mailing lists: | GDB/MI Development and Front Ends | ||
| maintenance commands: | Maintenance Commands | ||
| Man pages: | Man Pages | ||
| managing frame filters: | Frame Filter Management | ||
| manual overlay debugging: | Overlay Commands | ||
| map an overlay: | Overlay Commands | ||
| mapinfo list, QNX Neutrino: | Process Information | ||
| mapped address: | How Overlays Work | ||
| mapped overlays: | How Overlays Work | ||
| markers, static tracepoints: | Set Tracepoints | ||
| maximum value for offset of closest symbol: | Print Settings | ||
| member functions: | C Plus Plus Expressions | ||
| memory address space mappings: | Process Information | ||
| memory address space mappings: | Maintenance Commands | ||
| memory map format: | Memory Map Format | ||
| memory region attributes: | Memory Region Attributes | ||
| memory tag types, ARM: | ARM Memory Tag Types | ||
| memory tracing: | Breakpoints | ||
| memory transfer, in file-i/o protocol: | Memory Transfer | ||
| memory used by commands: | Maintenance Commands | ||
| memory used for symbol tables: | Files | ||
| memory, alignment and size of remote accesses: | Packets | ||
| memory, viewing as typed object: | Expressions | ||
| MI commands in python: | GDB/MI Commands In Python | ||
| mi interpreter: | Interpreters | ||
| mi1 interpreter: | Interpreters | ||
| mi2 interpreter: | Interpreters | ||
| mi3 interpreter: | Interpreters | ||
| minimal language: | Unsupported Languages | ||
| minimal symbol dump: | Symbols | ||
| Minimal symbols and DLLs: | Non-debug DLL Symbols | ||
| MIPS addresses, masking: | MIPS | ||
| MIPS remote floating point: | MIPS Embedded | ||
| MIPS stack: | MIPS | ||
| miscellaneous settings: | Other Misc Settings | ||
| MMX registers (x86): | Registers | ||
| mode_t values, in file-i/o protocol: | mode_t Values | ||
| Modula-2: | Summary | ||
| Modula-2 built-ins: | Built-In Func/Proc | ||
| Modula-2 checks: | M2 Checks | ||
| Modula-2 constants: | Built-In Func/Proc | ||
| Modula-2 defaults: | M2 Defaults | ||
| Modula-2 operators: | M2 Operators | ||
| Modula-2 types: | M2 Types | ||
| Modula-2, deviations from: | Deviations | ||
| Modula-2, GDB support: | Modula-2 | ||
| module functions and variables: | Symbols | ||
| modules: | Symbols | ||
monitor commands, for gdbserver: |
Server | ||
| Motorola 680×0: | Remote Stub | ||
| MS Windows debugging: | Cygwin Native | ||
| MS-DOS system info: | DJGPP Native | ||
| MS-DOS-specific commands: | DJGPP Native | ||
| multiple locations, breakpoints: | Set Breaks | ||
| multiple processes: | Forks | ||
| multiple targets: | Active Targets | ||
| multiple threads: | Threads | ||
| multiple threads, backtrace: | Backtrace | ||
| multiple-symbols menu: | Ambiguous Expressions | ||
| multiprocess extensions, in remote protocol: | General Query Packets | ||
|
|
|||
| N | |||
| name a thread: | Threads | ||
| names of symbols: | Symbols | ||
| namespace in C++: | C Plus Plus Expressions | ||
| native Cygwin debugging: | Cygwin Native | ||
| native DJGPP debugging: | DJGPP Native | ||
| native script auto-loading: | Auto-loading sequences | ||
| native target: | Target Commands | ||
| negative breakpoint numbers: | Set Breaks | ||
| never read symbols: | Files | ||
New systag message: |
Threads | ||
| new user interface: | Interpreters | ||
| Newlib OS ABI and its influence on the longjmp handling: | ABI | ||
| Nios II architecture: | Nios II | ||
| no debug info functions: | Calling | ||
| no debug info variables: | Variables | ||
| non-member C++ functions, set breakpoint in: | Set Breaks | ||
| non-stop mode: | Non-Stop Mode | ||
| non-stop mode, and process record and replay: | Process Record and Replay | ||
| non-stop mode, and ‘set displaced-stepping’: | Maintenance Commands | ||
| non-stop mode, remote request: | General Query Packets | ||
| noninvasive task options: | Hurd Native | ||
| notation, readline: | Readline Bare Essentials | ||
| notational conventions, for GDB/MI: | GDB/MI | ||
| notification packets: | Notification Packets | ||
| notify output in GDB/MI: | GDB/MI Output Syntax | ||
| NULL elements in arrays: | Print Settings | ||
| number of array elements to print: | Print Settings | ||
| number representation: | Numbers | ||
| numbers for breakpoints: | Breakpoints | ||
|
|
|||
| O | |||
| object files, relocatable, reading symbols from: | Files | ||
| Objective-C: | Objective-C | ||
| Objective-C, classes and selectors: | Symbols | ||
| Objective-C, print objects: | The Print Command with Objective-C | ||
| objfile-gdb.gdb: | objfile-gdbdotext file | ||
| objfile-gdb.py: | objfile-gdbdotext file | ||
| objfile-gdb.scm: | objfile-gdbdotext file | ||
| objfiles in guile: | Objfiles In Guile | ||
| objfiles in python: | Objfiles In Python | ||
| observer debugging info: | Debugging Output | ||
| octal escapes in strings: | Print Settings | ||
| online documentation: | Help | ||
| opaque data types: | Symbols | ||
| open flags, in file-i/o protocol: | Open Flags | ||
| open, file-i/o system call: | open | ||
| OpenCL C: | OpenCL C | ||
| OpenCL C Datatypes: | OpenCL C Datatypes | ||
| OpenCL C Expressions: | OpenCL C Expressions | ||
| OpenCL C Operators: | OpenCL C Operators | ||
| OpenRISC 1000: | OpenRISC 1000 | ||
| operate-and-get-next: | Editing | ||
| operating system information: | Operating System Information | ||
| operating system information, process list: | Process list | ||
| optimized code, debugging: | Optimized Code | ||
| optimized code, wrong values of variables: | Variables | ||
| optimized out value in guile: | Values From Inferior In Guile | ||
| optimized out value in Python: | Values From Inferior | ||
| optimized out, in backtrace: | Backtrace | ||
| optional debugging messages: | Debugging Output | ||
| optional warnings: | Messages/Warnings | ||
| OS ABI: | ABI | ||
| OS information: | OS Information | ||
| out-of-line single-stepping: | Maintenance Commands | ||
| outermost frame: | Frames | ||
| output formats: | Output Formats | ||
| output syntax of GDB/MI: | GDB/MI Output Syntax | ||
| overlay area: | How Overlays Work | ||
| overlay example program: | Overlay Sample Program | ||
| overlays: | Overlays | ||
| overlays, setting breakpoints in: | Overlay Commands | ||
| overloaded functions, calling: | C Plus Plus Expressions | ||
| overloaded functions, overload resolution: | Debugging C Plus Plus | ||
| overloading in C++: | Debugging C Plus Plus | ||
| overloading, Ada: | Overloading support for Ada | ||
|
|
|||
| P | |||
| ‘p’ packet: | Packets | ||
| ‘P’ packet: | Packets | ||
| packet acknowledgment, for GDB remote: | Packet Acknowledgment | ||
| packet size, remote protocol: | General Query Packets | ||
| packets, notification: | Notification Packets | ||
| packets, reporting on stdout: | Debugging Output | ||
| packets, tracepoint: | Tracepoint Packets | ||
| page size: | Screen Size | ||
| page tables display (MS-DOS): | DJGPP Native | ||
| pagination: | Screen Size | ||
| parameters in guile: | Parameters In Guile | ||
| parameters in python: | Parameters In Python | ||
| partial symbol dump: | Symbols | ||
| partial symbol tables, listing GDB’s internal: | Symbols | ||
| Pascal: | Summary | ||
| Pascal objects, static members display: | Print Settings | ||
| Pascal support in GDB, limitations: | Pascal | ||
| pass signals to inferior, remote request: | General Query Packets | ||
| patching binaries: | Patching | ||
| patching object files: | Files | ||
| pause current task (GNU Hurd): | Hurd Native | ||
| pause current thread (GNU Hurd): | Hurd Native | ||
| pauses in output: | Screen Size | ||
| pending breakpoints: | Set Breaks | ||
| physical address from linear address: | DJGPP Native | ||
| physname: | Debugging Output | ||
pipe, target remote to: |
Connecting | ||
| pipes: | Starting | ||
| pointer values, in file-i/o protocol: | Pointer Values | ||
| pointer, finding referent: | Print Settings | ||
| port rights, GNU Hurd: | Hurd Native | ||
| port sets, GNU Hurd: | Hurd Native | ||
| PowerPC architecture: | PowerPC | ||
| prefix for data files: | Data Files | ||
| prefix for executable and shared library file names: | Files | ||
| premature return from system calls: | Interrupted System Calls | ||
| preprocessor macro expansion, showing the results of: | Macros | ||
| pretty print arrays: | Print Settings | ||
| pretty print C++ virtual function tables: | Print Settings | ||
| pretty-printer commands: | Pretty-Printer Commands | ||
| print all frame argument values: | Print Settings | ||
| print an Objective-C object description: | The Print Command with Objective-C | ||
| print array indexes: | Print Settings | ||
| print binary values in groups of four bits: | Print Settings | ||
| print frame argument values for scalars only: | Print Settings | ||
| print list of auto-loaded canned sequences of commands scripts: | Auto-loading sequences | ||
| print list of auto-loaded Guile scripts: | Guile Auto-loading | ||
| print list of auto-loaded Python scripts: | Python Auto-loading | ||
| print messages on inferior start and exit: | Inferiors Connections and Programs | ||
| print messages on thread start and exit: | Threads | ||
| print messages when symbols are loaded: | Symbols | ||
| print settings: | Print Settings | ||
| print structures in indented form: | Print Settings | ||
| print/don’t print memory addresses: | Print Settings | ||
| printing byte arrays: | Output Formats | ||
| printing data: | Data | ||
| printing frame argument values: | Print Settings | ||
| printing frame information: | Print Settings | ||
| printing memory tag violation information: | Print Settings | ||
| printing nested structures: | Print Settings | ||
| printing strings: | Output Formats | ||
| probe static tracepoint marker: | Create and Delete Tracepoints | ||
| probing markers, static tracepoints: | Set Tracepoints | ||
| process detailed status information: | Process Information | ||
| process ID: | Process Information | ||
| process info via /proc: | Process Information | ||
| process list, QNX Neutrino: | Process Information | ||
| process record and replay: | Process Record and Replay | ||
| process status register: | Registers | ||
| processes, multiple: | Forks | ||
procfs API calls: |
Process Information | ||
| profiling GDB: | Maintenance Commands | ||
| program counter register: | Registers | ||
| program entry point: | Backtrace | ||
| programming in guile: | Guile API | ||
| programming in python: | Python API | ||
| progspaces in guile: | Progspaces In Guile | ||
| progspaces in python: | Progspaces In Python | ||
| prologue-end: | Symbols | ||
| prompt: | Prompt | ||
| protocol basics, file-i/o: | Protocol Basics | ||
| protocol, GDB remote serial: | Overview | ||
| protocol-specific representation of datatypes, in file-i/o protocol: | Protocol-specific Representation of Datatypes | ||
| python api: | Python API | ||
| Python architectures: | Architectures In Python | ||
| Python auto-loading: | Python Auto-loading | ||
| python commands: | Python Commands | ||
| python commands, CLI: | CLI Commands In Python | ||
| python commands, GDB/MI: | GDB/MI Commands In Python | ||
| python convenience functions: | Functions In Python | ||
| python directory: | Python | ||
| python exceptions: | Exception Handling | ||
| python finish breakpoints: | Finish Breakpoints in Python | ||
| python functions: | Basic Python | ||
| python instruction disassembly: | Disassembly In Python | ||
| python module: | Basic Python | ||
| python modules: | Python modules | ||
| python pagination: | Basic Python | ||
| python parameters: | Parameters In Python | ||
| python pretty printing api: | Pretty Printing API | ||
| python scripting: | Python | ||
| python stdout: | Basic Python | ||
| Python TUI Windows: | TUI Windows In Python | ||
| Python, working with types: | Types In Python | ||
| python, working with values from inferior: | Values From Inferior | ||
|
|
|||
| Q | |||
| ‘q’ packet: | Packets | ||
| ‘Q’ packet: | Packets | ||
| ‘QAllow’ packet: | General Query Packets | ||
| ‘qAttached’ packet: | General Query Packets | ||
| ‘qC’ packet: | General Query Packets | ||
| ‘QCatchSyscalls’ packet: | General Query Packets | ||
| ‘qCRC’ packet: | General Query Packets | ||
| ‘QDisableRandomization’ packet: | General Query Packets | ||
| ‘QEnvironmentHexEncoded’ packet: | General Query Packets | ||
| ‘QEnvironmentReset’ packet: | General Query Packets | ||
| ‘QEnvironmentUnset’ packet: | General Query Packets | ||
| ‘qfThreadInfo’ packet: | General Query Packets | ||
| ‘qGetTIBAddr’ packet: | General Query Packets | ||
| ‘qGetTLSAddr’ packet: | General Query Packets | ||
| ‘qMemTags’ packet: | General Query Packets | ||
| ‘QMemTags’ packet: | General Query Packets | ||
| ‘QNonStop’ packet: | General Query Packets | ||
| ‘qOffsets’ packet: | General Query Packets | ||
| ‘qP’ packet: | General Query Packets | ||
| ‘QPassSignals’ packet: | General Query Packets | ||
| ‘QProgramSignals’ packet: | General Query Packets | ||
| ‘qRcmd’ packet: | General Query Packets | ||
| ‘qSearch memory’ packet: | General Query Packets | ||
| ‘qSearch:memory’ packet: | General Query Packets | ||
| ‘QSetWorkingDir’ packet: | General Query Packets | ||
| ‘QStartNoAckMode’ packet: | General Query Packets | ||
| ‘QStartupWithShell’ packet: | General Query Packets | ||
| ‘qsThreadInfo’ packet: | General Query Packets | ||
| ‘qSupported’ packet: | General Query Packets | ||
| ‘qSymbol’ packet: | General Query Packets | ||
| ‘qTBuffer’ packet: | Tracepoint Packets | ||
| ‘QTBuffer size’ packet: | Tracepoint Packets | ||
| ‘QTDisable’ packet: | Tracepoint Packets | ||
| ‘QTDisconnected’ packet: | Tracepoint Packets | ||
| ‘QTDP’ packet: | Tracepoint Packets | ||
| ‘QTDPsrc’ packet: | Tracepoint Packets | ||
| ‘QTDV’ packet: | Tracepoint Packets | ||
| ‘QTEnable’ packet: | Tracepoint Packets | ||
| ‘qTfP’ packet: | Tracepoint Packets | ||
| ‘QTFrame’ packet: | Tracepoint Packets | ||
| ‘qTfSTM’ packet: | Tracepoint Packets | ||
| ‘qTfV’ packet: | Tracepoint Packets | ||
| ‘QThreadEvents’ packet: | General Query Packets | ||
| ‘qThreadExtraInfo’ packet: | General Query Packets | ||
| ‘QTinit’ packet: | Tracepoint Packets | ||
| ‘qTMinFTPILen’ packet: | Tracepoint Packets | ||
| ‘QTNotes’ packet: | Tracepoint Packets | ||
| ‘qTP’ packet: | Tracepoint Packets | ||
| ‘QTro’ packet: | Tracepoint Packets | ||
| ‘QTSave’ packet: | Tracepoint Packets | ||
| ‘qTsP’ packet: | Tracepoint Packets | ||
| ‘qTsSTM’ packet: | Tracepoint Packets | ||
| ‘QTStart’ packet: | Tracepoint Packets | ||
| ‘qTStatus’ packet: | Tracepoint Packets | ||
| ‘qTSTMat’ packet: | Tracepoint Packets | ||
| ‘QTStop’ packet: | Tracepoint Packets | ||
| ‘qTsV’ packet: | Tracepoint Packets | ||
| ‘qTV’ packet: | Tracepoint Packets | ||
| qualified thread ID: | Threads | ||
| query attached, remote request: | General Query Packets | ||
| quotes in commands: | Completion | ||
| quoting Ada internal identifiers: | Additions to Ada | ||
| quoting names: | Symbols | ||
| ‘qXfer’ packet: | General Query Packets | ||
|
|
|||
| R | |||
| ‘r’ packet: | Packets | ||
| ‘R’ packet: | Packets | ||
| range checking: | Type Checking | ||
| range stepping: | Continuing and Stepping | ||
| ranged breakpoint: | PowerPC Embedded | ||
| ranges of breakpoints: | Breakpoints | ||
| Ravenscar Profile: | Ravenscar Profile | ||
| Ravenscar thread: | Ravenscar Profile | ||
| raw printing: | Output Formats | ||
| read special object, remote request: | General Query Packets | ||
| read, file-i/o system call: | read | ||
| read-only sections: | Files | ||
| reading symbols from relocatable object files: | Files | ||
| reading symbols immediately: | Files | ||
| readline: | Editing | ||
| Readline application name: | Editing | ||
| receive rights, GNU Hurd: | Hurd Native | ||
| recent tracepoint number: | Create and Delete Tracepoints | ||
| record aggregates (Ada): | Omissions from Ada | ||
| record mode: | Process Record and Replay | ||
| record serial communications on file: | Remote Configuration | ||
| recording a session script: | Bug Reporting | ||
| recording inferior’s execution and replaying it: | Process Record and Replay | ||
| recordings in python: | Recordings In Python | ||
| redirection: | Input/Output | ||
| reference card: | Formatting Documentation | ||
| reference declarations: | C Plus Plus Expressions | ||
| register cache, flushing: | Maintenance Commands | ||
| register packet format, MIPS: | MIPS Register packet Format | ||
| registers: | Registers | ||
| Registers In Python: | Registers In Python | ||
| regular expression: | Set Breaks | ||
| reloading the overlay table: | Overlay Commands | ||
| relocatable object files, reading symbols from: | Files | ||
| remote async notification debugging info: | Debugging Output | ||
| remote connection commands: | Connecting | ||
| remote connection without stubs: | Server | ||
| remote debugging: | Remote Debugging | ||
| remote debugging, connecting: | Connecting | ||
| remote debugging, detach and program exit: | Connecting | ||
| remote debugging, symbol files: | Connecting | ||
| remote debugging, types of connections: | Connecting | ||
| remote memory comparison: | Memory | ||
| remote packets, enabling and disabling: | Remote Configuration | ||
| remote programs, interrupting: | Connecting | ||
| remote protocol debugging: | Debugging Output | ||
| remote protocol, binary data: | Overview | ||
| remote protocol, field separator: | Overview | ||
| remote query requests: | General Query Packets | ||
| remote serial debugging summary: | Debug Session | ||
| remote serial debugging, overview: | Remote Stub | ||
| remote serial protocol: | Overview | ||
| remote serial stub: | Stub Contents | ||
| remote serial stub list: | Remote Stub | ||
| remote serial stub, initialization: | Stub Contents | ||
| remote serial stub, main routine: | Stub Contents | ||
| remote stub, example: | Remote Stub | ||
| remote stub, support routines: | Bootstrapping | ||
| remote target: | Target Commands | ||
| remote target, file transfer: | File Transfer | ||
| remote target, limit break- and watchpoints: | Remote Configuration | ||
| remote target, limit watchpoints length: | Remote Configuration | ||
| remote timeout: | Remote Configuration | ||
| remove actions from a tracepoint: | Tracepoint Actions | ||
| remove duplicate history: | Command History | ||
| rename, file-i/o system call: | rename | ||
| Renesas: | Remote Stub | ||
| repeated array elements: | Print Settings | ||
| repeating command sequences: | Command Syntax | ||
| repeating commands: | Command Syntax | ||
| replay log events, remote reply: | Stop Reply Packets | ||
| replay mode: | Process Record and Replay | ||
| reporting bugs in GDB: | GDB Bugs | ||
| reprint the last value: | Data | ||
| reprint the last value: | Compiling and Injecting Code | ||
| reset environment, remote request: | General Query Packets | ||
| resolution of location spec: | Location Specifications | ||
| resources used by commands: | Maintenance Commands | ||
| response time, MIPS debugging: | MIPS | ||
| restart: | Checkpoint/Restart | ||
| restore data from a file: | Dump/Restore Files | ||
| restrictions on Go expressions: | Go | ||
| result records in GDB/MI: | GDB/MI Result Records | ||
| resume threads of multiple processes simultaneously: | All-Stop Mode | ||
| resuming execution: | Continuing and Stepping | ||
| returning from a function: | Returning | ||
| reverse execution: | Reverse Execution | ||
| rewind program state: | Checkpoint/Restart | ||
| run to first instruction: | Starting | ||
| run to main procedure: | Starting | ||
| run until specified location: | Continuing and Stepping | ||
| running: | Starting | ||
| running programs backward: | Reverse Execution | ||
|
|
|||
| S | |||
| ‘s’ packet: | Packets | ||
| ‘S’ packet: | Packets | ||
| S12Z support: | S12Z | ||
| save breakpoints to a file for future sessions: | Save Breakpoints | ||
| save command history: | Command History | ||
| save GDB output to a file: | Logging Output | ||
| save tracepoints for future sessions: | save tracepoints | ||
| scheduler locking mode: | All-Stop Mode | ||
| scope: | M2 Scope | ||
| screen size: | Screen Size | ||
| scripting commands: | Command Files | ||
| scripting with guile: | Guile | ||
| scripting with python: | Python | ||
| search for a thread: | Threads | ||
| search order for disassembler in Python: | Disassembly In Python | ||
search path for libthread_db: |
Threads | ||
| searching memory: | Searching Memory | ||
| searching memory, in remote debugging: | General Query Packets | ||
| searching source files: | Search | ||
| section offsets, remote request: | General Query Packets | ||
| segment descriptor tables: | DJGPP Native | ||
| select Ctrl-C, BREAK or BREAK-g: | Remote Configuration | ||
| select trace snapshot: | tfind | ||
| selected frame: | Stack | ||
| selecting guile pretty-printers: | Selecting Guile Pretty-Printers | ||
| selecting python pretty-printers: | Selecting Pretty-Printers | ||
| self tests: | Maintenance Commands | ||
| self tests: | Maintenance Commands | ||
| self tests: | Maintenance Commands | ||
| semaphores on static probe points: | Static Probe Points | ||
| send command to remote monitor: | Connecting | ||
| send command to simulator: | Embedded Processors | ||
| send interrupt-sequence on start: | Remote Configuration | ||
| send rights, GNU Hurd: | Hurd Native | ||
| send the output of a gdb command to a shell command: | Shell Commands | ||
| sending files to remote systems: | File Transfer | ||
| separate debug sections: | MiniDebugInfo | ||
| separate debugging information files: | Separate Debug Files | ||
| sequence-id, for GDB remote: | Overview | ||
| serial connections, debugging: | Debugging Output | ||
serial line, target remote: |
Connecting | ||
| serial protocol, GDB remote: | Overview | ||
| server prefix: | Server Prefix | ||
server, command prefix: |
Command History | ||
| set ABI for MIPS: | MIPS | ||
| set breakpoints in many functions: | Set Breaks | ||
| set breakpoints on all functions: | Set Breaks | ||
| set environment variable, remote request: | General Query Packets | ||
| set exec-file-mismatch: | Attach | ||
| set fast tracepoint: | Create and Delete Tracepoints | ||
| set inferior controlling terminal: | Input/Output | ||
| set static tracepoint: | Create and Delete Tracepoints | ||
| set tdesc filename: | Retrieving Descriptions | ||
| set tracepoint: | Create and Delete Tracepoints | ||
| set working directory, remote request: | General Query Packets | ||
| setting variables: | Assignment | ||
| setting watchpoints: | Set Watchpoints | ||
| settings: | Command Settings | ||
| SH: | Remote Stub | ||
| sh-stub.c: | Remote Stub | ||
| shared libraries: | Files | ||
| shared library events, remote reply: | Stop Reply Packets | ||
| shell command, exit code: | Convenience Vars | ||
| shell command, exit signal: | Convenience Vars | ||
| shell escape: | Shell Commands | ||
| show all convenience functions: | Convenience Funs | ||
| show all user variables and functions: | Convenience Vars | ||
| show exec-file-mismatch: | Attach | ||
| show inferior’s working directory: | Working Directory | ||
| show last commands: | Command History | ||
| show tdesc filename: | Retrieving Descriptions | ||
| signals: | Signals | ||
| signals the inferior may see, remote request: | General Query Packets | ||
SIGQUIT signal, dump core of GDB: |
Maintenance Commands | ||
| SingleKey keymap name: | TUI Single Key Mode | ||
| size of remote memory accesses: | Packets | ||
| size of screen: | Screen Size | ||
| skipping over files via glob-style patterns: | Skipping Over Functions and Files | ||
| skipping over functions and files: | Skipping Over Functions and Files | ||
| skipping over functions via regular expressions: | Skipping Over Functions and Files | ||
| snapshot of a process: | Checkpoint/Restart | ||
| software watchpoints: | Set Watchpoints | ||
| source code, caching: | Maintenance Commands | ||
| source code, disable access: | Disable Reading Source | ||
| source file and line of a symbol: | Print Settings | ||
| source line and its code address: | Machine Code | ||
| source location: | Location Specifications | ||
| source path: | Source Path | ||
| Sparc: | Remote Stub | ||
| sparc-stub.c: | Remote Stub | ||
| Sparc64 support: | Sparc64 | ||
| sparcl-stub.c: | Remote Stub | ||
| SparcLite: | Remote Stub | ||
| Special Fortran commands: | Special Fortran Commands | ||
| specifying location: | Location Specifications | ||
| SSE registers (x86): | Registers | ||
| stack frame: | Frames | ||
| stack on Alpha: | MIPS | ||
| stack on MIPS: | MIPS | ||
| stack pointer register: | Registers | ||
| stacking targets: | Active Targets | ||
| standard registers: | Registers | ||
| start a new independent interpreter: | Interpreters | ||
| start a new trace experiment: | Starting and Stopping Trace Experiments | ||
| starting: | Starting | ||
| startup code, and backtrace: | Backtrace | ||
| startup with shell, remote request: | General Query Packets | ||
| stat, file-i/o system call: | stat/fstat | ||
| static members of C++ objects: | Print Settings | ||
| static members of Pascal objects: | Print Settings | ||
| static probe point, DTrace: | Static Probe Points | ||
| static probe point, SystemTap: | Static Probe Points | ||
| static tracepoints: | Set Tracepoints | ||
| static tracepoints, in remote protocol: | General Query Packets | ||
| static tracepoints, setting: | Create and Delete Tracepoints | ||
| status of trace data collection: | Starting and Stopping Trace Experiments | ||
| status output in GDB/MI: | GDB/MI Output Syntax | ||
| stepping: | Continuing and Stepping | ||
| stepping and signal handlers: | Signals | ||
| stepping into functions with no line info: | Continuing and Stepping | ||
| stop a running trace experiment: | Starting and Stopping Trace Experiments | ||
| stop on C++ exceptions: | Set Catchpoints | ||
| stop reply packets: | Stop Reply Packets | ||
| stopped threads: | Thread Stops | ||
| store memory tags: | General Query Packets | ||
| stream records in GDB/MI: | GDB/MI Stream Records | ||
| string tracing, in remote protocol: | General Query Packets | ||
struct gdb_reader_funcs: |
Writing JIT Debug Info Readers | ||
struct gdb_symbol_callbacks: |
Writing JIT Debug Info Readers | ||
struct gdb_unwind_callbacks: |
Writing JIT Debug Info Readers | ||
| struct return convention: | i386 | ||
| struct stat, in file-i/o protocol: | struct stat | ||
| struct timeval, in file-i/o protocol: | struct timeval | ||
| struct/union returned in registers: | i386 | ||
| structure field name completion: | Completion | ||
| stub example, remote debugging: | Remote Stub | ||
| stupid questions: | Messages/Warnings | ||
| styling: | Output Styling | ||
| Super-H: | Super-H | ||
| supported GDB/MI features, list: | GDB/MI Support Commands | ||
| supported packets, remote query: | General Query Packets | ||
| switching threads: | Threads | ||
| switching threads automatically: | All-Stop Mode | ||
| symbol cache size: | Symbols | ||
| symbol cache, flushing: | Symbols | ||
| symbol cache, printing its contents: | Symbols | ||
| symbol cache, printing usage statistics: | Symbols | ||
| symbol decoding style, C++: | Print Settings | ||
| symbol dump: | Symbols | ||
| symbol file functions: | Debugging Output | ||
| symbol files, remote debugging: | Connecting | ||
| symbol from address: | Symbols | ||
| symbol lookup: | Debugging Output | ||
| symbol lookup, remote request: | General Query Packets | ||
| symbol names: | Symbols | ||
| symbol table: | Files | ||
| symbol table creation: | Debugging Output | ||
| symbol tables in guile: | Symbol Tables In Guile | ||
| symbol tables in python: | Symbol Tables In Python | ||
| symbol tables, listing GDB’s internal: | Symbols | ||
| symbol, source file and line: | Print Settings | ||
| symbols in guile: | Symbols In Guile | ||
| symbols in python: | Symbols In Python | ||
| symbols, never read: | Files | ||
| symbols, reading from relocatable object files: | Files | ||
| symbols, reading immediately: | Files | ||
| Synopsys ARC: | ARC | ||
syscall DSO: |
Files | ||
| system calls and thread breakpoints: | Interrupted System Calls | ||
| system root, alternate: | Files | ||
| system, file-i/o system call: | system | ||
| system-wide configuration scripts: | System-wide Configuration Scripts | ||
| system-wide init file: | System-wide configuration | ||
|
|
|||
| T | |||
| ‘t’ packet: | Packets | ||
| ‘T’ packet: | Packets | ||
| ‘T’ packet reply: | Stop Reply Packets | ||
| tail call frames, debugging: | Tail Call Frames | ||
| target architecture: | Targets | ||
| target byte order: | Byte Order | ||
| target character set: | Character Sets | ||
| target debugging info: | Debugging Output | ||
| target descriptions: | Target Descriptions | ||
| target descriptions, AArch64 features: | AArch64 Features | ||
| target descriptions, ARC Features: | ARC Features | ||
| target descriptions, ARM features: | ARM Features | ||
| target descriptions, enum types: | Enum Target Types | ||
| target descriptions, i386 features: | i386 Features | ||
| target descriptions, inclusion: | Target Description Format | ||
| target descriptions, LoongArch Features: | LoongArch Features | ||
| target descriptions, M68K features: | M68K Features | ||
| target descriptions, MicroBlaze features: | MicroBlaze Features | ||
| target descriptions, MIPS features: | MIPS Features | ||
| target descriptions, NDS32 features: | NDS32 Features | ||
| target descriptions, Nios II features: | Nios II Features | ||
| target descriptions, OpenRISC 1000 features: | OpenRISC 1000 Features | ||
| target descriptions, PowerPC features: | PowerPC Features | ||
| target descriptions, predefined types: | Predefined Target Types | ||
| target descriptions, RISC-V Features: | RISC-V Features | ||
| target descriptions, RX Features: | RX Features | ||
| target descriptions, S/390 features: | S/390 and System z Features | ||
| target descriptions, sparc32 features: | Sparc Features | ||
| target descriptions, sparc64 features: | Sparc Features | ||
| target descriptions, standard features: | Standard Target Features | ||
| target descriptions, System z features: | S/390 and System z Features | ||
| target descriptions, TIC6x features: | TIC6x Features | ||
| target descriptions, TMS320C6x features: | TIC6x Features | ||
| target descriptions, XML format: | Target Description Format | ||
| target memory comparison: | Memory | ||
| target output in GDB/MI: | GDB/MI Output Syntax | ||
| target stack description: | Maintenance Commands | ||
| target-assisted range stepping: | Continuing and Stepping | ||
| task attributes (GNU Hurd): | Hurd Native | ||
| task breakpoints, in Ada: | Ada Tasks | ||
| task exception port, GNU Hurd: | Hurd Native | ||
| task suspend count: | Hurd Native | ||
| task switching with program using Ravenscar Profile: | Ravenscar Profile | ||
TCP port, target remote: |
Connecting | ||
| temporarily change settings: | Command Settings | ||
| terminal: | Input/Output | ||
| Text User Interface: | TUI | ||
| thread attributes info, remote request: | General Query Packets | ||
| thread breakpoints: | Thread-Specific Breakpoints | ||
| thread breakpoints and system calls: | Interrupted System Calls | ||
| thread create event, remote reply: | Stop Reply Packets | ||
| thread create/exit events, remote request: | General Query Packets | ||
| thread default settings, GNU Hurd: | Hurd Native | ||
| thread exit event, remote reply: | Stop Reply Packets | ||
| thread ID lists: | Threads | ||
| thread identifier (GDB): | Threads | ||
| thread identifier (system): | Threads | ||
| thread info (Solaris): | Threads | ||
| thread information, remote request: | General Query Packets | ||
| thread list format: | Thread List Format | ||
| thread number, per inferior: | Threads | ||
| thread properties, GNU Hurd: | Hurd Native | ||
| thread suspend count, GNU Hurd: | Hurd Native | ||
| thread-id, in remote protocol: | Packets | ||
| threads and watchpoints: | Set Watchpoints | ||
| threads in python: | Threads In Python | ||
| threads of execution: | Threads | ||
| threads, automatic switching: | All-Stop Mode | ||
| threads, continuing: | Thread Stops | ||
| threads, stopped: | Thread Stops | ||
| time of command execution: | Maintenance Commands | ||
| timeout for commands: | Maintenance Commands | ||
| timeout for serial communications: | Remote Configuration | ||
| timeout, for remote target connection: | Remote Configuration | ||
| timestamping debugging info: | Debugging Output | ||
| trace experiment, status of: | Starting and Stopping Trace Experiments | ||
| trace file format: | Trace File Format | ||
| trace files: | Trace Files | ||
| trace state variable value, remote request: | Tracepoint Packets | ||
| trace state variables: | Trace State Variables | ||
| traceback: | Backtrace | ||
| traceframe info format: | Traceframe Info Format | ||
| tracepoint actions: | Tracepoint Actions | ||
| tracepoint conditions: | Tracepoint Conditions | ||
| tracepoint data, display: | tdump | ||
| tracepoint deletion: | Create and Delete Tracepoints | ||
| tracepoint number: | Create and Delete Tracepoints | ||
| tracepoint packets: | Tracepoint Packets | ||
| tracepoint pass count: | Tracepoint Passcounts | ||
| tracepoint restrictions: | Tracepoint Restrictions | ||
| tracepoint status, remote request: | Tracepoint Packets | ||
| tracepoint variables: | Tracepoint Variables | ||
| tracepoints: | Tracepoints | ||
tracepoints support in gdbserver: |
Server | ||
| trailing underscore, in Fortran symbols: | Fortran | ||
| translating between character sets: | Character Sets | ||
| TUI: | TUI | ||
| TUI commands: | TUI Commands | ||
| TUI configuration variables: | TUI Configuration | ||
| TUI key bindings: | TUI Keys | ||
| TUI mouse support: | TUI Mouse Support | ||
| TUI single key mode: | TUI Single Key Mode | ||
| type casting memory: | Expressions | ||
| type chain of a data type: | Maintenance Commands | ||
| type checking: | Checks | ||
| type conversions in C++: | C Plus Plus Expressions | ||
| type printer: | Type Printing API | ||
| type printing API for Python: | Type Printing API | ||
| types in guile: | Types In Guile | ||
| types in Python: | Types In Python | ||
|
|
|||
| U | |||
UDP port, target remote: |
Connecting | ||
| union field name completion: | Completion | ||
| unions in structures, printing: | Print Settings | ||
| Unix domain socket: | Connecting | ||
| unknown address, locating: | Output Formats | ||
| unknown type: | Symbols | ||
| unlink, file-i/o system call: | unlink | ||
| unlinked object files: | Files | ||
| unload symbols from shared libraries: | Files | ||
| unmap an overlay: | Overlay Commands | ||
| unmapped overlays: | How Overlays Work | ||
| unset environment variable, remote request: | General Query Packets | ||
| unset tdesc filename: | Retrieving Descriptions | ||
| unsupported languages: | Unsupported Languages | ||
| unwind stack in called functions: | Calling | ||
| unwind stack in called functions with unhandled exceptions: | Calling | ||
| unwinding frames in Python: | Unwinding Frames in Python | ||
| use only software watchpoints: | Set Watchpoints | ||
| user registers: | Maintenance Commands | ||
| user-defined command: | Define | ||
| user-defined macros: | Macros | ||
| user-defined variables: | Convenience Vars | ||
|
|
|||
| V | |||
| value history: | Value History | ||
| values from inferior, in guile: | Values From Inferior In Guile | ||
| values from inferior, with Python: | Values From Inferior | ||
| variable name conflict: | Variables | ||
| variable object debugging info: | Debugging Output | ||
| variable objects in GDB/MI: | GDB/MI Variable Objects | ||
| variable values, wrong: | Variables | ||
| variables, readline: | Readline Init File Syntax | ||
| variables, setting: | Assignment | ||
| ‘vAttach’ packet: | Packets | ||
| ‘vCont’ packet: | Packets | ||
| ‘vCont?’ packet: | Packets | ||
| ‘vCtrlC’ packet: | Packets | ||
| vector unit: | Vector Unit | ||
| vector, auxiliary: | OS Information | ||
| verbose operation: | Messages/Warnings | ||
| verify remote memory image: | Memory | ||
| verify target memory image: | Memory | ||
| ‘vFile’ packet: | Packets | ||
| ‘vFlashDone’ packet: | Packets | ||
| ‘vFlashErase’ packet: | Packets | ||
| ‘vFlashWrite’ packet: | Packets | ||
| vfork events, remote reply: | Stop Reply Packets | ||
| vforkdone events, remote reply: | Stop Reply Packets | ||
| virtual functions (C++) display: | Print Settings | ||
| ‘vKill’ packet: | Packets | ||
| ‘vMustReplyEmpty’ packet: | Packets | ||
| volatile registers: | Registers | ||
| ‘vRun’ packet: | Packets | ||
| ‘vStopped’ packet: | Packets | ||
| VTBL display: | Print Settings | ||
|
|
|||
| W | |||
| watchdog timer: | Maintenance Commands | ||
| watchpoints: | Breakpoints | ||
| watchpoints and threads: | Set Watchpoints | ||
| where to look for shared libraries: | Files | ||
| wild pointer, interpreting: | Print Settings | ||
| Wind River Linux system-wide configuration script: | System-wide Configuration Scripts | ||
| word completion: | Completion | ||
| working directory: | Source Path | ||
| working directory (of your program): | Working Directory | ||
| working language: | Languages | ||
| write data into object, remote request: | General Query Packets | ||
| write, file-i/o system call: | write | ||
| writing a frame filter: | Writing a Frame Filter | ||
| writing a Guile pretty-printer: | Writing a Guile Pretty-Printer | ||
| writing a pretty-printer: | Writing a Pretty-Printer | ||
| writing convenience functions: | Functions In Python | ||
| writing into corefiles: | Patching | ||
| writing into executables: | Patching | ||
| writing into executables: | Compiling and Injecting Code | ||
| writing JIT debug info readers: | Writing JIT Debug Info Readers | ||
| writing xmethods in Python: | Writing an Xmethod | ||
| wrong values: | Variables | ||
|
|
|||
| X | |||
x command, default address: |
Machine Code | ||
| ‘X’ packet: | Packets | ||
| Xilinx MicroBlaze: | MicroBlaze | ||
| XInclude: | Target Description Format | ||
| XMD, Xilinx Microprocessor Debugger: | MicroBlaze | ||
| xmethod API: | Xmethod API | ||
| xmethods in Python: | Xmethods In Python | ||
| XML parser debugging: | Debugging Output | ||
|
|
|||
| Y | |||
| yanking text: | Readline Killing Commands | ||
|
|
|||
| Z | |||
| ‘z’ packet: | Packets | ||
| ‘Z’ packets: | Packets | ||
| ‘z0’ packet: | Packets | ||
| ‘Z0’ packet: | Packets | ||
| ‘z1’ packet: | Packets | ||
| ‘Z1’ packet: | Packets | ||
| ‘z2’ packet: | Packets | ||
| ‘Z2’ packet: | Packets | ||
| ‘z3’ packet: | Packets | ||
| ‘Z3’ packet: | Packets | ||
| ‘z4’ packet: | Packets | ||
| ‘Z4’ packet: | Packets | ||
|
|
| Jump to: | ! « # $ & — . / : < ? _ { A B C D E F G H I J K L M N O P Q R S T U V W X Y Z |
|---|
Command, Variable, and Function Index
| Jump to: | ! # $ — : < @ ^ _ | A B C D E F G H I J K L M N O P Q R S T U V W X Y |
|---|
| Index Entry | Section | ||
|---|---|---|---|
|
|
|||
| ! | |||
!: |
Shell Commands | ||
|
|
|||
| # | |||
# (a comment): |
Command Syntax | ||
|
|
|||
| $ | |||
$bpnum, convenience variable: |
Set Breaks | ||
$cdir, convenience variable: |
Source Path | ||
$cwd, convenience variable: |
Source Path | ||
$tpnum: |
Create and Delete Tracepoints | ||
$tracepoint: |
Tracepoint Variables | ||
$trace_file: |
Tracepoint Variables | ||
$trace_frame: |
Tracepoint Variables | ||
$trace_func: |
Tracepoint Variables | ||
$trace_line: |
Tracepoint Variables | ||
$_, convenience variable: |
Convenience Vars | ||
$_ada_exception, convenience variable: |
Set Catchpoints | ||
$_any_caller_is, convenience function: |
Convenience Funs | ||
$_any_caller_matches, convenience function: |
Convenience Funs | ||
$_as_string, convenience function: |
Convenience Funs | ||
$_caller_is, convenience function: |
Convenience Funs | ||
$_caller_matches, convenience function: |
Convenience Funs | ||
$_cimag, convenience function: |
Convenience Funs | ||
$_creal, convenience function: |
Convenience Funs | ||
$_exception, convenience variable: |
Set Catchpoints | ||
$_exitcode, convenience variable: |
Convenience Vars | ||
$_exitsignal, convenience variable: |
Convenience Vars | ||
$_gdb_maint_setting, convenience function: |
Convenience Funs | ||
$_gdb_maint_setting_str, convenience function: |
Convenience Funs | ||
$_gdb_major, convenience variable: |
Convenience Vars | ||
$_gdb_minor, convenience variable: |
Convenience Vars | ||
$_gdb_setting, convenience function: |
Convenience Funs | ||
$_gdb_setting_str, convenience function: |
Convenience Funs | ||
$_gthread, convenience variable: |
Threads | ||
$_hit_bpnum, convenience variable: |
Set Breaks | ||
$_hit_locno, convenience variable: |
Set Breaks | ||
$_inferior, convenience variable: |
Inferiors Connections and Programs | ||
$_isvoid, convenience function: |
Convenience Funs | ||
$_memeq, convenience function: |
Convenience Funs | ||
$_probe_arg, convenience variable: |
Static Probe Points | ||
$_regex, convenience function: |
Convenience Funs | ||
$_sdata, collect: |
Tracepoint Actions | ||
$_sdata, inspect, convenience variable: |
Convenience Vars | ||
$_shell_exitcode, convenience variable: |
Convenience Vars | ||
$_shell_exitsignal, convenience variable: |
Convenience Vars | ||
$_siginfo, convenience variable: |
Convenience Vars | ||
$_streq, convenience function: |
Convenience Funs | ||
$_strlen, convenience function: |
Convenience Funs | ||
$_thread, convenience variable: |
Threads | ||
$_tlb, convenience variable: |
Convenience Vars | ||
$__, convenience variable: |
Convenience Vars | ||
|
|
|||
| — | |||
-ada-task-info: |
GDB/MI Ada Tasking Commands | ||
-add-inferior: |
GDB/MI Miscellaneous Commands | ||
-break-after: |
GDB/MI Breakpoint Commands | ||
-break-commands: |
GDB/MI Breakpoint Commands | ||
-break-condition: |
GDB/MI Breakpoint Commands | ||
-break-delete: |
GDB/MI Breakpoint Commands | ||
-break-disable: |
GDB/MI Breakpoint Commands | ||
-break-enable: |
GDB/MI Breakpoint Commands | ||
-break-info: |
GDB/MI Breakpoint Commands | ||
-break-insert: |
GDB/MI Breakpoint Commands | ||
-break-list: |
GDB/MI Breakpoint Commands | ||
-break-passcount: |
GDB/MI Breakpoint Commands | ||
-break-watch: |
GDB/MI Breakpoint Commands | ||
-catch-assert: |
Ada Exception GDB/MI Catchpoint Commands | ||
-catch-catch: |
C++ Exception GDB/MI Catchpoint Commands | ||
-catch-exception: |
Ada Exception GDB/MI Catchpoint Commands | ||
-catch-handlers: |
Ada Exception GDB/MI Catchpoint Commands | ||
-catch-load: |
Shared Library GDB/MI Catchpoint Commands | ||
-catch-rethrow: |
C++ Exception GDB/MI Catchpoint Commands | ||
-catch-throw: |
C++ Exception GDB/MI Catchpoint Commands | ||
-catch-unload: |
Shared Library GDB/MI Catchpoint Commands | ||
-complete: |
GDB/MI Miscellaneous Commands | ||
-data-disassemble: |
GDB/MI Data Manipulation | ||
-data-evaluate-expression: |
GDB/MI Data Manipulation | ||
-data-list-changed-registers: |
GDB/MI Data Manipulation | ||
-data-list-register-names: |
GDB/MI Data Manipulation | ||
-data-list-register-values: |
GDB/MI Data Manipulation | ||
-data-read-memory: |
GDB/MI Data Manipulation | ||
-data-read-memory-bytes: |
GDB/MI Data Manipulation | ||
-data-write-memory-bytes: |
GDB/MI Data Manipulation | ||
-dprintf-insert: |
GDB/MI Breakpoint Commands | ||
-enable-frame-filters: |
GDB/MI Stack Manipulation | ||
-enable-pretty-printing: |
GDB/MI Variable Objects | ||
-enable-timings: |
GDB/MI Miscellaneous Commands | ||
-environment-cd: |
GDB/MI Program Context | ||
-environment-directory: |
GDB/MI Program Context | ||
-environment-path: |
GDB/MI Program Context | ||
-environment-pwd: |
GDB/MI Program Context | ||
-exec-arguments: |
GDB/MI Program Context | ||
-exec-continue: |
GDB/MI Program Execution | ||
-exec-finish: |
GDB/MI Program Execution | ||
-exec-interrupt: |
GDB/MI Program Execution | ||
-exec-jump: |
GDB/MI Program Execution | ||
-exec-next: |
GDB/MI Program Execution | ||
-exec-next-instruction: |
GDB/MI Program Execution | ||
-exec-return: |
GDB/MI Program Execution | ||
-exec-run: |
GDB/MI Program Execution | ||
-exec-step: |
GDB/MI Program Execution | ||
-exec-step-instruction: |
GDB/MI Program Execution | ||
-exec-until: |
GDB/MI Program Execution | ||
-file-exec-and-symbols: |
GDB/MI File Commands | ||
-file-exec-file: |
GDB/MI File Commands | ||
-file-list-exec-source-file: |
GDB/MI File Commands | ||
-file-list-exec-source-files: |
GDB/MI File Commands | ||
-file-list-shared-libraries: |
GDB/MI File Commands | ||
-file-symbol-file: |
GDB/MI File Commands | ||
-gdb-exit: |
GDB/MI Miscellaneous Commands | ||
-gdb-set: |
GDB/MI Miscellaneous Commands | ||
-gdb-show: |
GDB/MI Miscellaneous Commands | ||
-gdb-version: |
GDB/MI Miscellaneous Commands | ||
-inferior-tty-set: |
GDB/MI Miscellaneous Commands | ||
-inferior-tty-show: |
GDB/MI Miscellaneous Commands | ||
-info-ada-exceptions: |
GDB/MI Ada Exceptions Commands | ||
-info-gdb-mi-command: |
GDB/MI Support Commands | ||
-info-os: |
GDB/MI Miscellaneous Commands | ||
-interpreter-exec: |
GDB/MI Miscellaneous Commands | ||
-list-features: |
GDB/MI Support Commands | ||
-list-target-features: |
GDB/MI Support Commands | ||
-list-thread-groups: |
GDB/MI Miscellaneous Commands | ||
-stack-info-depth: |
GDB/MI Stack Manipulation | ||
-stack-info-frame: |
GDB/MI Stack Manipulation | ||
-stack-list-arguments: |
GDB/MI Stack Manipulation | ||
-stack-list-frames: |
GDB/MI Stack Manipulation | ||
-stack-list-locals: |
GDB/MI Stack Manipulation | ||
-stack-list-variables: |
GDB/MI Stack Manipulation | ||
-stack-select-frame: |
GDB/MI Stack Manipulation | ||
-symbol-info-functions: |
GDB/MI Symbol Query | ||
-symbol-info-module-functions: |
GDB/MI Symbol Query | ||
-symbol-info-module-variables: |
GDB/MI Symbol Query | ||
-symbol-info-modules: |
GDB/MI Symbol Query | ||
-symbol-info-types: |
GDB/MI Symbol Query | ||
-symbol-info-variables: |
GDB/MI Symbol Query | ||
-symbol-list-lines: |
GDB/MI Symbol Query | ||
-target-attach: |
GDB/MI Target Manipulation | ||
-target-detach: |
GDB/MI Target Manipulation | ||
-target-disconnect: |
GDB/MI Target Manipulation | ||
-target-download: |
GDB/MI Target Manipulation | ||
-target-file-delete: |
GDB/MI File Transfer Commands | ||
-target-file-get: |
GDB/MI File Transfer Commands | ||
-target-file-put: |
GDB/MI File Transfer Commands | ||
-target-flash-erase: |
GDB/MI Target Manipulation | ||
-target-select: |
GDB/MI Target Manipulation | ||
-thread-info: |
GDB/MI Thread Commands | ||
-thread-list-ids: |
GDB/MI Thread Commands | ||
-thread-select: |
GDB/MI Thread Commands | ||
-trace-define-variable: |
GDB/MI Tracepoint Commands | ||
-trace-find: |
GDB/MI Tracepoint Commands | ||
-trace-frame-collected: |
GDB/MI Tracepoint Commands | ||
-trace-list-variables: |
GDB/MI Tracepoint Commands | ||
-trace-save: |
GDB/MI Tracepoint Commands | ||
-trace-start: |
GDB/MI Tracepoint Commands | ||
-trace-status: |
GDB/MI Tracepoint Commands | ||
-trace-stop: |
GDB/MI Tracepoint Commands | ||
-var-assign: |
GDB/MI Variable Objects | ||
-var-create: |
GDB/MI Variable Objects | ||
-var-delete: |
GDB/MI Variable Objects | ||
-var-evaluate-expression: |
GDB/MI Variable Objects | ||
-var-info-expression: |
GDB/MI Variable Objects | ||
-var-info-num-children: |
GDB/MI Variable Objects | ||
-var-info-path-expression: |
GDB/MI Variable Objects | ||
-var-info-type: |
GDB/MI Variable Objects | ||
-var-list-children: |
GDB/MI Variable Objects | ||
-var-set-format: |
GDB/MI Variable Objects | ||
-var-set-frozen: |
GDB/MI Variable Objects | ||
-var-set-update-range: |
GDB/MI Variable Objects | ||
-var-set-visualizer: |
GDB/MI Variable Objects | ||
-var-show-attributes: |
GDB/MI Variable Objects | ||
-var-show-format: |
GDB/MI Variable Objects | ||
-var-update: |
GDB/MI Variable Objects | ||
|
|
|||
| : | |||
::, in Modula-2: |
M2 Scope | ||
|
|
|||
| < | |||
<gdb:arch>: |
Architectures In Guile | ||
<gdb:block>: |
Blocks In Guile | ||
<gdb:breakpoint>: |
Breakpoints In Guile | ||
<gdb:iterator>: |
Iterators In Guile | ||
<gdb:lazy-string>: |
Lazy Strings In Guile | ||
<gdb:objfile>: |
Objfiles In Guile | ||
<gdb:progspace>: |
Progspaces In Guile | ||
<gdb:sal>: |
Symbol Tables In Guile | ||
<gdb:symbol>: |
Symbols In Guile | ||
<gdb:symtab>: |
Symbol Tables In Guile | ||
<gdb:type>: |
Types In Guile | ||
|
Values From Inferior In Guile | ||
|
|
|||
| @ | |||
@, referencing memory as an array: |
Arrays | ||
|
|
|||
| ^ | |||
^connected: |
GDB/MI Result Records | ||
^done: |
GDB/MI Result Records | ||
^error: |
GDB/MI Result Records | ||
^exit: |
GDB/MI Result Records | ||
^running: |
GDB/MI Result Records | ||
|
|
|||
| _ | |||
__init__ on TypePrinter: |
gdb.types | ||
|
|
|||
| | | |||
|: |
Shell Commands | ||
|
|
|||
| A | |||
abort (C-g): |
Miscellaneous Commands | ||
accept-line (Newline or Return): |
Commands For History | ||
actions: |
Tracepoint Actions | ||
ada-task-info: |
GDB/MI Support Commands | ||
add-auto-load-safe-path: |
Auto-loading safe path | ||
add-auto-load-scripts-directory: |
objfile-gdbdotext file | ||
add-inferior: |
Inferiors Connections and Programs | ||
add-symbol-file: |
Files | ||
add-symbol-file-from-memory: |
Files | ||
adi assign: |
Sparc64 | ||
adi examine: |
Sparc64 | ||
advance locspec: |
Continuing and Stepping | ||
alias: |
Aliases | ||
append: |
Dump/Restore Files | ||
append-pretty-printer!: |
Guile Printing Module | ||
apropos: |
Help | ||
arch-bool-type: |
Architectures In Guile | ||
arch-char-type: |
Architectures In Guile | ||
arch-charset: |
Architectures In Guile | ||
arch-disassemble: |
Disassembly In Guile | ||
arch-double-type: |
Architectures In Guile | ||
arch-float-type: |
Architectures In Guile | ||
arch-int-type: |
Architectures In Guile | ||
arch-int16-type: |
Architectures In Guile | ||
arch-int32-type: |
Architectures In Guile | ||
arch-int64-type: |
Architectures In Guile | ||
arch-int8-type: |
Architectures In Guile | ||
arch-long-type: |
Architectures In Guile | ||
arch-longdouble-type: |
Architectures In Guile | ||
arch-longlong-type: |
Architectures In Guile | ||
arch-name: |
Architectures In Guile | ||
arch-schar-type: |
Architectures In Guile | ||
arch-short-type: |
Architectures In Guile | ||
arch-uchar-type: |
Architectures In Guile | ||
arch-uint-type: |
Architectures In Guile | ||
arch-uint16-type: |
Architectures In Guile | ||
arch-uint32-type: |
Architectures In Guile | ||
arch-uint64-type: |
Architectures In Guile | ||
arch-uint8-type: |
Architectures In Guile | ||
arch-ulong-type: |
Architectures In Guile | ||
arch-ulonglong-type: |
Architectures In Guile | ||
arch-ushort-type: |
Architectures In Guile | ||
arch-void-type: |
Architectures In Guile | ||
arch-wide-charset: |
Architectures In Guile | ||
arch?: |
Architectures In Guile | ||
Architecture.disassemble: |
Architectures In Python | ||
Architecture.integer_type: |
Architectures In Python | ||
Architecture.integer_type: |
Architectures In Python | ||
Architecture.name: |
Architectures In Python | ||
Architecture.registers: |
Architectures In Python | ||
Architecture.register_groups: |
Architectures In Python | ||
attach: |
Attach | ||
attach&: |
Background Execution | ||
awatch: |
Set Watchpoints | ||
|
|
|||
| B | |||
b (: |
Set Breaks | ||
backtrace: |
Backtrace | ||
backward-char (C-b): |
Commands For Moving | ||
backward-delete-char (Rubout): |
Commands For Text | ||
backward-kill-line (C-x Rubout): |
Commands For Killing | ||
backward-kill-word (M-DEL): |
Commands For Killing | ||
backward-word (M-b): |
Commands For Moving | ||
beginning-of-history (M-<): |
Commands For History | ||
beginning-of-line (C-a): |
Commands For Moving | ||
bell-style: |
Readline Init File Syntax | ||
bfd caching: |
File Caching | ||
bfd caching: |
File Caching | ||
bfd caching: |
File Caching | ||
bind-tty-special-chars: |
Readline Init File Syntax | ||
blink-matching-paren: |
Readline Init File Syntax | ||
block-end: |
Blocks In Guile | ||
block-function: |
Blocks In Guile | ||
block-global-block: |
Blocks In Guile | ||
block-global?: |
Blocks In Guile | ||
block-start: |
Blocks In Guile | ||
block-static-block: |
Blocks In Guile | ||
block-static?: |
Blocks In Guile | ||
block-superblock: |
Blocks In Guile | ||
block-symbols: |
Blocks In Guile | ||
block-symbols-progress?: |
Blocks In Guile | ||
block-valid?: |
Blocks In Guile | ||
Block.end: |
Blocks In Python | ||
Block.function: |
Blocks In Python | ||
Block.global_block: |
Blocks In Python | ||
Block.is_global: |
Blocks In Python | ||
Block.is_static: |
Blocks In Python | ||
Block.is_valid: |
Blocks In Python | ||
Block.start: |
Blocks In Python | ||
Block.static_block: |
Blocks In Python | ||
Block.superblock: |
Blocks In Python | ||
block?: |
Blocks In Guile | ||
BP_ACCESS_WATCHPOINT: |
Breakpoints In Python | ||
BP_ACCESS_WATCHPOINT: |
Breakpoints In Guile | ||
BP_BREAKPOINT: |
Breakpoints In Python | ||
BP_BREAKPOINT: |
Breakpoints In Guile | ||
BP_CATCHPOINT: |
Breakpoints In Python | ||
BP_CATCHPOINT: |
Breakpoints In Guile | ||
BP_HARDWARE_BREAKPOINT: |
Breakpoints In Python | ||
BP_HARDWARE_WATCHPOINT: |
Breakpoints In Python | ||
BP_HARDWARE_WATCHPOINT: |
Breakpoints In Guile | ||
BP_READ_WATCHPOINT: |
Breakpoints In Python | ||
BP_READ_WATCHPOINT: |
Breakpoints In Guile | ||
BP_WATCHPOINT: |
Breakpoints In Python | ||
BP_WATCHPOINT: |
Breakpoints In Guile | ||
bracketed-paste-begin (): |
Commands For Text | ||
break: |
Set Breaks | ||
break … task taskno (Ada): |
Ada Tasks | ||
break … thread thread-id: |
Thread-Specific Breakpoints | ||
break, and Objective-C: |
Method Names in Commands | ||
break-range: |
PowerPC Embedded | ||
breakpoint annotation: |
Annotations for Running | ||
breakpoint-commands: |
Breakpoints In Guile | ||
breakpoint-condition: |
Breakpoints In Guile | ||
breakpoint-enabled?: |
Breakpoints In Guile | ||
breakpoint-expression: |
Breakpoints In Guile | ||
breakpoint-hit-count: |
Breakpoints In Guile | ||
breakpoint-ignore-count: |
Breakpoints In Guile | ||
breakpoint-location: |
Breakpoints In Guile | ||
breakpoint-notifications: |
GDB/MI Support Commands | ||
breakpoint-number: |
Breakpoints In Guile | ||
breakpoint-silent?: |
Breakpoints In Guile | ||
breakpoint-stop: |
Breakpoints In Guile | ||
breakpoint-task: |
Breakpoints In Guile | ||
breakpoint-temporary?: |
Breakpoints In Guile | ||
breakpoint-thread: |
Breakpoints In Guile | ||
breakpoint-type: |
Breakpoints In Guile | ||
breakpoint-valid?: |
Breakpoints In Guile | ||
breakpoint-visible?: |
Breakpoints In Guile | ||
Breakpoint.commands: |
Breakpoints In Python | ||
Breakpoint.condition: |
Breakpoints In Python | ||
Breakpoint.delete: |
Breakpoints In Python | ||
Breakpoint.enabled: |
Breakpoints In Python | ||
Breakpoint.expression: |
Breakpoints In Python | ||
Breakpoint.hit_count: |
Breakpoints In Python | ||
Breakpoint.ignore_count: |
Breakpoints In Python | ||
Breakpoint.is_valid: |
Breakpoints In Python | ||
Breakpoint.location: |
Breakpoints In Python | ||
Breakpoint.locations: |
Breakpoints In Python | ||
Breakpoint.number: |
Breakpoints In Python | ||
Breakpoint.pending: |
Breakpoints In Python | ||
Breakpoint.silent: |
Breakpoints In Python | ||
Breakpoint.stop: |
Breakpoints In Python | ||
Breakpoint.task: |
Breakpoints In Python | ||
Breakpoint.temporary: |
Breakpoints In Python | ||
Breakpoint.thread: |
Breakpoints In Python | ||
Breakpoint.type: |
Breakpoints In Python | ||
Breakpoint.visible: |
Breakpoints In Python | ||
Breakpoint.__init__: |
Breakpoints In Python | ||
Breakpoint.__init__: |
Breakpoints In Python | ||
breakpoint?: |
Breakpoints In Guile | ||
BreakpointEvent.breakpoint: |
Events In Python | ||
BreakpointEvent.breakpoints: |
Events In Python | ||
BreakpointLocation.address: |
Breakpoints In Python | ||
BreakpointLocation.enabled: |
Breakpoints In Python | ||
BreakpointLocation.fullname: |
Breakpoints In Python | ||
BreakpointLocation.function: |
Breakpoints In Python | ||
BreakpointLocation.owner: |
Breakpoints In Python | ||
BreakpointLocation.source: |
Breakpoints In Python | ||
BreakpointLocation.thread_groups: |
Breakpoints In Python | ||
breakpoints: |
Breakpoints In Guile | ||
breakpoints-invalid annotation: |
Invalidation | ||
bt (: |
Backtrace | ||
builtin_disassemble: |
Disassembly In Python | ||
|
|
|||
| C | |||
c (: |
Continuing and Stepping | ||
c (SingleKey TUI key): |
TUI Single Key Mode | ||
C-L: |
TUI Keys | ||
C-x 1: |
TUI Keys | ||
C-x 2: |
TUI Keys | ||
C-x a: |
TUI Keys | ||
C-x A: |
TUI Keys | ||
C-x C-a: |
TUI Keys | ||
C-x o: |
TUI Keys | ||
C-x s: |
TUI Keys | ||
call: |
Calling | ||
call-last-kbd-macro (C-x e): |
Keyboard Macros | ||
capitalize-word (M-c): |
Commands For Text | ||
catch: |
Set Catchpoints | ||
catch assert: |
Set Catchpoints | ||
catch catch: |
Set Catchpoints | ||
catch exception: |
Set Catchpoints | ||
catch exception unhandled: |
Set Catchpoints | ||
catch exec: |
Set Catchpoints | ||
catch fork: |
Set Catchpoints | ||
catch handlers: |
Set Catchpoints | ||
catch load: |
Set Catchpoints | ||
catch rethrow: |
Set Catchpoints | ||
catch signal: |
Set Catchpoints | ||
catch syscall: |
Set Catchpoints | ||
catch throw: |
Set Catchpoints | ||
catch unload: |
Set Catchpoints | ||
catch vfork: |
Set Catchpoints | ||
cd: |
Working Directory | ||
cdir: |
Source Path | ||
character-search (C-]): |
Miscellaneous Commands | ||
character-search-backward (M-C-]): |
Miscellaneous Commands | ||
checkpoint: |
Checkpoint/Restart | ||
clear: |
Delete Breaks | ||
clear, and Objective-C: |
Method Names in Commands | ||
clear-display (M-C-l): |
Commands For Moving | ||
clear-screen (C-l): |
Commands For Moving | ||
ClearObjFilesEvent.progspace: |
Events In Python | ||
clone-inferior: |
Inferiors Connections and Programs | ||
collect (tracepoints): |
Tracepoint Actions | ||
colored-completion-prefix: |
Readline Init File Syntax | ||
colored-stats: |
Readline Init File Syntax | ||
Command.complete: |
CLI Commands In Python | ||
Command.dont_repeat: |
CLI Commands In Python | ||
Command.invoke: |
CLI Commands In Python | ||
Command.__init__: |
CLI Commands In Python | ||
command?: |
Commands In Guile | ||
commands: |
Break Commands | ||
commands annotation: |
Prompting | ||
COMMAND_BREAKPOINTS: |
CLI Commands In Python | ||
COMMAND_BREAKPOINTS: |
Commands In Guile | ||
COMMAND_DATA: |
CLI Commands In Python | ||
COMMAND_DATA: |
Commands In Guile | ||
COMMAND_FILES: |
CLI Commands In Python | ||
COMMAND_FILES: |
Commands In Guile | ||
COMMAND_MAINTENANCE: |
CLI Commands In Python | ||
COMMAND_MAINTENANCE: |
Commands In Guile | ||
COMMAND_NONE: |
CLI Commands In Python | ||
COMMAND_NONE: |
Commands In Guile | ||
COMMAND_OBSCURE: |
CLI Commands In Python | ||
COMMAND_OBSCURE: |
Commands In Guile | ||
COMMAND_RUNNING: |
CLI Commands In Python | ||
COMMAND_RUNNING: |
Commands In Guile | ||
COMMAND_STACK: |
CLI Commands In Python | ||
COMMAND_STACK: |
Commands In Guile | ||
COMMAND_STATUS: |
CLI Commands In Python | ||
COMMAND_STATUS: |
Commands In Guile | ||
COMMAND_SUPPORT: |
CLI Commands In Python | ||
COMMAND_SUPPORT: |
Commands In Guile | ||
COMMAND_TRACEPOINTS: |
CLI Commands In Python | ||
COMMAND_TRACEPOINTS: |
Commands In Guile | ||
COMMAND_TUI: |
CLI Commands In Python | ||
COMMAND_USER: |
CLI Commands In Python | ||
COMMAND_USER: |
Commands In Guile | ||
comment-begin: |
Readline Init File Syntax | ||
compare-sections: |
Memory | ||
compile code: |
Compiling and Injecting Code | ||
compile file: |
Compiling and Injecting Code | ||
complete: |
Help | ||
complete (TAB): |
Commands For Completion | ||
COMPLETE_COMMAND: |
CLI Commands In Python | ||
COMPLETE_COMMAND: |
Commands In Guile | ||
COMPLETE_EXPRESSION: |
CLI Commands In Python | ||
COMPLETE_EXPRESSION: |
Commands In Guile | ||
COMPLETE_FILENAME: |
CLI Commands In Python | ||
COMPLETE_FILENAME: |
Commands In Guile | ||
COMPLETE_LOCATION: |
CLI Commands In Python | ||
COMPLETE_LOCATION: |
Commands In Guile | ||
COMPLETE_NONE: |
CLI Commands In Python | ||
COMPLETE_NONE: |
Commands In Guile | ||
COMPLETE_SYMBOL: |
CLI Commands In Python | ||
COMPLETE_SYMBOL: |
Commands In Guile | ||
completion-display-width: |
Readline Init File Syntax | ||
completion-ignore-case: |
Readline Init File Syntax | ||
completion-map-case: |
Readline Init File Syntax | ||
completion-prefix-display-length: |
Readline Init File Syntax | ||
completion-query-items: |
Readline Init File Syntax | ||
condition: |
Conditions | ||
ConnectionEvent.connection: |
Events In Python | ||
continue: |
Continuing and Stepping | ||
continue&: |
Background Execution | ||
convert-meta: |
Readline Init File Syntax | ||
copy-backward-word (): |
Commands For Killing | ||
copy-forward-word (): |
Commands For Killing | ||
copy-region-as-kill (): |
Commands For Killing | ||
core-file: |
Files | ||
ctf: |
Trace Files | ||
Ctrl-o (operate-and-get-next): |
Command Syntax | ||
current-arch: |
Architectures In Guile | ||
current-objfile: |
Objfiles In Guile | ||
current-progspace: |
Progspaces In Guile | ||
cwd: |
Source Path | ||
|
|
|||
| D | |||
d (: |
Delete Breaks | ||
d (SingleKey TUI key): |
TUI Single Key Mode | ||
data-directory: |
Guile Configuration | ||
data-disassemble-a-option: |
GDB/MI Support Commands | ||
data-read-memory-bytes: |
GDB/MI Support Commands | ||
default-visualizer: |
Guile Pretty Printing API | ||
define: |
Define | ||
define-prefix: |
Define | ||
delete: |
Delete Breaks | ||
delete checkpoint checkpoint-id: |
Checkpoint/Restart | ||
delete display: |
Auto Display | ||
delete mem: |
Memory Region Attributes | ||
delete tracepoint: |
Create and Delete Tracepoints | ||
delete tvariable: |
Trace State Variables | ||
delete-breakpoint!: |
Breakpoints In Guile | ||
delete-char (C-d): |
Commands For Text | ||
delete-char-or-list (): |
Commands For Completion | ||
delete-horizontal-space (): |
Commands For Killing | ||
demangle: |
Symbols | ||
detach: |
Attach | ||
detach (remote): |
Connecting | ||
detach inferiors infno…: |
Inferiors Connections and Programs | ||
digit-argument (M-0, M-1, … M--): |
Numeric Arguments | ||
dir: |
Source Path | ||
directory: |
Source Path | ||
dis (: |
Disabling | ||
disable: |
Disabling | ||
disable display: |
Auto Display | ||
disable frame-filter: |
Frame Filter Management | ||
disable mem: |
Memory Region Attributes | ||
disable pretty-printer: |
Pretty-Printer Commands | ||
disable probes: |
Static Probe Points | ||
disable tracepoint: |
Enable and Disable Tracepoints | ||
disable type-printer: |
Symbols | ||
disable-completion: |
Readline Init File Syntax | ||
disassemble: |
Machine Code | ||
DisassembleInfo.address: |
Disassembly In Python | ||
DisassembleInfo.architecture: |
Disassembly In Python | ||
DisassembleInfo.is_valid: |
Disassembly In Python | ||
DisassembleInfo.progspace: |
Disassembly In Python | ||
DisassembleInfo.read_memory: |
Disassembly In Python | ||
DisassembleInfo.__init__: |
Disassembly In Python | ||
Disassembler: |
Disassembly In Python | ||
Disassembler.__call__: |
Disassembly In Python | ||
Disassembler.__init__: |
Disassembly In Python | ||
DisassemblerResult: |
Disassembly In Python | ||
DisassemblerResult.length: |
Disassembly In Python | ||
DisassemblerResult.string: |
Disassembly In Python | ||
DisassemblerResult.__init__: |
Disassembly In Python | ||
disconnect: |
Connecting | ||
display: |
Auto Display | ||
do (: |
Selection | ||
do-lowercase-version (M-A, M-B, M-x, …): |
Miscellaneous Commands | ||
document: |
Define | ||
dont-repeat: |
Commands In Guile | ||
dont-repeat: |
Define | ||
down: |
Selection | ||
Down: |
TUI Keys | ||
down-silently: |
Selection | ||
downcase-word (M-l): |
Commands For Text | ||
dprintf: |
Dynamic Printf | ||
dprintf-style agent: |
Dynamic Printf | ||
dprintf-style call: |
Dynamic Printf | ||
dprintf-style gdb: |
Dynamic Printf | ||
dump: |
Dump/Restore Files | ||
dump-functions (): |
Miscellaneous Commands | ||
dump-macros (): |
Miscellaneous Commands | ||
dump-variables (): |
Miscellaneous Commands | ||
|
|
|||
| E | |||
e (: |
Edit | ||
echo: |
Output | ||
echo-control-characters: |
Readline Init File Syntax | ||
edit: |
Edit | ||
editing-mode: |
Readline Init File Syntax | ||
else: |
Command Files | ||
emacs-editing-mode (C-e): |
Miscellaneous Commands | ||
emacs-mode-string: |
Readline Init File Syntax | ||
enable: |
Disabling | ||
enable display: |
Auto Display | ||
enable frame-filter: |
Frame Filter Management | ||
enable mem: |
Memory Region Attributes | ||
enable pretty-printer: |
Pretty-Printer Commands | ||
enable probes: |
Static Probe Points | ||
enable tracepoint: |
Enable and Disable Tracepoints | ||
enable type-printer: |
Symbols | ||
enable-bracketed-paste: |
Readline Init File Syntax | ||
enable-keypad: |
Readline Init File Syntax | ||
enabled: |
Xmethod API | ||
enabled of type_printer: |
Type Printing API | ||
end (breakpoint commands): |
Break Commands | ||
end (if/else/while commands): |
Command Files | ||
end (user-defined commands): |
Define | ||
end-kbd-macro (C-x )): |
Keyboard Macros | ||
end-of-file (usually C-d): |
Commands For Text | ||
end-of-history (M->): |
Commands For History | ||
end-of-iteration: |
Iterators In Guile | ||
end-of-iteration?: |
Iterators In Guile | ||
end-of-line (C-e): |
Commands For Moving | ||
error annotation: |
Errors | ||
error-begin annotation: |
Errors | ||
error-port: |
I/O Ports in Guile | ||
eval: |
Output | ||
EventRegistry.connect: |
Events In Python | ||
EventRegistry.disconnect: |
Events In Python | ||
exception-args: |
Guile Exception Handling | ||
exception-key: |
Guile Exception Handling | ||
exception?: |
Guile Exception Handling | ||
exceptionHandler: |
Bootstrapping | ||
exchange-point-and-mark (C-x C-x): |
Miscellaneous Commands | ||
exec-file: |
Files | ||
exec-file-mismatch: |
Attach | ||
exec-run-start-option: |
GDB/MI Support Commands | ||
execute: |
Basic Guile | ||
exit [expression]: |
Quitting GDB | ||
exited annotation: |
Annotations for Running | ||
ExitedEvent.exit_code: |
Events In Python | ||
ExitedEvent.inferior: |
Events In Python | ||
expand-tilde: |
Readline Init File Syntax | ||
explore: |
Data | ||
|
|
|||
| F | |||
f (: |
Selection | ||
f (SingleKey TUI key): |
TUI Single Key Mode | ||
faas: |
Frame Apply | ||
fg (resume foreground execution): |
Continuing and Stepping | ||
field-artificial?: |
Types In Guile | ||
field-base-class?: |
Types In Guile | ||
field-bitpos: |
Types In Guile | ||
field-bitsize: |
Types In Guile | ||
field-enumval: |
Types In Guile | ||
field-name: |
Types In Guile | ||
field-type: |
Types In Guile | ||
field?: |
Types In Guile | ||
file: |
Files | ||
fin (: |
Continuing and Stepping | ||
find: |
Searching Memory | ||
find-pc-line: |
Symbol Tables In Guile | ||
finish: |
Continuing and Stepping | ||
finish&: |
Background Execution | ||
FinishBreakpoint.out_of_scope: |
Finish Breakpoints in Python | ||
FinishBreakpoint.return_value: |
Finish Breakpoints in Python | ||
FinishBreakpoint.__init__: |
Finish Breakpoints in Python | ||
flash-erase: |
Target Commands | ||
flushregs: |
Maintenance Commands | ||
flush_i_cache: |
Bootstrapping | ||
fo (: |
Search | ||
focus: |
TUI Commands | ||
forward-backward-delete-char (): |
Commands For Text | ||
forward-char (C-f): |
Commands For Moving | ||
forward-search: |
Search | ||
forward-search-history (C-s): |
Commands For History | ||
forward-word (M-f): |
Commands For Moving | ||
frame address: |
Selection | ||
frame apply: |
Frame Apply | ||
frame function: |
Selection | ||
frame level: |
Selection | ||
frame view: |
Selection | ||
frame, selecting: |
Selection | ||
frame-arch: |
Frames In Guile | ||
frame-block: |
Frames In Guile | ||
frame-function: |
Frames In Guile | ||
frame-name: |
Frames In Guile | ||
frame-newer: |
Frames In Guile | ||
frame-older: |
Frames In Guile | ||
frame-pc: |
Frames In Guile | ||
frame-read-register: |
Frames In Guile | ||
frame-read-var: |
Frames In Guile | ||
frame-sal: |
Frames In Guile | ||
frame-select: |
Frames In Guile | ||
frame-type: |
Frames In Guile | ||
frame-unwind-stop-reason: |
Frames In Guile | ||
frame-valid?: |
Frames In Guile | ||
Frame.architecture: |
Frames In Python | ||
Frame.block: |
Frames In Python | ||
Frame.find_sal: |
Frames In Python | ||
Frame.function: |
Frames In Python | ||
Frame.is_valid: |
Frames In Python | ||
Frame.language: |
Frames In Python | ||
Frame.level: |
Frames In Python | ||
Frame.name: |
Frames In Python | ||
Frame.newer: |
Frames In Python | ||
Frame.older: |
Frames In Python | ||
Frame.pc: |
Frames In Python | ||
Frame.read_register: |
Frames In Python | ||
Frame.read_var: |
Frames In Python | ||
Frame.select: |
Frames In Python | ||
Frame.type: |
Frames In Python | ||
Frame.unwind_stop_reason: |
Frames In Python | ||
frame?: |
Frames In Guile | ||
FrameDecorator.address: |
Frame Decorator API | ||
FrameDecorator.elided: |
Frame Decorator API | ||
FrameDecorator.filename: |
Frame Decorator API | ||
FrameDecorator.frame_args: |
Frame Decorator API | ||
FrameDecorator.frame_locals: |
Frame Decorator API | ||
FrameDecorator.function: |
Frame Decorator API | ||
FrameDecorator.inferior_frame: |
Frame Decorator API | ||
FrameDecorator.line: |
Frame Decorator API | ||
FrameFilter.enabled: |
Frame Filter API | ||
FrameFilter.filter: |
Frame Filter API | ||
FrameFilter.name: |
Frame Filter API | ||
FrameFilter.priority: |
Frame Filter API | ||
frames-invalid annotation: |
Invalidation | ||
frozen-varobjs: |
GDB/MI Support Commands | ||
ftrace: |
Create and Delete Tracepoints | ||
Function: |
Functions In Python | ||
Function.invoke: |
Functions In Python | ||
Function.__init__: |
Functions In Python | ||
|
|
|||
| G | |||
gcore: |
Core File Generation | ||
gdb-object-kind: |
GDB Scheme Data Types | ||
gdb-version: |
Guile Configuration | ||
gdb.add_history: |
Basic Python | ||
gdb.architecture_names: |
Basic Python | ||
gdb.Block: |
Blocks In Python | ||
gdb.block_for_pc: |
Blocks In Python | ||
gdb.block_for_pc: |
Blocks In Python | ||
gdb.BP_ACCESS_WATCHPOINT: |
Breakpoints In Python | ||
gdb.BP_BREAKPOINT: |
Breakpoints In Python | ||
gdb.BP_CATCHPOINT: |
Breakpoints In Python | ||
gdb.BP_HARDWARE_BREAKPOINT: |
Breakpoints In Python | ||
gdb.BP_HARDWARE_WATCHPOINT: |
Breakpoints In Python | ||
gdb.BP_READ_WATCHPOINT: |
Breakpoints In Python | ||
gdb.BP_WATCHPOINT: |
Breakpoints In Python | ||
gdb.Breakpoint: |
Breakpoints In Python | ||
gdb.breakpoints: |
Basic Python | ||
gdb.breakpoints: |
Basic Python | ||
gdb.COMMAND_BREAKPOINTS: |
CLI Commands In Python | ||
gdb.COMMAND_DATA: |
CLI Commands In Python | ||
gdb.COMMAND_FILES: |
CLI Commands In Python | ||
gdb.COMMAND_MAINTENANCE: |
CLI Commands In Python | ||
gdb.COMMAND_NONE: |
CLI Commands In Python | ||
gdb.COMMAND_OBSCURE: |
CLI Commands In Python | ||
gdb.COMMAND_RUNNING: |
CLI Commands In Python | ||
gdb.COMMAND_STACK: |
CLI Commands In Python | ||
gdb.COMMAND_STATUS: |
CLI Commands In Python | ||
gdb.COMMAND_SUPPORT: |
CLI Commands In Python | ||
gdb.COMMAND_TRACEPOINTS: |
CLI Commands In Python | ||
gdb.COMMAND_TUI: |
CLI Commands In Python | ||
gdb.COMMAND_USER: |
CLI Commands In Python | ||
gdb.COMPLETE_COMMAND: |
CLI Commands In Python | ||
gdb.COMPLETE_EXPRESSION: |
CLI Commands In Python | ||
gdb.COMPLETE_FILENAME: |
CLI Commands In Python | ||
gdb.COMPLETE_LOCATION: |
CLI Commands In Python | ||
gdb.COMPLETE_NONE: |
CLI Commands In Python | ||
gdb.COMPLETE_SYMBOL: |
CLI Commands In Python | ||
gdb.connections: |
Basic Python | ||
gdb.convenience_variable: |
Basic Python | ||
gdb.convenience_variable: |
Basic Python | ||
gdb.current_language: |
Basic Python | ||
gdb.current_objfile: |
Objfiles In Python | ||
gdb.current_objfile: |
Objfiles In Python | ||
gdb.current_progspace: |
Progspaces In Python | ||
gdb.current_progspace: |
Progspaces In Python | ||
gdb.current_recording: |
Recordings In Python | ||
gdb.decode_line: |
Basic Python | ||
gdb.decode_line: |
Basic Python | ||
gdb.default_visualizer: |
Pretty Printing API | ||
gdb.default_visualizer: |
Pretty Printing API | ||
gdb.disassembler.DisassembleInfo: |
Disassembly In Python | ||
gdb.error: |
Exception Handling | ||
gdb.execute: |
Basic Python | ||
gdb.execute: |
Basic Python | ||
gdb.find_pc_line: |
Basic Python | ||
gdb.find_pc_line: |
Basic Python | ||
gdb.FinishBreakpoint: |
Finish Breakpoints in Python | ||
gdb.flush: |
Basic Python | ||
gdb.flush: |
Basic Python | ||
gdb.format_address: |
Basic Python | ||
gdb.FrameDecorator: |
Frame Decorator API | ||
gdb.frame_stop_reason_string: |
Frames In Python | ||
gdb.Function: |
Functions In Python | ||
gdb.GdbError: |
Exception Handling | ||
gdb.history: |
Basic Python | ||
gdb.history: |
Basic Python | ||
gdb.history_count: |
Basic Python | ||
gdb.host_charset: |
Basic Python | ||
gdb.host_charset: |
Basic Python | ||
gdb.Inferior: |
Inferiors In Python | ||
gdb.InferiorCallPostEvent: |
Events In Python | ||
gdb.InferiorCallPreEvent: |
Events In Python | ||
gdb.inferiors: |
Inferiors In Python | ||
gdb.InferiorThread: |
Threads In Python | ||
gdb.invalidate_cached_frames: |
Frames In Python | ||
gdb.invalidate_cached_frames: |
Frames In Python | ||
gdb.LazyString: |
Lazy Strings In Python | ||
gdb.LineTable: |
Line Tables In Python | ||
gdb.lookup_global_symbol: |
Symbols In Python | ||
gdb.lookup_global_symbol: |
Symbols In Python | ||
gdb.lookup_objfile: |
Objfiles In Python | ||
gdb.lookup_objfile: |
Objfiles In Python | ||
gdb.lookup_static_symbol: |
Symbols In Python | ||
gdb.lookup_static_symbol: |
Symbols In Python | ||
gdb.lookup_static_symbols: |
Symbols In Python | ||
gdb.lookup_static_symbols: |
Symbols In Python | ||
gdb.lookup_symbol: |
Symbols In Python | ||
gdb.lookup_symbol: |
Symbols In Python | ||
gdb.lookup_type: |
Types In Python | ||
gdb.lookup_type: |
Types In Python | ||
gdb.MemoryError: |
Exception Handling | ||
gdb.newest_frame: |
Frames In Python | ||
gdb.newest_frame: |
Frames In Python | ||
gdb.Objfile: |
Objfiles In Python | ||
gdb.objfiles: |
Objfiles In Python | ||
gdb.objfiles: |
Objfiles In Python | ||
gdb.Parameter: |
Parameters In Python | ||
gdb.parameter: |
Basic Python | ||
gdb.parameter: |
Basic Python | ||
gdb.PARAM_AUTO_BOOLEAN: |
Parameters In Python | ||
gdb.PARAM_BOOLEAN: |
Parameters In Python | ||
gdb.PARAM_ENUM: |
Parameters In Python | ||
gdb.PARAM_FILENAME: |
Parameters In Python | ||
gdb.PARAM_INTEGER: |
Parameters In Python | ||
gdb.PARAM_OPTIONAL_FILENAME: |
Parameters In Python | ||
gdb.PARAM_STRING: |
Parameters In Python | ||
gdb.PARAM_STRING_NOESCAPE: |
Parameters In Python | ||
gdb.PARAM_UINTEGER: |
Parameters In Python | ||
gdb.PARAM_ZINTEGER: |
Parameters In Python | ||
gdb.PARAM_ZUINTEGER: |
Parameters In Python | ||
gdb.PARAM_ZUINTEGER_UNLIMITED: |
Parameters In Python | ||
gdb.parse_and_eval: |
Basic Python | ||
gdb.parse_and_eval: |
Basic Python | ||
gdb.post_event: |
Basic Python | ||
gdb.post_event: |
Basic Python | ||
gdb.pretty_printers: |
Selecting Pretty-Printers | ||
gdb.pretty_printers: |
Selecting Pretty-Printers | ||
gdb.print_options: |
Pretty Printing API | ||
gdb.print_options: |
Pretty Printing API | ||
gdb.Progspace: |
Progspaces In Python | ||
gdb.progspaces: |
Progspaces In Python | ||
gdb.progspaces: |
Progspaces In Python | ||
gdb.prompt_hook: |
Basic Python | ||
gdb.PYTHONDIR: |
Basic Python | ||
gdb.PYTHONDIR: |
Basic Python | ||
gdb.rbreak: |
Basic Python | ||
gdb.register_window_type: |
TUI Windows In Python | ||
gdb.register_window_type: |
TUI Windows In Python | ||
gdb.search_memory: |
Inferiors In Python | ||
gdb.selected_frame: |
Frames In Python | ||
gdb.selected_frame: |
Frames In Python | ||
gdb.selected_inferior: |
Inferiors In Python | ||
gdb.selected_thread: |
Threads In Python | ||
gdb.selected_thread: |
Threads In Python | ||
gdb.set_convenience_variable: |
Basic Python | ||
gdb.set_convenience_variable: |
Basic Python | ||
gdb.set_parameter: |
Basic Python | ||
gdb.set_parameter: |
Basic Python | ||
gdb.solib_name: |
Basic Python | ||
gdb.solib_name: |
Basic Python | ||
gdb.start_recording: |
Recordings In Python | ||
gdb.STDERR: |
Basic Python | ||
gdb.STDERR: |
Basic Python | ||
gdb.STDLOG: |
Basic Python | ||
gdb.STDLOG: |
Basic Python | ||
gdb.STDOUT: |
Basic Python | ||
gdb.STDOUT: |
Basic Python | ||
gdb.stop_recording: |
Recordings In Python | ||
gdb.string_to_argv: |
CLI Commands In Python | ||
gdb.Symbol: |
Symbols In Python | ||
gdb.SYMBOL_COMMON_BLOCK_DOMAIN: |
Symbols In Python | ||
gdb.SYMBOL_LABEL_DOMAIN: |
Symbols In Python | ||
gdb.SYMBOL_LOC_ARG: |
Symbols In Python | ||
gdb.SYMBOL_LOC_BLOCK: |
Symbols In Python | ||
gdb.SYMBOL_LOC_COMMON_BLOCK: |
Symbols In Python | ||
gdb.SYMBOL_LOC_COMPUTED: |
Symbols In Python | ||
gdb.SYMBOL_LOC_CONST: |
Symbols In Python | ||
gdb.SYMBOL_LOC_CONST_BYTES: |
Symbols In Python | ||
gdb.SYMBOL_LOC_LABEL: |
Symbols In Python | ||
gdb.SYMBOL_LOC_LOCAL: |
Symbols In Python | ||
gdb.SYMBOL_LOC_OPTIMIZED_OUT: |
Symbols In Python | ||
gdb.SYMBOL_LOC_REF_ARG: |
Symbols In Python | ||
gdb.SYMBOL_LOC_REGISTER: |
Symbols In Python | ||
gdb.SYMBOL_LOC_REGPARM_ADDR: |
Symbols In Python | ||
gdb.SYMBOL_LOC_STATIC: |
Symbols In Python | ||
gdb.SYMBOL_LOC_TYPEDEF: |
Symbols In Python | ||
gdb.SYMBOL_LOC_UNDEF: |
Symbols In Python | ||
gdb.SYMBOL_LOC_UNRESOLVED: |
Symbols In Python | ||
gdb.SYMBOL_MODULE_DOMAIN: |
Symbols In Python | ||
gdb.SYMBOL_STRUCT_DOMAIN: |
Symbols In Python | ||
gdb.SYMBOL_UNDEF_DOMAIN: |
Symbols In Python | ||
gdb.SYMBOL_VAR_DOMAIN: |
Symbols In Python | ||
gdb.Symtab: |
Symbol Tables In Python | ||
gdb.Symtab_and_line: |
Symbol Tables In Python | ||
gdb.target_charset: |
Basic Python | ||
gdb.target_charset: |
Basic Python | ||
gdb.target_wide_charset: |
Basic Python | ||
gdb.target_wide_charset: |
Basic Python | ||
gdb.Type: |
Types In Python | ||
gdb.TYPE_CODE_ARRAY: |
Types In Python | ||
gdb.TYPE_CODE_BITSTRING: |
Types In Python | ||
gdb.TYPE_CODE_BOOL: |
Types In Python | ||
gdb.TYPE_CODE_CHAR: |
Types In Python | ||
gdb.TYPE_CODE_COMPLEX: |
Types In Python | ||
gdb.TYPE_CODE_DECFLOAT: |
Types In Python | ||
gdb.TYPE_CODE_ENUM: |
Types In Python | ||
gdb.TYPE_CODE_ERROR: |
Types In Python | ||
gdb.TYPE_CODE_FIXED_POINT: |
Types In Python | ||
gdb.TYPE_CODE_FIXED_POINT: |
Types In Guile | ||
gdb.TYPE_CODE_FLAGS: |
Types In Python | ||
gdb.TYPE_CODE_FLT: |
Types In Python | ||
gdb.TYPE_CODE_FUNC: |
Types In Python | ||
gdb.TYPE_CODE_INT: |
Types In Python | ||
gdb.TYPE_CODE_INTERNAL_FUNCTION: |
Types In Python | ||
gdb.TYPE_CODE_MEMBERPTR: |
Types In Python | ||
gdb.TYPE_CODE_METHOD: |
Types In Python | ||
gdb.TYPE_CODE_METHODPTR: |
Types In Python | ||
gdb.TYPE_CODE_NAMESPACE: |
Types In Python | ||
gdb.TYPE_CODE_NAMESPACE: |
Types In Python | ||
gdb.TYPE_CODE_NAMESPACE: |
Types In Guile | ||
gdb.TYPE_CODE_PTR: |
Types In Python | ||
gdb.TYPE_CODE_RANGE: |
Types In Python | ||
gdb.TYPE_CODE_REF: |
Types In Python | ||
gdb.TYPE_CODE_RVALUE_REF: |
Types In Python | ||
gdb.TYPE_CODE_SET: |
Types In Python | ||
gdb.TYPE_CODE_STRING: |
Types In Python | ||
gdb.TYPE_CODE_STRUCT: |
Types In Python | ||
gdb.TYPE_CODE_TYPEDEF: |
Types In Python | ||
gdb.TYPE_CODE_UNION: |
Types In Python | ||
gdb.TYPE_CODE_VOID: |
Types In Python | ||
gdb.TYPE_CODE_XMETHOD: |
Types In Python | ||
gdb.TYPE_CODE_XMETHOD: |
Types In Guile | ||
gdb.unwinder.register_unwinder: |
Unwinding Frames in Python | ||
gdb.UnwindInfo.add_saved_register: |
Unwinding Frames in Python | ||
gdb.with_parameter: |
Basic Python | ||
gdb.with_parameter: |
Basic Python | ||
gdb.WP_ACCESS: |
Breakpoints In Python | ||
gdb.WP_READ: |
Breakpoints In Python | ||
gdb.WP_WRITE: |
Breakpoints In Python | ||
gdb.write: |
Basic Python | ||
gdb.write: |
Basic Python | ||
gdb:error: |
Guile Exception Handling | ||
gdb:invalid-object: |
Guile Exception Handling | ||
gdb:memory-error: |
Guile Exception Handling | ||
gdb:pp-type-error: |
Guile Exception Handling | ||
GdbExitingEvent.exit_code: |
Events In Python | ||
gdbserver: |
Server | ||
gdb_init_reader: |
Writing JIT Debug Info Readers | ||
generate-core-file: |
Core File Generation | ||
get-basic-type: |
Guile Types Module | ||
getDebugChar: |
Bootstrapping | ||
gnu_debuglink_crc32: |
Separate Debug Files | ||
gr: |
Guile Commands | ||
gu: |
Guile Commands | ||
guile: |
Guile Commands | ||
guile-data-directory: |
Guile Configuration | ||
guile-repl: |
Guile Commands | ||
|
|
|||
| H | |||
h (: |
Help | ||
handle: |
Signals | ||
handle_exception: |
Stub Contents | ||
hbreak: |
Set Breaks | ||
help: |
Help | ||
help function: |
Convenience Funs | ||
help target: |
Target Commands | ||
help user-defined: |
Define | ||
history-append!: |
Basic Guile | ||
history-preserve-point: |
Readline Init File Syntax | ||
history-ref: |
Basic Guile | ||
history-search-backward (): |
Commands For History | ||
history-search-forward (): |
Commands For History | ||
history-size: |
Readline Init File Syntax | ||
history-substring-search-backward (): |
Commands For History | ||
history-substring-search-forward (): |
Commands For History | ||
hook: |
Hooks | ||
hookpost: |
Hooks | ||
horizontal-scroll-mode: |
Readline Init File Syntax | ||
host-config: |
Guile Configuration | ||
|
|
|||
| I | |||
i (: |
Help | ||
i (SingleKey TUI key): |
TUI Single Key Mode | ||
if: |
Command Files | ||
ignore: |
Conditions | ||
inferior: |
Inferiors Connections and Programs | ||
inferior infno: |
Inferiors Connections and Programs | ||
Inferior.architecture: |
Inferiors In Python | ||
Inferior.connection: |
Inferiors In Python | ||
Inferior.connection_num: |
Inferiors In Python | ||
Inferior.is_valid: |
Inferiors In Python | ||
Inferior.num: |
Inferiors In Python | ||
Inferior.pid: |
Inferiors In Python | ||
Inferior.progspace: |
Inferiors In Python | ||
Inferior.read_memory: |
Inferiors In Python | ||
Inferior.read_memory: |
Inferiors In Python | ||
Inferior.search_memory: |
Inferiors In Python | ||
Inferior.threads: |
Inferiors In Python | ||
Inferior.thread_from_handle: |
Inferiors In Python | ||
Inferior.thread_from_handle: |
Inferiors In Python | ||
Inferior.thread_from_thread_handle: |
Inferiors In Python | ||
Inferior.was_attached: |
Inferiors In Python | ||
Inferior.write_memory: |
Inferiors In Python | ||
Inferior.write_memory: |
Inferiors In Python | ||
InferiorCallPostEvent.address: |
Events In Python | ||
InferiorCallPostEvent.ptid: |
Events In Python | ||
InferiorCallPreEvent.address: |
Events In Python | ||
InferiorCallPreEvent.ptid: |
Events In Python | ||
InferiorDeletedEvent.inferior: |
Events In Python | ||
InferiorThread.details: |
Threads In Python | ||
InferiorThread.global_num: |
Threads In Python | ||
InferiorThread.handle: |
Threads In Python | ||
InferiorThread.inferior: |
Threads In Python | ||
InferiorThread.is_exited: |
Threads In Python | ||
InferiorThread.is_running: |
Threads In Python | ||
InferiorThread.is_stopped: |
Threads In Python | ||
InferiorThread.is_valid: |
Threads In Python | ||
InferiorThread.name: |
Threads In Python | ||
InferiorThread.num: |
Threads In Python | ||
InferiorThread.ptid: |
Threads In Python | ||
InferiorThread.switch: |
Threads In Python | ||
info: |
Help | ||
info address: |
Symbols | ||
info all-registers: |
Registers | ||
info args: |
Frame Info | ||
info auto-load: |
Auto-loading | ||
info auto-load gdb-scripts: |
Auto-loading sequences | ||
info auto-load guile-scripts: |
Guile Auto-loading | ||
info auto-load libthread-db: |
libthread_db.so.1 file | ||
info auto-load local-gdbinit: |
Init File in the Current Directory | ||
info auto-load python-scripts: |
Python Auto-loading | ||
info auxv: |
OS Information | ||
info breakpoints: |
Set Breaks | ||
info checkpoints: |
Checkpoint/Restart | ||
info classes: |
Symbols | ||
info common: |
Special Fortran Commands | ||
info connections [ id… ]: |
Inferiors Connections and Programs | ||
info copying: |
Help | ||
info dcache: |
Caching Target Data | ||
info display: |
Auto Display | ||
info dll: |
Files | ||
info dos: |
DJGPP Native | ||
info exceptions: |
Ada Exceptions | ||
info extensions: |
Show | ||
info f (: |
Frame Info | ||
info files: |
Files | ||
info float: |
Floating Point Hardware | ||
info frame: |
Frame Info | ||
info frame, show the source language: |
Show | ||
info frame-filter: |
Frame Filter Management | ||
info functions: |
Symbols | ||
info handle: |
Signals | ||
info inferiors [ id… ]: |
Inferiors Connections and Programs | ||
info io_registers, AVR: |
AVR | ||
info line: |
Machine Code | ||
info line, and Objective-C: |
Method Names in Commands | ||
info locals: |
Frame Info | ||
info macro: |
Macros | ||
info macros: |
Macros | ||
info mem: |
Memory Region Attributes | ||
info meminfo: |
Process Information | ||
info module: |
Symbols | ||
info modules: |
Symbols | ||
info os: |
OS Information | ||
info os cpus: |
OS Information | ||
info os files: |
OS Information | ||
info os modules: |
OS Information | ||
info os msg: |
OS Information | ||
info os processes: |
OS Information | ||
info os procgroups: |
OS Information | ||
info os semaphores: |
OS Information | ||
info os shm: |
OS Information | ||
info os sockets: |
OS Information | ||
info os threads: |
OS Information | ||
info pidlist: |
Process Information | ||
info pretty-printer: |
Pretty-Printer Commands | ||
info probes: |
Static Probe Points | ||
info proc: |
Process Information | ||
info program: |
Stopping | ||
info record: |
Process Record and Replay | ||
info registers: |
Registers | ||
info scope: |
Symbols | ||
info selectors: |
Symbols | ||
info serial: |
DJGPP Native | ||
info set: |
Help | ||
info share: |
Files | ||
info sharedlibrary: |
Files | ||
info signals: |
Signals | ||
info skip: |
Skipping Over Functions and Files | ||
info source: |
Symbols | ||
info source, show the source language: |
Show | ||
info sources: |
Symbols | ||
info sources: |
GDB/MI File Commands | ||
info stack: |
Backtrace | ||
info static-tracepoint-markers: |
Listing Static Tracepoint Markers | ||
info symbol: |
Symbols | ||
info target: |
Files | ||
info task taskno: |
Ada Tasks | ||
info tasks: |
Ada Tasks | ||
info terminal: |
Input/Output | ||
info threads: |
Threads | ||
info tp [n…]: |
Listing Tracepoints | ||
info tracepoints [n…]: |
Listing Tracepoints | ||
info tvariables: |
Trace State Variables | ||
info type-printers: |
Symbols | ||
info types: |
Symbols | ||
info variables: |
Symbols | ||
info vector: |
Vector Unit | ||
info w32: |
Cygwin Native | ||
info warranty: |
Help | ||
info watchpoints [list…]: |
Set Watchpoints | ||
info win: |
TUI Commands | ||
info-gdb-mi-command: |
GDB/MI Support Commands | ||
init-if-undefined: |
Convenience Vars | ||
input-meta: |
Readline Init File Syntax | ||
input-port: |
I/O Ports in Guile | ||
insert-comment (M-#): |
Miscellaneous Commands | ||
insert-completions (M-*): |
Commands For Completion | ||
inspect: |
Data | ||
instantiate on type_printer: |
Type Printing API | ||
Instruction.data: |
Recordings In Python | ||
Instruction.decoded: |
Recordings In Python | ||
Instruction.pc: |
Recordings In Python | ||
Instruction.size: |
Recordings In Python | ||
interpreter-exec: |
Interpreters | ||
interrupt: |
Background Execution | ||
isearch-terminators: |
Readline Init File Syntax | ||
iterator->list: |
Iterators In Guile | ||
iterator-filter: |
Iterators In Guile | ||
iterator-for-each: |
Iterators In Guile | ||
iterator-map: |
Iterators In Guile | ||
iterator-next!: |
Iterators In Guile | ||
iterator-object: |
Iterators In Guile | ||
iterator-progress: |
Iterators In Guile | ||
iterator-until: |
Iterators In Guile | ||
iterator?: |
Iterators In Guile | ||
|
|
|||
| J | |||
j (: |
Jumping | ||
jit-reader-load: |
Using JIT Debug Info Readers | ||
jit-reader-unload: |
Using JIT Debug Info Readers | ||
jump: |
Jumping | ||
jump, and Objective-C: |
Method Names in Commands | ||
|
|
|||
| K | |||
KeyboardInterrupt: |
Exception Handling | ||
keymap: |
Readline Init File Syntax | ||
kill: |
Kill Process | ||
kill inferiors infno…: |
Inferiors Connections and Programs | ||
kill-line (C-k): |
Commands For Killing | ||
kill-region (): |
Commands For Killing | ||
kill-whole-line (): |
Commands For Killing | ||
kill-word (M-d): |
Commands For Killing | ||
kvm: |
BSD libkvm Interface | ||
|
|
|||
| L | |||
l (: |
List | ||
language-option: |
GDB/MI Support Commands | ||
layout: |
TUI Commands | ||
lazy-string->value: |
Lazy Strings In Guile | ||
lazy-string-address: |
Lazy Strings In Guile | ||
lazy-string-encoding: |
Lazy Strings In Guile | ||
lazy-string-length: |
Lazy Strings In Guile | ||
lazy-string-type: |
Lazy Strings In Guile | ||
lazy-string?: |
Lazy Strings In Guile | ||
LazyString.address: |
Lazy Strings In Python | ||
LazyString.encoding: |
Lazy Strings In Python | ||
LazyString.length: |
Lazy Strings In Python | ||
LazyString.type: |
Lazy Strings In Python | ||
LazyString.value: |
Lazy Strings In Python | ||
Left: |
TUI Keys | ||
LineTable.has_line: |
Line Tables In Python | ||
LineTable.line: |
Line Tables In Python | ||
LineTable.source_lines: |
Line Tables In Python | ||
LineTableEntry.line: |
Line Tables In Python | ||
LineTableEntry.pc: |
Line Tables In Python | ||
list: |
List | ||
list, and Objective-C: |
Method Names in Commands | ||
load filename offset: |
Target Commands | ||
lookup-block: |
Blocks In Guile | ||
lookup-global-symbol: |
Symbols In Guile | ||
lookup-symbol: |
Symbols In Guile | ||
lookup-type: |
Types In Guile | ||
loop_break: |
Command Files | ||
loop_continue: |
Command Files | ||
|
|
|||
| M | |||
macro define: |
Macros | ||
macro exp1: |
Macros | ||
macro expand: |
Macros | ||
macro list: |
Macros | ||
macro undef: |
Macros | ||
maint ada set ignore-descriptive-types: |
Ada Glitches | ||
maint ada show ignore-descriptive-types: |
Ada Glitches | ||
maint agent: |
Maintenance Commands | ||
maint agent-eval: |
Maintenance Commands | ||
maint agent-printf: |
Maintenance Commands | ||
maint btrace clear: |
Maintenance Commands | ||
maint btrace clear-packet-history: |
Maintenance Commands | ||
maint btrace packet-history: |
Maintenance Commands | ||
maint check libthread-db: |
Maintenance Commands | ||
maint check xml-descriptions: |
Maintenance Commands | ||
maint check-psymtabs: |
Maintenance Commands | ||
maint check-symtabs: |
Maintenance Commands | ||
maint cplus first_component: |
Maintenance Commands | ||
maint cplus namespace: |
Maintenance Commands | ||
maint demangler-warning: |
Maintenance Commands | ||
maint deprecate: |
Maintenance Commands | ||
maint dump-me: |
Maintenance Commands | ||
maint expand-symtabs: |
Maintenance Commands | ||
maint flush dcache: |
Caching Target Data | ||
maint flush register-cache: |
Maintenance Commands | ||
maint flush source-cache: |
Maintenance Commands | ||
maint flush symbol-cache: |
Symbols | ||
maint flush-symbol-cache: |
Symbols | ||
maint info bdccsr, S12Z: |
S12Z | ||
maint info bfds: |
File Caching | ||
maint info breakpoints: |
Maintenance Commands | ||
maint info btrace: |
Maintenance Commands | ||
maint info jit: |
Maintenance Commands | ||
maint info line-table: |
Symbols | ||
maint info program-spaces: |
Inferiors Connections and Programs | ||
maint info psymtabs: |
Symbols | ||
maint info python-disassemblers: |
Maintenance Commands | ||
maint info sections: |
Files | ||
maint info selftests: |
Maintenance Commands | ||
maint info sol-threads: |
Threads | ||
maint info symtabs: |
Symbols | ||
maint info target-sections: |
Files | ||
maint internal-error: |
Maintenance Commands | ||
maint internal-warning: |
Maintenance Commands | ||
maint packet: |
Connections In Python | ||
maint packet: |
Maintenance Commands | ||
maint print arc arc-instruction: |
ARC | ||
maint print architecture: |
Maintenance Commands | ||
maint print c-tdesc: |
Maintenance Commands | ||
maint print cooked-registers: |
Maintenance Commands | ||
maint print core-file-backed-mappings: |
Maintenance Commands | ||
maint print dummy-frames: |
Maintenance Commands | ||
maint print frame-id: |
Maintenance Commands | ||
maint print msymbols: |
Symbols | ||
maint print objfiles: |
Maintenance Commands | ||
maint print psymbols: |
Symbols | ||
maint print raw-registers: |
Maintenance Commands | ||
maint print reggroups: |
Maintenance Commands | ||
maint print register-groups: |
Maintenance Commands | ||
maint print registers: |
Maintenance Commands | ||
maint print remote-registers: |
Maintenance Commands | ||
maint print section-scripts: |
Maintenance Commands | ||
maint print statistics: |
Maintenance Commands | ||
maint print symbol-cache: |
Symbols | ||
maint print symbol-cache-statistics: |
Symbols | ||
maint print symbols: |
Symbols | ||
maint print target-stack: |
Maintenance Commands | ||
maint print type: |
Maintenance Commands | ||
maint print unwind, HPPA: |
HPPA | ||
maint print user-registers: |
Maintenance Commands | ||
maint print xml-tdesc: |
Maintenance Commands | ||
maint selftest: |
Maintenance Commands | ||
maint set backtrace-on-fatal-signal: |
Maintenance Commands | ||
maint set bfd-sharing: |
File Caching | ||
maint set btrace pt skip-pad: |
Maintenance Commands | ||
maint set catch-demangler-crashes: |
Maintenance Commands | ||
maint set check-libthread-db: |
Maintenance Commands | ||
maint set demangler-warning: |
Maintenance Commands | ||
maint set dwarf always-disassemble: |
Maintenance Commands | ||
maint set dwarf max-cache-age: |
Maintenance Commands | ||
maint set dwarf unwinders: |
Maintenance Commands | ||
maint set gnu-source-highlight enabled: |
Maintenance Commands | ||
maint set ignore-prologue-end-flag: |
Symbols | ||
maint set internal-error: |
Maintenance Commands | ||
maint set internal-error: |
Maintenance Commands | ||
maint set internal-warning: |
Maintenance Commands | ||
maint set internal-warning: |
Maintenance Commands | ||
maint set libopcodes-styling enabled: |
Maintenance Commands | ||
maint set per-command: |
Maintenance Commands | ||
maint set profile: |
Maintenance Commands | ||
maint set selftest verbose: |
Maintenance Commands | ||
maint set show-all-tib: |
Maintenance Commands | ||
maint set show-debug-regs: |
Maintenance Commands | ||
maint set symbol-cache-size: |
Symbols | ||
maint set target-async: |
Maintenance Commands | ||
maint set target-non-stop mode [on|off|auto]: |
Maintenance Commands | ||
maint set test-settings: |
Maintenance Commands | ||
maint set tui-resize-message: |
Maintenance Commands | ||
maint set worker-threads: |
Maintenance Commands | ||
maint show backtrace-on-fatal-signal: |
Maintenance Commands | ||
maint show bfd-sharing: |
File Caching | ||
maint show btrace pt skip-pad: |
Maintenance Commands | ||
maint show catch-demangler-crashes: |
Maintenance Commands | ||
maint show check-libthread-db: |
Maintenance Commands | ||
maint show demangler-warning: |
Maintenance Commands | ||
maint show dwarf always-disassemble: |
Maintenance Commands | ||
maint show dwarf max-cache-age: |
Maintenance Commands | ||
maint show dwarf unwinders: |
Maintenance Commands | ||
maint show gnu-source-highlight enabled: |
Maintenance Commands | ||
maint show ignore-prologue-end-flag: |
Symbols | ||
maint show internal-error: |
Maintenance Commands | ||
maint show internal-error: |
Maintenance Commands | ||
maint show internal-warning: |
Maintenance Commands | ||
maint show internal-warning: |
Maintenance Commands | ||
maint show libopcodes-styling enabled: |
Maintenance Commands | ||
maint show per-command: |
Maintenance Commands | ||
maint show profile: |
Maintenance Commands | ||
maint show selftest verbose: |
Maintenance Commands | ||
maint show show-all-tib: |
Maintenance Commands | ||
maint show show-debug-regs: |
Maintenance Commands | ||
maint show symbol-cache-size: |
Symbols | ||
maint show target-async: |
Maintenance Commands | ||
maint show target-non-stop: |
Maintenance Commands | ||
maint show test-options-completion-result: |
Maintenance Commands | ||
maint show test-settings: |
Maintenance Commands | ||
maint show tui-resize-message: |
Maintenance Commands | ||
maint show worker-threads: |
Maintenance Commands | ||
maint space: |
Maintenance Commands | ||
maint test-options: |
Maintenance Commands | ||
maint time: |
Maintenance Commands | ||
maint translate-address: |
Maintenance Commands | ||
maint undeprecate: |
Maintenance Commands | ||
maint with: |
Maintenance Commands | ||
make: |
Shell Commands | ||
make-block-symbols-iterator: |
Blocks In Guile | ||
make-breakpoint: |
Breakpoints In Guile | ||
make-command: |
Commands In Guile | ||
make-enum-hashtable: |
Guile Types Module | ||
make-exception: |
Guile Exception Handling | ||
make-field-iterator: |
Types In Guile | ||
make-iterator: |
Iterators In Guile | ||
make-lazy-value: |
Values From Inferior In Guile | ||
make-list-iterator: |
Iterators In Guile | ||
make-parameter: |
Parameters In Guile | ||
make-pretty-printer: |
Guile Pretty Printing API | ||
make-pretty-printer-worker: |
Guile Pretty Printing API | ||
make-value: |
Values From Inferior In Guile | ||
mark-modified-lines: |
Readline Init File Syntax | ||
mark-symlinked-directories: |
Readline Init File Syntax | ||
match-hidden-files: |
Readline Init File Syntax | ||
may-insert-breakpoints: |
Observer Mode | ||
may-insert-fast-tracepoints: |
Observer Mode | ||
may-insert-tracepoints: |
Observer Mode | ||
may-interrupt: |
Observer Mode | ||
may-write-memory: |
Observer Mode | ||
may-write-registers: |
Observer Mode | ||
mem: |
Memory Region Attributes | ||
memory-port-range: |
Memory Ports in Guile | ||
memory-port-read-buffer-size: |
Memory Ports in Guile | ||
memory-port-write-buffer-size: |
Memory Ports in Guile | ||
memory-port?: |
Memory Ports in Guile | ||
memory-tag check: |
Memory Tagging | ||
memory-tag print-allocation-tag: |
Memory Tagging | ||
memory-tag print-logical-tag: |
Memory Tagging | ||
memory-tag setatag: |
Memory Tagging | ||
memory-tag with-logical-tag: |
Memory Tagging | ||
MemoryChangedEvent.address: |
Events In Python | ||
MemoryChangedEvent.length: |
Events In Python | ||
memset: |
Bootstrapping | ||
menu-complete (): |
Commands For Completion | ||
menu-complete-backward (): |
Commands For Completion | ||
menu-complete-display-prefix: |
Readline Init File Syntax | ||
meta-flag: |
Readline Init File Syntax | ||
methods: |
Xmethod API | ||
MICommand.installed: |
GDB/MI Commands In Python | ||
MICommand.invoke: |
GDB/MI Commands In Python | ||
MICommand.name: |
GDB/MI Commands In Python | ||
MICommand.__init__: |
GDB/MI Commands In Python | ||
monitor: |
Connecting | ||
|
|
|||
| N | |||
n (: |
Continuing and Stepping | ||
n (SingleKey TUI key): |
TUI Single Key Mode | ||
name: |
Xmethod API | ||
name of type_printer: |
Type Printing API | ||
new-ui: |
Interpreters | ||
newest-frame: |
Frames In Guile | ||
NewInferiorEvent.inferior: |
Events In Python | ||
NewObjFileEvent.new_objfile: |
Events In Python | ||
NewObjFileEvent.objfile: |
Events In Python | ||
NewThreadEvent.inferior_thread: |
Events In Python | ||
next: |
Continuing and Stepping | ||
next&: |
Background Execution | ||
next-history (C-n): |
Commands For History | ||
next-screen-line (): |
Commands For Moving | ||
nexti: |
Continuing and Stepping | ||
nexti&: |
Background Execution | ||
ni (: |
Continuing and Stepping | ||
non-incremental-forward-search-history (M-n): |
Commands For History | ||
non-incremental-reverse-search-history (M-p): |
Commands For History | ||
nosharedlibrary: |
Files | ||
|
|
|||
| O | |||
o (SingleKey TUI key): |
TUI Single Key Mode | ||
Objfile: |
Objfiles In Python | ||
objfile-filename: |
Objfiles In Guile | ||
objfile-pretty-printers: |
Objfiles In Guile | ||
objfile-progspace: |
Objfiles In Guile | ||
objfile-valid?: |
Objfiles In Guile | ||
Objfile.add_separate_debug_file: |
Objfiles In Python | ||
Objfile.build_id: |
Objfiles In Python | ||
Objfile.filename: |
Objfiles In Python | ||
Objfile.frame_filters: |
Objfiles In Python | ||
Objfile.is_file: |
Objfiles In Python | ||
Objfile.is_valid: |
Objfiles In Python | ||
Objfile.lookup_global_symbol: |
Objfiles In Python | ||
Objfile.lookup_static_symbol: |
Objfiles In Python | ||
Objfile.owner: |
Objfiles In Python | ||
Objfile.pretty_printers: |
Objfiles In Python | ||
Objfile.progspace: |
Objfiles In Python | ||
Objfile.type_printers: |
Objfiles In Python | ||
Objfile.username: |
Objfiles In Python | ||
objfile?: |
Objfiles In Guile | ||
objfiles: |
Objfiles In Guile | ||
observer: |
Observer Mode | ||
open-memory: |
Memory Ports in Guile | ||
operate-and-get-next (C-o): |
Commands For History | ||
output: |
Output | ||
output-meta: |
Readline Init File Syntax | ||
output-port: |
I/O Ports in Guile | ||
overlay: |
Overlay Commands | ||
overload-choice annotation: |
Prompting | ||
overwrite-mode (): |
Commands For Text | ||
|
|
|||
| P | |||
page-completions: |
Readline Init File Syntax | ||
Parameter: |
Parameters In Python | ||
Parameter: |
Parameters In Guile | ||
parameter-value: |
Parameters In Guile | ||
Parameter.get_set_string: |
Parameters In Python | ||
Parameter.get_show_string: |
Parameters In Python | ||
Parameter.set_doc: |
Parameters In Python | ||
Parameter.show_doc: |
Parameters In Python | ||
Parameter.value: |
Parameters In Python | ||
Parameter.__init__: |
Parameters In Python | ||
parameter?: |
Parameters In Guile | ||
PARAM_AUTO_BOOLEAN: |
Parameters In Python | ||
PARAM_AUTO_BOOLEAN: |
Parameters In Guile | ||
PARAM_BOOLEAN: |
Parameters In Python | ||
PARAM_BOOLEAN: |
Parameters In Guile | ||
PARAM_ENUM: |
Parameters In Python | ||
PARAM_ENUM: |
Parameters In Guile | ||
PARAM_FILENAME: |
Parameters In Python | ||
PARAM_FILENAME: |
Parameters In Guile | ||
PARAM_INTEGER: |
Parameters In Python | ||
PARAM_OPTIONAL_FILENAME: |
Parameters In Python | ||
PARAM_OPTIONAL_FILENAME: |
Parameters In Guile | ||
PARAM_STRING: |
Parameters In Python | ||
PARAM_STRING: |
Parameters In Guile | ||
PARAM_STRING_NOESCAPE: |
Parameters In Python | ||
PARAM_STRING_NOESCAPE: |
Parameters In Guile | ||
PARAM_UINTEGER: |
Parameters In Python | ||
PARAM_UINTEGER: |
Parameters In Guile | ||
PARAM_ZINTEGER: |
Parameters In Python | ||
PARAM_ZINTEGER: |
Parameters In Guile | ||
PARAM_ZUINTEGER: |
Parameters In Python | ||
PARAM_ZUINTEGER: |
Parameters In Guile | ||
PARAM_ZUINTEGER_UNLIMITED: |
Parameters In Python | ||
PARAM_ZUINTEGER_UNLIMITED: |
Parameters In Guile | ||
parse-and-eval: |
Basic Guile | ||
passcount: |
Tracepoint Passcounts | ||
path: |
Environment | ||
pending-breakpoints: |
GDB/MI Support Commands | ||
PendingFrame.architecture: |
Unwinding Frames in Python | ||
PendingFrame.create_unwind_info: |
Unwinding Frames in Python | ||
PendingFrame.level: |
Unwinding Frames in Python | ||
PendingFrame.read_register: |
Unwinding Frames in Python | ||
PgDn: |
TUI Keys | ||
PgUp: |
TUI Keys | ||
pi: |
Python Commands | ||
pipe: |
Shell Commands | ||
po (: |
The Print Command with Objective-C | ||
possible-completions (M-?): |
Commands For Completion | ||
post-commands annotation: |
Prompting | ||
post-overload-choice annotation: |
Prompting | ||
post-prompt annotation: |
Prompting | ||
post-prompt-for-continue annotation: |
Prompting | ||
post-query annotation: |
Prompting | ||
pre-commands annotation: |
Prompting | ||
pre-overload-choice annotation: |
Prompting | ||
pre-prompt annotation: |
Prompting | ||
pre-prompt-for-continue annotation: |
Prompting | ||
pre-query annotation: |
Prompting | ||
prefix-meta (ESC): |
Miscellaneous Commands | ||
prepend-pretty-printer!: |
Guile Printing Module | ||
pretty-printer-enabled?: |
Guile Pretty Printing API | ||
pretty-printer?: |
Guile Pretty Printing API | ||
pretty-printers: |
Guile Pretty Printing API | ||
pretty_printer.children: |
Pretty Printing API | ||
pretty_printer.display_hint: |
Pretty Printing API | ||
pretty_printer.to_string: |
Pretty Printing API | ||
previous-history (C-p): |
Commands For History | ||
previous-screen-line (): |
Commands For Moving | ||
print: |
Data | ||
print-last-kbd-macro (): |
Keyboard Macros | ||
print-object: |
The Print Command with Objective-C | ||
printf: |
Output | ||
proc-trace-entry: |
Process Information | ||
proc-trace-exit: |
Process Information | ||
proc-untrace-entry: |
Process Information | ||
proc-untrace-exit: |
Process Information | ||
Progspace: |
Progspaces In Python | ||
progspace-filename: |
Progspaces In Guile | ||
progspace-objfiles: |
Progspaces In Guile | ||
progspace-pretty-printers: |
Progspaces In Guile | ||
progspace-valid?: |
Progspaces In Guile | ||
Progspace.block_for_pc: |
Progspaces In Python | ||
Progspace.block_for_pc: |
Progspaces In Python | ||
Progspace.filename: |
Progspaces In Python | ||
Progspace.find_pc_line: |
Progspaces In Python | ||
Progspace.find_pc_line: |
Progspaces In Python | ||
Progspace.frame_filters: |
Progspaces In Python | ||
Progspace.is_valid: |
Progspaces In Python | ||
Progspace.is_valid: |
Progspaces In Python | ||
Progspace.objfiles: |
Progspaces In Python | ||
Progspace.objfiles: |
Progspaces In Python | ||
Progspace.pretty_printers: |
Progspaces In Python | ||
Progspace.solib_name: |
Progspaces In Python | ||
Progspace.solib_name: |
Progspaces In Python | ||
Progspace.type_printers: |
Progspaces In Python | ||
progspace?: |
Progspaces In Guile | ||
progspaces: |
Progspaces In Guile | ||
prompt annotation: |
Prompting | ||
prompt-for-continue annotation: |
Prompting | ||
ptype: |
Symbols | ||
putDebugChar: |
Bootstrapping | ||
pwd: |
Working Directory | ||
py: |
Python Commands | ||
python: |
GDB/MI Support Commands | ||
python: |
Python Commands | ||
python-interactive: |
Python Commands | ||
|
|
|||
| Q | |||
q (: |
Quitting GDB | ||
q (SingleKey TUI key): |
TUI Single Key Mode | ||
query annotation: |
Prompting | ||
queue-signal: |
Signaling | ||
quit annotation: |
Errors | ||
quit [expression]: |
Quitting GDB | ||
quoted-insert (C-q or C-v): |
Commands For Text | ||
|
|
|||
| R | |||
r (: |
Starting | ||
r (SingleKey TUI key): |
TUI Single Key Mode | ||
rbreak: |
Set Breaks | ||
rc (: |
Reverse Execution | ||
re-read-init-file (C-x C-r): |
Miscellaneous Commands | ||
readnow: |
Files | ||
rec: |
Process Record and Replay | ||
rec btrace: |
Process Record and Replay | ||
rec btrace bts: |
Process Record and Replay | ||
rec btrace pt: |
Process Record and Replay | ||
rec bts: |
Process Record and Replay | ||
rec del: |
Process Record and Replay | ||
rec full: |
Process Record and Replay | ||
rec function-call-history: |
Process Record and Replay | ||
rec instruction-history: |
Process Record and Replay | ||
rec pt: |
Process Record and Replay | ||
rec s: |
Process Record and Replay | ||
recognize on type_recognizer: |
Type Printing API | ||
record: |
Process Record and Replay | ||
record btrace: |
Process Record and Replay | ||
record btrace bts: |
Process Record and Replay | ||
record btrace pt: |
Process Record and Replay | ||
record bts: |
Process Record and Replay | ||
record delete: |
Process Record and Replay | ||
record full: |
Process Record and Replay | ||
record function-call-history: |
Process Record and Replay | ||
record goto: |
Process Record and Replay | ||
record instruction-history: |
Process Record and Replay | ||
record pt: |
Process Record and Replay | ||
record restore: |
Process Record and Replay | ||
record save: |
Process Record and Replay | ||
record stop: |
Process Record and Replay | ||
Record.begin: |
Recordings In Python | ||
Record.end: |
Recordings In Python | ||
Record.format: |
Recordings In Python | ||
Record.function_call_history: |
Recordings In Python | ||
Record.goto: |
Recordings In Python | ||
Record.instruction_history: |
Recordings In Python | ||
Record.method: |
Recordings In Python | ||
Record.replay_position: |
Recordings In Python | ||
RecordFunctionSegment.instructions: |
Recordings In Python | ||
RecordFunctionSegment.level: |
Recordings In Python | ||
RecordFunctionSegment.next: |
Recordings In Python | ||
RecordFunctionSegment.number: |
Recordings In Python | ||
RecordFunctionSegment.prev: |
Recordings In Python | ||
RecordFunctionSegment.symbol: |
Recordings In Python | ||
RecordFunctionSegment.up: |
Recordings In Python | ||
RecordGap.error_code: |
Recordings In Python | ||
RecordGap.error_string: |
Recordings In Python | ||
RecordGap.number: |
Recordings In Python | ||
RecordInstruction.is_speculative: |
Recordings In Python | ||
RecordInstruction.number: |
Recordings In Python | ||
RecordInstruction.sal: |
Recordings In Python | ||
redraw-current-line (): |
Commands For Moving | ||
refresh: |
TUI Commands | ||
register-breakpoint!: |
Breakpoints In Guile | ||
register-command!: |
Commands In Guile | ||
register-parameter!: |
Parameters In Guile | ||
RegisterChangedEvent.frame: |
Events In Python | ||
RegisterChangedEvent.regnum: |
Events In Python | ||
RegisterDescriptor.name: |
Registers In Python | ||
RegisterDescriptorIterator.find: |
Registers In Python | ||
RegisterGroup.name: |
Registers In Python | ||
register_disassembler: |
Disassembly In Python | ||
register_xmethod_matcher: |
Xmethod API | ||
remote delete: |
File Transfer | ||
remote get: |
File Transfer | ||
remote put: |
File Transfer | ||
RemoteTargetConnection.send_packet: |
Connections In Python | ||
remove-inferiors: |
Inferiors Connections and Programs | ||
remove-symbol-file: |
Files | ||
restart checkpoint-id: |
Checkpoint/Restart | ||
restore: |
Dump/Restore Files | ||
RET (repeat last command): |
Command Syntax | ||
return: |
Returning | ||
reverse-continue: |
Reverse Execution | ||
reverse-finish: |
Reverse Execution | ||
reverse-next: |
Reverse Execution | ||
reverse-nexti: |
Reverse Execution | ||
reverse-search: |
Search | ||
reverse-search-history (C-r): |
Commands For History | ||
reverse-step: |
Reverse Execution | ||
reverse-stepi: |
Reverse Execution | ||
revert-all-at-newline: |
Readline Init File Syntax | ||
revert-line (M-r): |
Miscellaneous Commands | ||
Right: |
TUI Keys | ||
rn (: |
Reverse Execution | ||
rni (: |
Reverse Execution | ||
rs (: |
Reverse Execution | ||
rsi (: |
Reverse Execution | ||
run: |
Starting | ||
run&: |
Background Execution | ||
rwatch: |
Set Watchpoints | ||
|
|
|||
| S | |||
s (SingleKey TUI key): |
TUI Single Key Mode | ||
s (: |
Continuing and Stepping | ||
sal-last: |
Symbol Tables In Guile | ||
sal-line: |
Symbol Tables In Guile | ||
sal-pc: |
Symbol Tables In Guile | ||
sal-symtab: |
Symbol Tables In Guile | ||
sal-valid?: |
Symbol Tables In Guile | ||
sal?: |
Symbol Tables In Guile | ||
save breakpoints: |
Save Breakpoints | ||
save gdb-index: |
Index Files | ||
save tracepoints: |
save tracepoints | ||
save-tracepoints: |
save tracepoints | ||
search: |
Search | ||
section: |
Files | ||
select-frame: |
Selection | ||
selected-frame: |
Frames In Guile | ||
self: |
Commands In Guile | ||
self-insert (a, b, A, 1, !, …): |
Commands For Text | ||
set: |
Help | ||
set ada print-signatures: |
Overloading support for Ada | ||
set ada source-charset: |
Ada Source Character Set | ||
set ada trust-PAD-over-XVS: |
Ada Glitches | ||
set agent off: |
In-Process Agent | ||
set agent on: |
In-Process Agent | ||
set annotate: |
Annotations Overview | ||
set architecture: |
Targets | ||
set args: |
Arguments | ||
set arm: |
ARM | ||
set auto-connect-native-target: |
Starting | ||
set auto-load gdb-scripts: |
Auto-loading sequences | ||
set auto-load guile-scripts: |
Guile Auto-loading | ||
set auto-load libthread-db: |
libthread_db.so.1 file | ||
set auto-load local-gdbinit: |
Init File in the Current Directory | ||
set auto-load off: |
Auto-loading | ||
set auto-load python-scripts: |
Python Auto-loading | ||
set auto-load safe-path: |
Auto-loading safe path | ||
set auto-load scripts-directory: |
objfile-gdbdotext file | ||
set auto-solib-add: |
Files | ||
set backtrace: |
Backtrace | ||
set basenames-may-differ: |
Files | ||
set breakpoint always-inserted: |
Set Breaks | ||
set breakpoint auto-hw: |
Set Breaks | ||
set breakpoint condition-evaluation: |
Set Breaks | ||
set breakpoint pending: |
Set Breaks | ||
set can-use-hw-watchpoints: |
Set Watchpoints | ||
set case-sensitive: |
Symbols | ||
set charset: |
Character Sets | ||
set check range: |
Range Checking | ||
set check type: |
Type Checking | ||
set circular-trace-buffer: |
Starting and Stopping Trace Experiments | ||
set code-cache: |
Caching Target Data | ||
set coerce-float-to-double: |
ABI | ||
set com1base: |
DJGPP Native | ||
set com1irq: |
DJGPP Native | ||
set com2base: |
DJGPP Native | ||
set com2irq: |
DJGPP Native | ||
set com3base: |
DJGPP Native | ||
set com3irq: |
DJGPP Native | ||
set com4base: |
DJGPP Native | ||
set com4irq: |
DJGPP Native | ||
set complaints: |
Messages/Warnings | ||
set confirm: |
Messages/Warnings | ||
set cp-abi: |
ABI | ||
set cwd: |
Working Directory | ||
set cygwin-exceptions: |
Cygwin Native | ||
set data-directory: |
Data Files | ||
set dcache line-size: |
Caching Target Data | ||
set dcache size: |
Caching Target Data | ||
set debug: |
Debugging Output | ||
set debug aarch64: |
AArch64 | ||
set debug arc: |
ARC | ||
set debug auto-load: |
Auto-loading verbose mode | ||
set debug bfd-cache level: |
File Caching | ||
set debug darwin: |
Darwin | ||
set debug entry-values: |
Tail Call Frames | ||
set debug hppa: |
HPPA | ||
set debug libthread-db: |
Threads | ||
set debug mach-o: |
Darwin | ||
set debug mips: |
MIPS | ||
set debug monitor: |
Target Commands | ||
set debug nios2: |
Nios II | ||
set debug py-breakpoint: |
Python Commands | ||
set debug py-unwind: |
Python Commands | ||
set debug skip: |
Skipping Over Functions and Files | ||
set debug threads: |
Threads | ||
set debug tui: |
TUI Configuration | ||
set debug-file-directory: |
Separate Debug Files | ||
set debugevents: |
Cygwin Native | ||
set debugexceptions: |
Cygwin Native | ||
set debugexec: |
Cygwin Native | ||
set debuginfod enabled: |
Debuginfod Settings | ||
set debuginfod urls: |
Debuginfod Settings | ||
set debuginfod verbose: |
Debuginfod Settings | ||
set debugmemory: |
Cygwin Native | ||
set default-collect: |
Tracepoint Actions | ||
set demangle-style: |
Print Settings | ||
set detach-on-fork: |
Forks | ||
set directories: |
Source Path | ||
set disable-randomization: |
Starting | ||
set disassemble-next-line: |
Machine Code | ||
set disassembler-options: |
Machine Code | ||
set disassembly-flavor: |
Machine Code | ||
set disconnected-dprintf: |
Dynamic Printf | ||
set disconnected-tracing: |
Starting and Stopping Trace Experiments | ||
set displaced-stepping: |
Maintenance Commands | ||
set dump-excluded-mappings: |
Core File Generation | ||
set editing: |
Editing | ||
set endian: |
Byte Order | ||
set environment: |
Environment | ||
set exceptions, Hurd command: |
Hurd Native | ||
set exec-direction: |
Reverse Execution | ||
set exec-done-display: |
Debugging Output | ||
set exec-wrapper: |
Starting | ||
set extended-prompt: |
Prompt | ||
set extension-language: |
Show | ||
set follow-exec-mode: |
Forks | ||
set follow-fork-mode: |
Forks | ||
set fortran repack-array-slices: |
Special Fortran Commands | ||
set frame-filter priority: |
Frame Filter Management | ||
set gnutarget: |
Target Commands | ||
set guile print-stack: |
Guile Exception Handling | ||
set hash, for remote monitors: |
Target Commands | ||
set height: |
Screen Size | ||
set history expansion: |
Command History | ||
set history filename: |
Command History | ||
set history remove-duplicates: |
Command History | ||
set history save: |
Command History | ||
set history size: |
Command History | ||
set host-charset: |
Character Sets | ||
set index-cache: |
Index Files | ||
set inferior-tty: |
Input/Output | ||
set input-radix: |
Numbers | ||
set interactive-mode: |
Other Misc Settings | ||
set language: |
Manually | ||
set libthread-db-search-path: |
Threads | ||
set listsize: |
List | ||
set logging enabled: |
Logging Output | ||
set mach-exceptions: |
Darwin | ||
set max-completions: |
Completion | ||
set max-user-call-depth: |
Define | ||
set max-value-size: |
Value Sizes | ||
set may-call-functions: |
Calling | ||
set mem inaccessible-by-default: |
Memory Region Attributes | ||
set mi-async: |
Asynchronous and non-stop modes | ||
set mips abi: |
MIPS | ||
set mips compression: |
MIPS | ||
set mips mask-address: |
MIPS | ||
set mipsfpu: |
MIPS Embedded | ||
set mpx bound: |
i386 | ||
set multiple-symbols: |
Ambiguous Expressions | ||
set new-console: |
Cygwin Native | ||
set new-group: |
Cygwin Native | ||
set non-stop: |
Non-Stop Mode | ||
set opaque-type-resolution: |
Symbols | ||
set osabi: |
ABI | ||
set output-radix: |
Numbers | ||
set overload-resolution: |
Debugging C Plus Plus | ||
set pagination: |
Screen Size | ||
set powerpc: |
PowerPC Embedded | ||
set print: |
Print Settings | ||
set print entry-values: |
Print Settings | ||
set print finish: |
Continuing and Stepping | ||
set print frame-arguments: |
Print Settings | ||
set print frame-info: |
Print Settings | ||
set print inferior-events: |
Inferiors Connections and Programs | ||
set print symbol-loading: |
Symbols | ||
set print thread-events: |
Threads | ||
set print type hex: |
Symbols | ||
set print type methods: |
Symbols | ||
set print type nested-type-limit: |
Symbols | ||
set print type typedefs: |
Symbols | ||
set processor: |
Targets | ||
set procfs-file: |
Process Information | ||
set procfs-trace: |
Process Information | ||
set prompt: |
Prompt | ||
set python dont-write-bytecode: |
Python Commands | ||
set python ignore-environment: |
Python Commands | ||
set python print-stack: |
Python Commands | ||
set radix: |
Numbers | ||
set range-stepping: |
Continuing and Stepping | ||
set ravenscar task-switching off: |
Ravenscar Profile | ||
set ravenscar task-switching on: |
Ravenscar Profile | ||
set record: |
Process Record and Replay | ||
set record btrace: |
Process Record and Replay | ||
set record btrace bts: |
Process Record and Replay | ||
set record btrace pt: |
Process Record and Replay | ||
set record full: |
Process Record and Replay | ||
set remote: |
Remote Configuration | ||
set remote system-call-allowed: |
system | ||
set remote-mips64-transfers-32bit-regs: |
MIPS | ||
set remotecache: |
Caching Target Data | ||
set remoteflow: |
Remote Configuration | ||
set schedule-multiple: |
All-Stop Mode | ||
set script-extension: |
Extending GDB | ||
set sh calling-convention: |
Super-H | ||
set shell: |
Cygwin Native | ||
set signal-thread: |
Hurd Native | ||
set signals, Hurd command: |
Hurd Native | ||
set sigs, Hurd command: |
Hurd Native | ||
set sigthread: |
Hurd Native | ||
set solib-absolute-prefix: |
Files | ||
set solib-search-path: |
Files | ||
set source open: |
Disable Reading Source | ||
set stack-cache: |
Caching Target Data | ||
set startup-quietly: |
Mode Options | ||
set startup-with-shell: |
Starting | ||
set step-mode: |
Continuing and Stepping | ||
set stop-on-solib-events: |
Files | ||
set stopped, Hurd command: |
Hurd Native | ||
set struct-convention: |
i386 | ||
set style: |
Output Styling | ||
set substitute-path: |
Source Path | ||
set suppress-cli-notifications: |
Other Misc Settings | ||
set sysroot: |
Files | ||
set target-charset: |
Character Sets | ||
set target-file-system-kind (unix|dos-based|auto): |
Files | ||
set target-wide-charset: |
Character Sets | ||
set task, Hurd commands: |
Hurd Native | ||
set tcp: |
Remote Configuration | ||
set thread, Hurd command: |
Hurd Native | ||
set trace-buffer-size: |
Starting and Stopping Trace Experiments | ||
set trace-commands: |
Messages/Warnings | ||
set trace-notes: |
Starting and Stopping Trace Experiments | ||
set trace-stop-notes: |
Starting and Stopping Trace Experiments | ||
set trace-user: |
Starting and Stopping Trace Experiments | ||
set trust-readonly-sections: |
Files | ||
set tui active-border-mode: |
TUI Configuration | ||
set tui border-kind: |
TUI Configuration | ||
set tui border-mode: |
TUI Configuration | ||
set tui compact-source: |
TUI Configuration | ||
set tui tab-width: |
TUI Configuration | ||
set unwind-on-terminating-exception: |
Calling | ||
set unwindonsignal: |
Calling | ||
set use-coredump-filter: |
Core File Generation | ||
set variable: |
Assignment | ||
set verbose: |
Messages/Warnings | ||
set watchdog: |
Maintenance Commands | ||
set width: |
Screen Size | ||
set write: |
Patching | ||
set-breakpoint-condition!: |
Breakpoints In Guile | ||
set-breakpoint-enabled!: |
Breakpoints In Guile | ||
set-breakpoint-hit-count!: |
Breakpoints In Guile | ||
set-breakpoint-ignore-count!: |
Breakpoints In Guile | ||
set-breakpoint-silent!: |
Breakpoints In Guile | ||
set-breakpoint-stop!: |
Breakpoints In Guile | ||
set-breakpoint-task!: |
Breakpoints In Guile | ||
set-breakpoint-thread!: |
Breakpoints In Guile | ||
set-iterator-progress!: |
Iterators In Guile | ||
set-mark (C-@): |
Miscellaneous Commands | ||
set-memory-port-read-buffer-size!: |
Memory Ports in Guile | ||
set-memory-port-write-buffer-size!: |
Memory Ports in Guile | ||
set-objfile-pretty-printers!: |
Objfiles In Guile | ||
set-parameter-value!: |
Parameters In Guile | ||
set-pretty-printer-enabled!: |
Guile Pretty Printing API | ||
set-pretty-printers!: |
Guile Pretty Printing API | ||
set-progspace-pretty-printers!: |
Progspaces In Guile | ||
set_debug_traps: |
Stub Contents | ||
share: |
Files | ||
sharedlibrary: |
Files | ||
shell: |
Shell Commands | ||
shell-transpose-words (M-C-t): |
Commands For Killing | ||
show: |
Help | ||
show ada print-signatures: |
Overloading support for Ada | ||
show ada source-charset: |
Ada Source Character Set | ||
show ada trust-PAD-over-XVS: |
Ada Glitches | ||
show agent: |
In-Process Agent | ||
show annotate: |
Annotations Overview | ||
show architecture: |
Targets | ||
show args: |
Arguments | ||
show arm: |
ARM | ||
show auto-load: |
Auto-loading | ||
show auto-load gdb-scripts: |
Auto-loading sequences | ||
show auto-load guile-scripts: |
Guile Auto-loading | ||
show auto-load libthread-db: |
libthread_db.so.1 file | ||
show auto-load local-gdbinit: |
Init File in the Current Directory | ||
show auto-load python-scripts: |
Python Auto-loading | ||
show auto-load safe-path: |
Auto-loading safe path | ||
show auto-load scripts-directory: |
objfile-gdbdotext file | ||
show auto-solib-add: |
Files | ||
show backtrace: |
Backtrace | ||
show basenames-may-differ: |
Files | ||
show breakpoint always-inserted: |
Set Breaks | ||
show breakpoint auto-hw: |
Set Breaks | ||
show breakpoint condition-evaluation: |
Set Breaks | ||
show breakpoint pending: |
Set Breaks | ||
show can-use-hw-watchpoints: |
Set Watchpoints | ||
show case-sensitive: |
Symbols | ||
show charset: |
Character Sets | ||
show check range: |
Range Checking | ||
show check type: |
Type Checking | ||
show circular-trace-buffer: |
Starting and Stopping Trace Experiments | ||
show code-cache: |
Caching Target Data | ||
show coerce-float-to-double: |
ABI | ||
show com1base: |
DJGPP Native | ||
show com1irq: |
DJGPP Native | ||
show com2base: |
DJGPP Native | ||
show com2irq: |
DJGPP Native | ||
show com3base: |
DJGPP Native | ||
show com3irq: |
DJGPP Native | ||
show com4base: |
DJGPP Native | ||
show com4irq: |
DJGPP Native | ||
show commands: |
Command History | ||
show complaints: |
Messages/Warnings | ||
show configuration: |
Help | ||
show confirm: |
Messages/Warnings | ||
show convenience: |
Convenience Vars | ||
show copying: |
Help | ||
show cp-abi: |
ABI | ||
show cwd: |
Working Directory | ||
show cygwin-exceptions: |
Cygwin Native | ||
show data-directory: |
Data Files | ||
show dcache line-size: |
Caching Target Data | ||
show dcache size: |
Caching Target Data | ||
show debug: |
Debugging Output | ||
show debug arc: |
ARC | ||
show debug auto-load: |
Auto-loading verbose mode | ||
show debug bfd-cache: |
File Caching | ||
show debug darwin: |
Darwin | ||
show debug entry-values: |
Tail Call Frames | ||
show debug libthread-db: |
Threads | ||
show debug mach-o: |
Darwin | ||
show debug mips: |
MIPS | ||
show debug monitor: |
Target Commands | ||
show debug nios2: |
Nios II | ||
show debug py-breakpoint: |
Python Commands | ||
show debug py-unwind: |
Python Commands | ||
show debug skip: |
Skipping Over Functions and Files | ||
show debug threads: |
Threads | ||
show debug tui: |
TUI Configuration | ||
show debug-file-directory: |
Separate Debug Files | ||
show debuginfod enabled: |
Debuginfod Settings | ||
show debuginfod urls: |
Debuginfod Settings | ||
show debuginfod verbose: |
Debuginfod Settings | ||
show default-collect: |
Tracepoint Actions | ||
show detach-on-fork: |
Forks | ||
show directories: |
Source Path | ||
show disassemble-next-line: |
Machine Code | ||
show disassembler-options: |
Machine Code | ||
show disassembly-flavor: |
Machine Code | ||
show disconnected-dprintf: |
Dynamic Printf | ||
show disconnected-tracing: |
Starting and Stopping Trace Experiments | ||
show displaced-stepping: |
Maintenance Commands | ||
show editing: |
Editing | ||
show environment: |
Environment | ||
show exceptions, Hurd command: |
Hurd Native | ||
show exec-done-display: |
Debugging Output | ||
show extended-prompt: |
Prompt | ||
show follow-fork-mode: |
Forks | ||
show fortran repack-array-slices: |
Special Fortran Commands | ||
show frame-filter priority: |
Frame Filter Management | ||
show gnutarget: |
Target Commands | ||
show hash, for remote monitors: |
Target Commands | ||
show height: |
Screen Size | ||
show history: |
Command History | ||
show host-charset: |
Character Sets | ||
show index-cache: |
Index Files | ||
show inferior-tty: |
Input/Output | ||
show input-radix: |
Numbers | ||
show interactive-mode: |
Other Misc Settings | ||
show language: |
Show | ||
show libthread-db-search-path: |
Threads | ||
show listsize: |
List | ||
show logging: |
Logging Output | ||
show mach-exceptions: |
Darwin | ||
show max-completions: |
Completion | ||
show max-user-call-depth: |
Define | ||
show max-value-size: |
Value Sizes | ||
show may-call-functions: |
Calling | ||
show mem inaccessible-by-default: |
Memory Region Attributes | ||
show mi-async: |
Asynchronous and non-stop modes | ||
show mips abi: |
MIPS | ||
show mips compression: |
MIPS | ||
show mips mask-address: |
MIPS | ||
show mipsfpu: |
MIPS Embedded | ||
show mpx bound: |
i386 | ||
show multiple-symbols: |
Ambiguous Expressions | ||
show new-console: |
Cygwin Native | ||
show new-group: |
Cygwin Native | ||
show non-stop: |
Non-Stop Mode | ||
show opaque-type-resolution: |
Symbols | ||
show osabi: |
ABI | ||
show output-radix: |
Numbers | ||
show overload-resolution: |
Debugging C Plus Plus | ||
show pagination: |
Screen Size | ||
show paths: |
Environment | ||
show print: |
Print Settings | ||
show print finish: |
Continuing and Stepping | ||
show print inferior-events: |
Inferiors Connections and Programs | ||
show print symbol-loading: |
Symbols | ||
show print thread-events: |
Threads | ||
show print type hex: |
Symbols | ||
show print type methods: |
Symbols | ||
show print type nested-type-limit: |
Symbols | ||
show print type typedefs: |
Symbols | ||
show processor: |
Targets | ||
show procfs-file: |
Process Information | ||
show procfs-trace: |
Process Information | ||
show prompt: |
Prompt | ||
show radix: |
Numbers | ||
show range-stepping: |
Continuing and Stepping | ||
show ravenscar task-switching: |
Ravenscar Profile | ||
show record: |
Process Record and Replay | ||
show record btrace: |
Process Record and Replay | ||
show record full: |
Process Record and Replay | ||
show remote: |
Remote Configuration | ||
show remote system-call-allowed: |
system | ||
show remote-mips64-transfers-32bit-regs: |
MIPS | ||
show remotecache: |
Caching Target Data | ||
show remoteflow: |
Remote Configuration | ||
show script-extension: |
Extending GDB | ||
show sh calling-convention: |
Super-H | ||
show shell: |
Cygwin Native | ||
show signal-thread: |
Hurd Native | ||
show signals, Hurd command: |
Hurd Native | ||
show sigs, Hurd command: |
Hurd Native | ||
show sigthread: |
Hurd Native | ||
show solib-search-path: |
Files | ||
show source open: |
Disable Reading Source | ||
show stack-cache: |
Caching Target Data | ||
show startup-quietly: |
Mode Options | ||
show stop-on-solib-events: |
Files | ||
show stopped, Hurd command: |
Hurd Native | ||
show struct-convention: |
i386 | ||
show style: |
Output Styling | ||
show substitute-path: |
Source Path | ||
show suppress-cli-notifications: |
Other Misc Settings | ||
show sysroot: |
Files | ||
show target-charset: |
Character Sets | ||
show target-file-system-kind: |
Files | ||
show target-wide-charset: |
Character Sets | ||
show task, Hurd commands: |
Hurd Native | ||
show tcp: |
Remote Configuration | ||
show thread, Hurd command: |
Hurd Native | ||
show trace-buffer-size: |
Starting and Stopping Trace Experiments | ||
show trace-notes: |
Starting and Stopping Trace Experiments | ||
show trace-stop-notes: |
Starting and Stopping Trace Experiments | ||
show trace-user: |
Starting and Stopping Trace Experiments | ||
show unwind-on-terminating-exception: |
Calling | ||
show unwindonsignal: |
Calling | ||
show user: |
Define | ||
show values: |
Value History | ||
show verbose: |
Messages/Warnings | ||
show version: |
Help | ||
show warranty: |
Help | ||
show width: |
Screen Size | ||
show write: |
Patching | ||
show-all-if-ambiguous: |
Readline Init File Syntax | ||
show-all-if-unmodified: |
Readline Init File Syntax | ||
show-mode-in-prompt: |
Readline Init File Syntax | ||
si (: |
Continuing and Stepping | ||
signal: |
Signaling | ||
signal annotation: |
Annotations for Running | ||
signal-event: |
Cygwin Native | ||
signal-name annotation: |
Annotations for Running | ||
signal-name-end annotation: |
Annotations for Running | ||
signal-string annotation: |
Annotations for Running | ||
signal-string-end annotation: |
Annotations for Running | ||
SignalEvent.stop_signal: |
Events In Python | ||
signalled annotation: |
Annotations for Running | ||
silent: |
Break Commands | ||
sim, a command: |
Embedded Processors | ||
skip: |
Skipping Over Functions and Files | ||
skip delete: |
Skipping Over Functions and Files | ||
skip disable: |
Skipping Over Functions and Files | ||
skip enable: |
Skipping Over Functions and Files | ||
skip file: |
Skipping Over Functions and Files | ||
skip function: |
Skipping Over Functions and Files | ||
skip-completed-text: |
Readline Init File Syntax | ||
skip-csi-sequence (): |
Miscellaneous Commands | ||
source: |
Command Files | ||
source annotation: |
Source Annotations | ||
start: |
Starting | ||
start-kbd-macro (C-x (): |
Keyboard Macros | ||
starti: |
Starting | ||
starting annotation: |
Annotations for Running | ||
STDERR: |
Basic Python | ||
STDERR: |
Basic Python | ||
stdio-port?: |
I/O Ports in Guile | ||
STDLOG: |
Basic Python | ||
STDLOG: |
Basic Python | ||
STDOUT: |
Basic Python | ||
STDOUT: |
Basic Python | ||
step: |
Continuing and Stepping | ||
step&: |
Background Execution | ||
stepi: |
Continuing and Stepping | ||
stepi&: |
Background Execution | ||
stop, a pseudo-command: |
Hooks | ||
stopping annotation: |
Annotations for Running | ||
strace: |
Create and Delete Tracepoints | ||
string->argv: |
Commands In Guile | ||
symbol-addr-class: |
Symbols In Guile | ||
symbol-argument?: |
Symbols In Guile | ||
symbol-constant?: |
Symbols In Guile | ||
symbol-file: |
Files | ||
symbol-function?: |
Symbols In Guile | ||
symbol-line: |
Symbols In Guile | ||
symbol-linkage-name: |
Symbols In Guile | ||
symbol-name: |
Symbols In Guile | ||
symbol-needs-frame?: |
Symbols In Guile | ||
symbol-print-name: |
Symbols In Guile | ||
symbol-symtab: |
Symbols In Guile | ||
symbol-type: |
Symbols In Guile | ||
symbol-valid?: |
Symbols In Guile | ||
symbol-value: |
Symbols In Guile | ||
symbol-variable?: |
Symbols In Guile | ||
Symbol.addr_class: |
Symbols In Python | ||
Symbol.is_argument: |
Symbols In Python | ||
Symbol.is_constant: |
Symbols In Python | ||
Symbol.is_function: |
Symbols In Python | ||
Symbol.is_valid: |
Symbols In Python | ||
Symbol.is_variable: |
Symbols In Python | ||
Symbol.line: |
Symbols In Python | ||
Symbol.linkage_name: |
Symbols In Python | ||
Symbol.name: |
Symbols In Python | ||
Symbol.needs_frame: |
Symbols In Python | ||
Symbol.print_name: |
Symbols In Python | ||
Symbol.symtab: |
Symbols In Python | ||
Symbol.type: |
Symbols In Python | ||
Symbol.value: |
Symbols In Python | ||
symbol?: |
Symbols In Guile | ||
SYMBOL_COMMON_BLOCK_DOMAIN: |
Symbols In Python | ||
SYMBOL_FUNCTIONS_DOMAIN: |
Symbols In Guile | ||
SYMBOL_LABEL_DOMAIN: |
Symbols In Python | ||
SYMBOL_LABEL_DOMAIN: |
Symbols In Guile | ||
SYMBOL_LOC_ARG: |
Symbols In Python | ||
SYMBOL_LOC_ARG: |
Symbols In Guile | ||
SYMBOL_LOC_BLOCK: |
Symbols In Python | ||
SYMBOL_LOC_BLOCK: |
Symbols In Guile | ||
SYMBOL_LOC_COMMON_BLOCK: |
Symbols In Python | ||
SYMBOL_LOC_COMPUTED: |
Symbols In Python | ||
SYMBOL_LOC_COMPUTED: |
Symbols In Guile | ||
SYMBOL_LOC_CONST: |
Symbols In Python | ||
SYMBOL_LOC_CONST: |
Symbols In Guile | ||
SYMBOL_LOC_CONST_BYTES: |
Symbols In Python | ||
SYMBOL_LOC_CONST_BYTES: |
Symbols In Guile | ||
SYMBOL_LOC_LABEL: |
Symbols In Python | ||
SYMBOL_LOC_LOCAL: |
Symbols In Python | ||
SYMBOL_LOC_LOCAL: |
Symbols In Guile | ||
SYMBOL_LOC_OPTIMIZED_OUT: |
Symbols In Python | ||
SYMBOL_LOC_OPTIMIZED_OUT: |
Symbols In Guile | ||
SYMBOL_LOC_REF_ARG: |
Symbols In Python | ||
SYMBOL_LOC_REF_ARG: |
Symbols In Guile | ||
SYMBOL_LOC_REGISTER: |
Symbols In Python | ||
SYMBOL_LOC_REGISTER: |
Symbols In Guile | ||
SYMBOL_LOC_REGPARM_ADDR: |
Symbols In Python | ||
SYMBOL_LOC_REGPARM_ADDR: |
Symbols In Guile | ||
SYMBOL_LOC_STATIC: |
Symbols In Python | ||
SYMBOL_LOC_STATIC: |
Symbols In Guile | ||
SYMBOL_LOC_TYPEDEF: |
Symbols In Python | ||
SYMBOL_LOC_TYPEDEF: |
Symbols In Guile | ||
SYMBOL_LOC_UNDEF: |
Symbols In Python | ||
SYMBOL_LOC_UNDEF: |
Symbols In Guile | ||
SYMBOL_LOC_UNRESOLVED: |
Symbols In Python | ||
SYMBOL_LOC_UNRESOLVED: |
Symbols In Guile | ||
SYMBOL_MODULE_DOMAIN: |
Symbols In Python | ||
SYMBOL_STRUCT_DOMAIN: |
Symbols In Python | ||
SYMBOL_STRUCT_DOMAIN: |
Symbols In Guile | ||
SYMBOL_TYPES_DOMAIN: |
Symbols In Guile | ||
SYMBOL_UNDEF_DOMAIN: |
Symbols In Python | ||
SYMBOL_UNDEF_DOMAIN: |
Symbols In Guile | ||
SYMBOL_VARIABLES_DOMAIN: |
Symbols In Guile | ||
SYMBOL_VAR_DOMAIN: |
Symbols In Python | ||
SYMBOL_VAR_DOMAIN: |
Symbols In Guile | ||
symtab-filename: |
Symbol Tables In Guile | ||
symtab-fullname: |
Symbol Tables In Guile | ||
symtab-global-block: |
Symbol Tables In Guile | ||
symtab-objfile: |
Symbol Tables In Guile | ||
symtab-static-block: |
Symbol Tables In Guile | ||
symtab-valid?: |
Symbol Tables In Guile | ||
Symtab.filename: |
Symbol Tables In Python | ||
Symtab.fullname: |
Symbol Tables In Python | ||
Symtab.global_block: |
Symbol Tables In Python | ||
Symtab.is_valid: |
Symbol Tables In Python | ||
Symtab.linetable: |
Symbol Tables In Python | ||
Symtab.objfile: |
Symbol Tables In Python | ||
Symtab.producer: |
Symbol Tables In Python | ||
Symtab.static_block: |
Symbol Tables In Python | ||
symtab?: |
Symbol Tables In Guile | ||
Symtab_and_line.is_valid: |
Symbol Tables In Python | ||
Symtab_and_line.last: |
Symbol Tables In Python | ||
Symtab_and_line.line: |
Symbol Tables In Python | ||
Symtab_and_line.pc: |
Symbol Tables In Python | ||
Symtab_and_line.symtab: |
Symbol Tables In Python | ||
sysinfo: |
DJGPP Native | ||
|
|
|||
| T | |||
taas: |
Threads | ||
tab-insert (M-TAB): |
Commands For Text | ||
tabset: |
TUI Configuration | ||
target: |
Target Commands | ||
target ctf: |
Trace Files | ||
target record: |
Process Record and Replay | ||
target record-btrace: |
Process Record and Replay | ||
target record-full: |
Process Record and Replay | ||
target sim: |
OpenRISC 1000 | ||
target tfile: |
Trace Files | ||
target-config: |
Guile Configuration | ||
TargetConnection.description: |
Connections In Python | ||
TargetConnection.details: |
Connections In Python | ||
TargetConnection.is_valid: |
Connections In Python | ||
TargetConnection.num: |
Connections In Python | ||
TargetConnection.type: |
Connections In Python | ||
task (Ada): |
Ada Tasks | ||
tbreak: |
Set Breaks | ||
tcatch: |
Set Catchpoints | ||
tdump: |
tdump | ||
teval (tracepoints): |
Tracepoint Actions | ||
tfaas: |
Threads | ||
tfile: |
Trace Files | ||
tfind: |
tfind | ||
thbreak: |
Set Breaks | ||
this, inside C++ member functions: |
C Plus Plus Expressions | ||
thread apply: |
Threads | ||
thread find: |
Threads | ||
thread name: |
Threads | ||
thread thread-id: |
Threads | ||
thread-info: |
GDB/MI Support Commands | ||
ThreadEvent.inferior_thread: |
Events In Python | ||
throw-user-error: |
Commands In Guile | ||
tilde-expand (M-~): |
Miscellaneous Commands | ||
trace: |
Create and Delete Tracepoints | ||
transpose-chars (C-t): |
Commands For Text | ||
transpose-words (M-t): |
Commands For Text | ||
tsave: |
Trace Files | ||
tstart [ notes ]: |
Starting and Stopping Trace Experiments | ||
tstatus: |
Starting and Stopping Trace Experiments | ||
tstop [ notes ]: |
Starting and Stopping Trace Experiments | ||
tty: |
Input/Output | ||
tui disable: |
TUI Commands | ||
tui enable: |
TUI Commands | ||
tui layout: |
TUI Commands | ||
tui new-layout: |
TUI Commands | ||
tui refresh: |
TUI Commands | ||
tui reg: |
TUI Commands | ||
tui window height: |
TUI Commands | ||
tui window width: |
TUI Commands | ||
TuiWindow.erase: |
TUI Windows In Python | ||
TuiWindow.height: |
TUI Windows In Python | ||
TuiWindow.is_valid: |
TUI Windows In Python | ||
TuiWindow.title: |
TUI Windows In Python | ||
TuiWindow.width: |
TUI Windows In Python | ||
TuiWindow.write: |
TUI Windows In Python | ||
tvariable: |
Trace State Variables | ||
type-array: |
Types In Guile | ||
type-code: |
Types In Guile | ||
type-const: |
Types In Guile | ||
type-field: |
Types In Guile | ||
type-fields: |
Types In Guile | ||
type-has-field-deep?: |
Guile Types Module | ||
type-has-field?: |
Types In Guile | ||
type-name: |
Types In Guile | ||
type-num-fields: |
Types In Guile | ||
type-pointer: |
Types In Guile | ||
type-print-name: |
Types In Guile | ||
type-range: |
Types In Guile | ||
type-reference: |
Types In Guile | ||
type-sizeof: |
Types In Guile | ||
type-strip-typedefs: |
Types In Guile | ||
type-tag: |
Types In Guile | ||
type-target: |
Types In Guile | ||
type-unqualified: |
Types In Guile | ||
type-vector: |
Types In Guile | ||
type-volatile: |
Types In Guile | ||
Type.alignof: |
Types In Python | ||
Type.array: |
Types In Python | ||
Type.code: |
Types In Python | ||
Type.const: |
Types In Python | ||
Type.dynamic: |
Types In Python | ||
Type.fields: |
Types In Python | ||
Type.is_scalar: |
Types In Python | ||
Type.is_signed: |
Types In Python | ||
Type.name: |
Types In Python | ||
Type.objfile: |
Types In Python | ||
Type.optimized_out: |
Types In Python | ||
Type.pointer: |
Types In Python | ||
Type.range: |
Types In Python | ||
Type.reference: |
Types In Python | ||
Type.sizeof: |
Types In Python | ||
Type.strip_typedefs: |
Types In Python | ||
Type.tag: |
Types In Python | ||
Type.target: |
Types In Python | ||
Type.template_argument: |
Types In Python | ||
Type.unqualified: |
Types In Python | ||
Type.vector: |
Types In Python | ||
Type.volatile: |
Types In Python | ||
type?: |
Types In Guile | ||
TYPE_CODE_ARRAY: |
Types In Python | ||
TYPE_CODE_ARRAY: |
Types In Guile | ||
TYPE_CODE_BITSTRING: |
Types In Python | ||
TYPE_CODE_BITSTRING: |
Types In Guile | ||
TYPE_CODE_BOOL: |
Types In Python | ||
TYPE_CODE_BOOL: |
Types In Guile | ||
TYPE_CODE_CHAR: |
Types In Python | ||
TYPE_CODE_CHAR: |
Types In Guile | ||
TYPE_CODE_COMPLEX: |
Types In Python | ||
TYPE_CODE_COMPLEX: |
Types In Guile | ||
TYPE_CODE_DECFLOAT: |
Types In Python | ||
TYPE_CODE_DECFLOAT: |
Types In Guile | ||
TYPE_CODE_ENUM: |
Types In Python | ||
TYPE_CODE_ENUM: |
Types In Guile | ||
TYPE_CODE_ERROR: |
Types In Python | ||
TYPE_CODE_ERROR: |
Types In Guile | ||
TYPE_CODE_FIXED_POINT: |
Types In Python | ||
TYPE_CODE_FIXED_POINT: |
Types In Guile | ||
TYPE_CODE_FLAGS: |
Types In Python | ||
TYPE_CODE_FLAGS: |
Types In Guile | ||
TYPE_CODE_FLT: |
Types In Python | ||
TYPE_CODE_FLT: |
Types In Guile | ||
TYPE_CODE_FUNC: |
Types In Python | ||
TYPE_CODE_FUNC: |
Types In Guile | ||
TYPE_CODE_INT: |
Types In Python | ||
TYPE_CODE_INT: |
Types In Guile | ||
TYPE_CODE_INTERNAL_FUNCTION: |
Types In Python | ||
TYPE_CODE_INTERNAL_FUNCTION: |
Types In Guile | ||
TYPE_CODE_MEMBERPTR: |
Types In Python | ||
TYPE_CODE_MEMBERPTR: |
Types In Guile | ||
TYPE_CODE_METHOD: |
Types In Python | ||
TYPE_CODE_METHOD: |
Types In Guile | ||
TYPE_CODE_METHODPTR: |
Types In Python | ||
TYPE_CODE_METHODPTR: |
Types In Guile | ||
TYPE_CODE_NAMESPACE: |
Types In Python | ||
TYPE_CODE_NAMESPACE: |
Types In Python | ||
TYPE_CODE_NAMESPACE: |
Types In Guile | ||
TYPE_CODE_NAMESPACE: |
Types In Guile | ||
TYPE_CODE_PTR: |
Types In Python | ||
TYPE_CODE_PTR: |
Types In Guile | ||
TYPE_CODE_RANGE: |
Types In Python | ||
TYPE_CODE_RANGE: |
Types In Guile | ||
TYPE_CODE_REF: |
Types In Python | ||
TYPE_CODE_REF: |
Types In Guile | ||
TYPE_CODE_RVALUE_REF: |
Types In Python | ||
TYPE_CODE_RVALUE_REF: |
Types In Guile | ||
TYPE_CODE_SET: |
Types In Python | ||
TYPE_CODE_SET: |
Types In Guile | ||
TYPE_CODE_STRING: |
Types In Python | ||
TYPE_CODE_STRING: |
Types In Guile | ||
TYPE_CODE_STRUCT: |
Types In Python | ||
TYPE_CODE_STRUCT: |
Types In Guile | ||
TYPE_CODE_TYPEDEF: |
Types In Python | ||
TYPE_CODE_TYPEDEF: |
Types In Guile | ||
TYPE_CODE_UNION: |
Types In Python | ||
TYPE_CODE_UNION: |
Types In Guile | ||
TYPE_CODE_VOID: |
Types In Python | ||
TYPE_CODE_VOID: |
Types In Guile | ||
TYPE_CODE_XMETHOD: |
Types In Python | ||
TYPE_CODE_XMETHOD: |
Types In Guile | ||
|
|
|||
| U | |||
u (SingleKey TUI key): |
TUI Single Key Mode | ||
u (: |
Continuing and Stepping | ||
undefined-command-error-code: |
GDB/MI Support Commands | ||
undisplay: |
Auto Display | ||
undo (C-_ or C-x C-u): |
Miscellaneous Commands | ||
universal-argument (): |
Numeric Arguments | ||
unix-filename-rubout (): |
Commands For Killing | ||
unix-line-discard (C-u): |
Commands For Killing | ||
unix-word-rubout (C-w): |
Commands For Killing | ||
unset environment: |
Environment | ||
unset substitute-path: |
Source Path | ||
until: |
Continuing and Stepping | ||
until&: |
Background Execution | ||
unwind-stop-reason-string: |
Frames In Guile | ||
up: |
Selection | ||
Up: |
TUI Keys | ||
up-silently: |
Selection | ||
upcase-word (M-u): |
Commands For Text | ||
update: |
TUI Commands | ||
|
|
|||
| V | |||
v (SingleKey TUI key): |
TUI Single Key Mode | ||
value->bool: |
Values From Inferior In Guile | ||
value->bytevector: |
Values From Inferior In Guile | ||
value->integer: |
Values From Inferior In Guile | ||
value->lazy-string: |
Values From Inferior In Guile | ||
value->real: |
Values From Inferior In Guile | ||
value->string: |
Values From Inferior In Guile | ||
value-abs: |
Arithmetic In Guile | ||
value-add: |
Arithmetic In Guile | ||
value-address: |
Values From Inferior In Guile | ||
value-call: |
Values From Inferior In Guile | ||
value-cast: |
Values From Inferior In Guile | ||
value-const-value: |
Values From Inferior In Guile | ||
value-dereference: |
Values From Inferior In Guile | ||
value-div: |
Arithmetic In Guile | ||
value-dynamic-cast: |
Values From Inferior In Guile | ||
value-dynamic-type: |
Values From Inferior In Guile | ||
value-fetch-lazy!: |
Values From Inferior In Guile | ||
value-field: |
Values From Inferior In Guile | ||
value-lazy?: |
Values From Inferior In Guile | ||
value-logand: |
Arithmetic In Guile | ||
value-logior: |
Arithmetic In Guile | ||
value-lognot: |
Arithmetic In Guile | ||
value-logxor: |
Arithmetic In Guile | ||
value-lsh: |
Arithmetic In Guile | ||
value-max: |
Arithmetic In Guile | ||
value-min: |
Arithmetic In Guile | ||
value-mod: |
Arithmetic In Guile | ||
value-mul: |
Arithmetic In Guile | ||
value-neg: |
Arithmetic In Guile | ||
value-not: |
Arithmetic In Guile | ||
value-optimized-out?: |
Values From Inferior In Guile | ||
value-pos: |
Arithmetic In Guile | ||
value-pow: |
Arithmetic In Guile | ||
value-print: |
Values From Inferior In Guile | ||
value-reference-value: |
Values From Inferior In Guile | ||
value-referenced-value: |
Values From Inferior In Guile | ||
value-reinterpret-cast: |
Values From Inferior In Guile | ||
value-rem: |
Arithmetic In Guile | ||
value-rsh: |
Arithmetic In Guile | ||
value-rvalue-reference-value: |
Values From Inferior In Guile | ||
value-sub: |
Arithmetic In Guile | ||
value-subscript: |
Values From Inferior In Guile | ||
value-type: |
Values From Inferior In Guile | ||
Value.address: |
Values From Inferior | ||
Value.cast: |
Values From Inferior | ||
Value.const_value: |
Values From Inferior | ||
Value.dereference: |
Values From Inferior | ||
Value.dynamic_cast: |
Values From Inferior | ||
Value.dynamic_type: |
Values From Inferior | ||
Value.fetch_lazy: |
Values From Inferior | ||
Value.format_string: |
Values From Inferior | ||
Value.is_lazy: |
Values From Inferior | ||
Value.is_optimized_out: |
Values From Inferior | ||
Value.lazy_string: |
Values From Inferior | ||
Value.referenced_value: |
Values From Inferior | ||
Value.reference_value: |
Values From Inferior | ||
Value.reinterpret_cast: |
Values From Inferior | ||
Value.string: |
Values From Inferior | ||
Value.type: |
Values From Inferior | ||
Value.__init__: |
Values From Inferior | ||
Value.__init__: |
Values From Inferior | ||
value<=?: |
Arithmetic In Guile | ||
value<?: |
Arithmetic In Guile | ||
value=?: |
Arithmetic In Guile | ||
value>=?: |
Arithmetic In Guile | ||
value>?: |
Arithmetic In Guile | ||
value?: |
Values From Inferior In Guile | ||
vi-cmd-mode-string: |
Readline Init File Syntax | ||
vi-editing-mode (M-C-j): |
Miscellaneous Commands | ||
vi-ins-mode-string: |
Readline Init File Syntax | ||
visible-stats: |
Readline Init File Syntax | ||
|
|
|||
| W | |||
w (SingleKey TUI key): |
TUI Single Key Mode | ||
w (: |
Command Settings | ||
watch: |
Set Watchpoints | ||
watchpoint annotation: |
Annotations for Running | ||
whatis: |
Symbols | ||
where: |
Backtrace | ||
while: |
Command Files | ||
while-stepping (tracepoints): |
Tracepoint Actions | ||
Window.click: |
TUI Windows In Python | ||
Window.close: |
TUI Windows In Python | ||
Window.hscroll: |
TUI Windows In Python | ||
Window.render: |
TUI Windows In Python | ||
Window.vscroll: |
TUI Windows In Python | ||
winheight: |
TUI Commands | ||
winwidth: |
TUI Commands | ||
with command: |
Command Settings | ||
WP_ACCESS: |
Breakpoints In Python | ||
WP_ACCESS: |
Breakpoints In Guile | ||
WP_READ: |
Breakpoints In Python | ||
WP_READ: |
Breakpoints In Guile | ||
WP_WRITE: |
Breakpoints In Python | ||
WP_WRITE: |
Breakpoints In Guile | ||
|
|
|||
| X | |||
x (examine memory): |
Memory | ||
x(examine), and info line: |
Machine Code | ||
XMethod.__init__: |
Xmethod API | ||
XMethodMatcher.match: |
Xmethod API | ||
XMethodMatcher.__init__: |
Xmethod API | ||
XMethodWorker.get_arg_types: |
Xmethod API | ||
XMethodWorker.get_result_type: |
Xmethod API | ||
XMethodWorker.__call__: |
Xmethod API | ||
|
|
|||
| Y | |||
yank (C-y): |
Commands For Killing | ||
yank-last-arg (M-. or M-_): |
Commands For History | ||
yank-nth-arg (M-C-y): |
Commands For History | ||
yank-pop (M-y): |
Commands For Killing | ||
|
|
| Jump to: | ! # $ — : < @ ^ _ | A B C D E F G H I J K L M N O P Q R S T U V W X Y |
|---|
Программа gdb — это популярный отладчик для программ, написанных на языке программирования Си и С++. Отладчик позволяет выполнить программу пошагово, посмотреть значения всех переменных на каждом из этапов выполнения, а если это необходимо, то и дизассемблировать код и посмотреть состояние регистров процессора.
В сегодняшней статье мы рассмотрим как пользоваться gdb для отладки и анализа выполнения программ, написанных на Си. Попытаемся разобраться с основными возможностями программы.
1. Установка gdb
Обычно, отладчик устанавливается вместе с другими инструментами для сборки программного обеспечения. Для установки всего необходимого в Ubuntu или Debian достаточно выполнить:
sudo apt install build-essential
Для того чтобы установить отладчик отдельно, выполните:
sudo apt install gdb
В CentOS или Fedora команда установки будет выглядеть следующим образом:
sudo dnf install gdb
А для Arch Linux надо выполнить:
sudo pacman -S gdb
Теперь отладчик gdb установлен и вы можете его использовать.
2. Компиляция программы
Для того чтобы получить максимум полезной информации во время отладки, например, имена переменных и номера строк кода программу следует скомпилировать особым образом. Для примеров из этой статьи мы будем использовать такую небольшую программу на Си, в процессе будем её изменять, но начнём с этого:
vi program.c
#include <stdio.h>
int main(){
int var1 = 0;
int var2 = 2;
char greeting[] = "Hello from losstn";
printf("%s", greeting);
}
Для того чтобы всё необходимое было включено в исполняемый файл, программу надо собрать с опцией -g. В данном случае команда будет выглядеть вот так:
gcc -g -o program program.c
Затем вы можете её выполнить:
./program
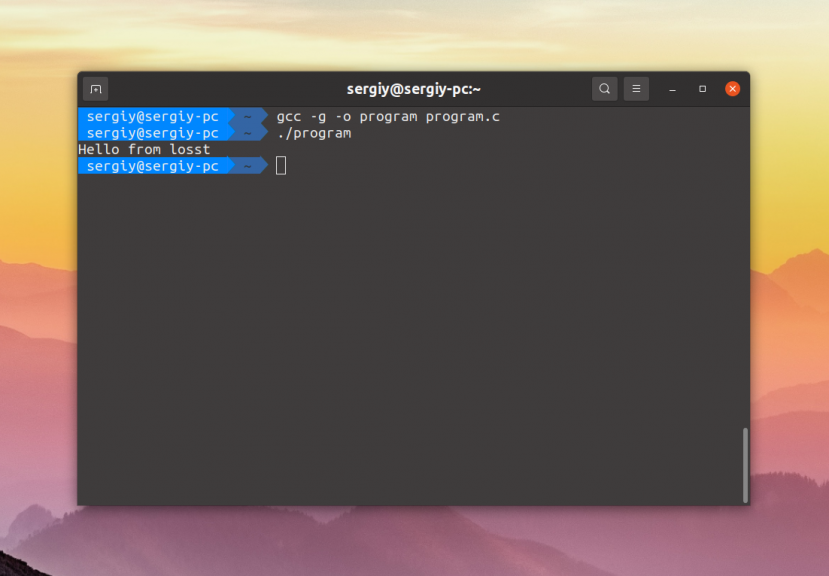
3. Запуск отладчика
Для того чтобы запустить программу достаточно передать путь к ней отладчику. Какие-либо опции указывать не обязательно:
gdb ./program
После запуска отладчика вы попадаете в его командный интерфейс. Программа ещё не запущена, запущен только отладчик, в котором вы можете ею управлять с помощью специальных команд. Вот основные команды gdb:
- break или b — создание точки останова;
- info или i — вывести информацию, доступные значения: break, registers, frame, locals, args;
- run или r — запустить программу;
- continue или c — продолжить выполнение программы после точки останова;
- step или s — выполнить следующую строчку программы с заходом в функцию;
- next или n — выполнить следующую строчку без захода в функцию;
- print или p — вывести значение переменной;
- backtrace или bt — вывести стек вызовов;
- x — просмотр содержимого памяти по адресу;
- ptype — просмотр типа переменной;
- h или help — просмотр справки по команде;
- q или quit — выход из программы.
4. Запуск программы
Для того чтобы запустить программу надо воспользоваться командой run в консоли gdb. Просто выполните:
(gdb) run
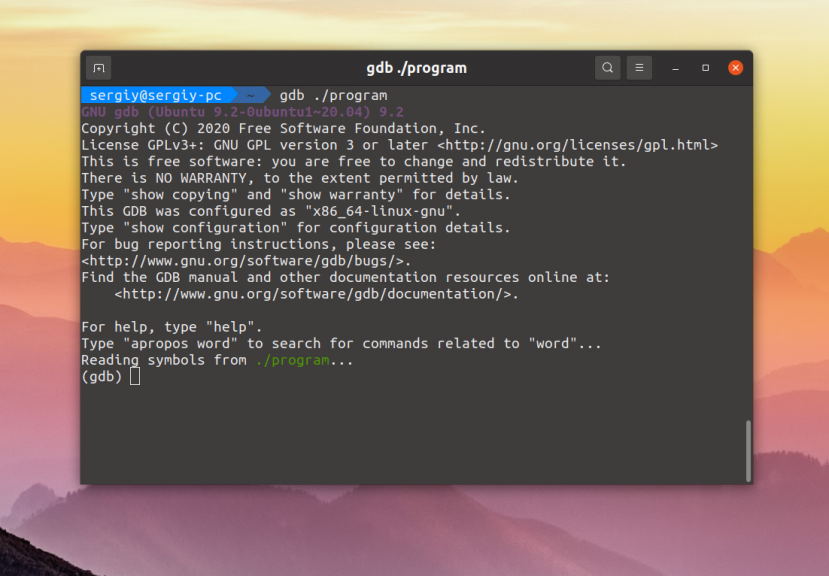
И программа будет запущена и выполнена. Если вам надо передать программе какие-либо аргументы, то следует их передать команде run, например:
(gdb) run arg1 arg2
Если программа завершилась с ошибкой, вы можете вывести стек вызовов функций для того чтобы узнать в какой именно функции возникла ошибка:
(gdb) backtrace
Программа сообщает на какой строчке исходного кода возникла проблема. Чтобы посмотреть весь исходник выполните команду list:
(gdb) list
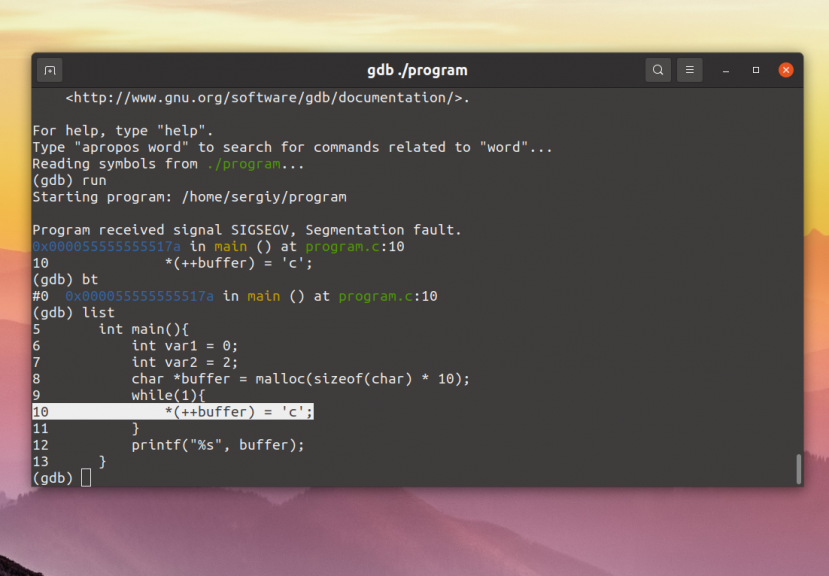
Для того чтобы вызвать ошибку Segmentation Fault и проверить как это работает можете добавить в программу такие строки и перекомпилировать её:
char *buffer = malloc(sizeof(char) * 10);
while(1){
*(++buffer) = 'c';
}
Тут мы выделяем из памяти массив символов размером 10 элементов и заполняем его и память, которая находится за ним символами «с», пока программа не упадёт.
5. Точки останова
Неотъемлемая часть отладки приложения — это точки останова. С помощью них можно остановить выполнение программы на любом месте исходного кода или функции, а затем проанализировать все переменные, а также что происходит с программой. Сначала смотрим исходник программы:
(gdb) list
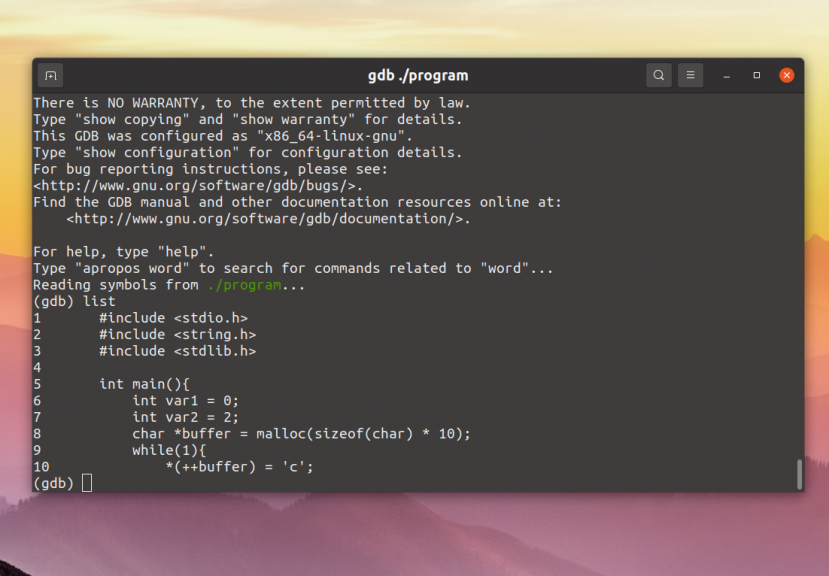
По умолчанию команда выводит первые десять строк. Ей можно передать в качестве аргумента номер строки, строки возле которой надо отобразить или имя функции, например:
(gdb) list 10
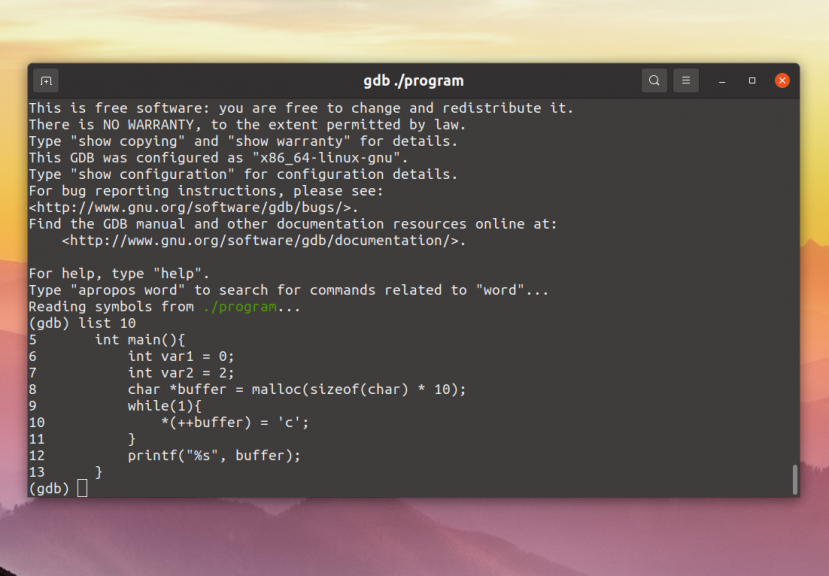
Например, давайте установим точку останова на восьмой строчке исходника:
(gdb) break 8
Теперь, когда вы запустите программу на выполнение она остановиться в указанной точке:
(gdb) run
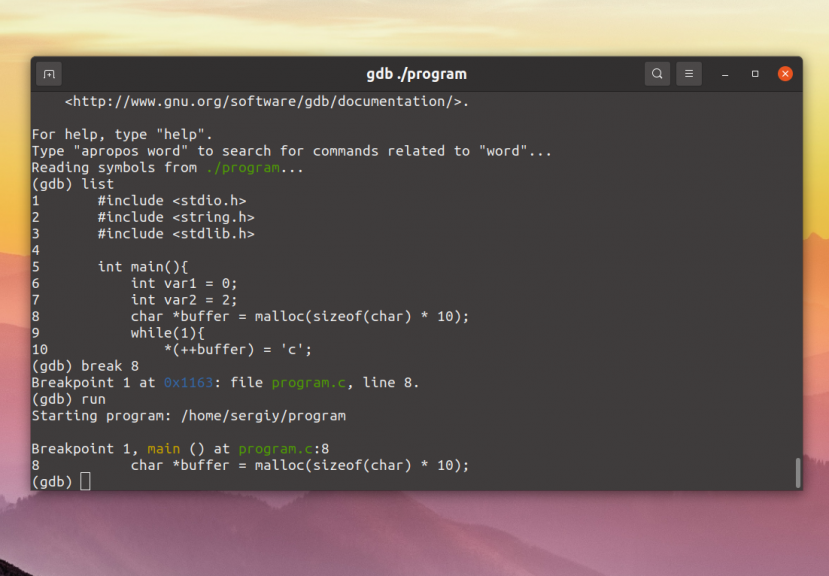
Для того чтобы выполнить следующую строчку без входа в функцию используйте команду next:
(gdb) next
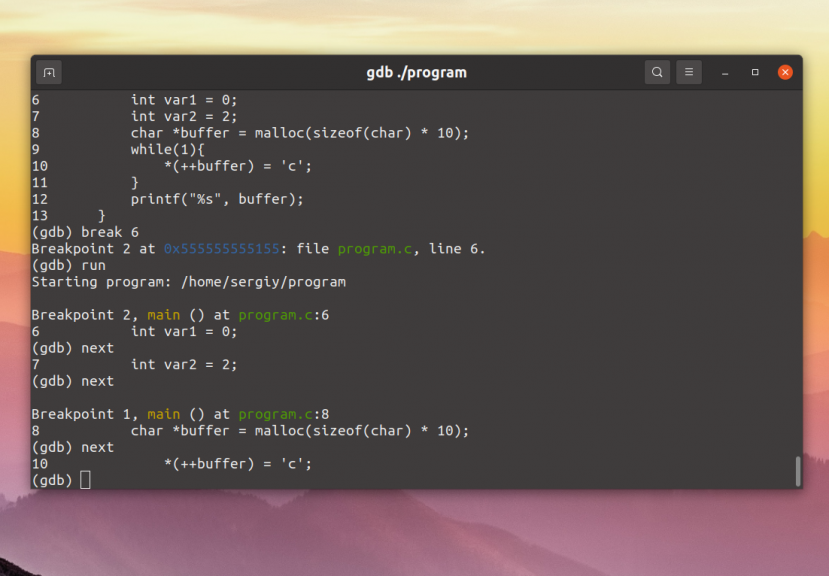
Тогда выполнится следующая строка кода в программе. Если надо войти в функцию и посмотреть что в ней происходит следует использовать команду step:
(gdb) step
Для отладки циклов можно устанавливать точки останова на основе условия, например, на 11-той строке, если значение переменной var1 будет 20:
(gdb) break 11 if var1==20
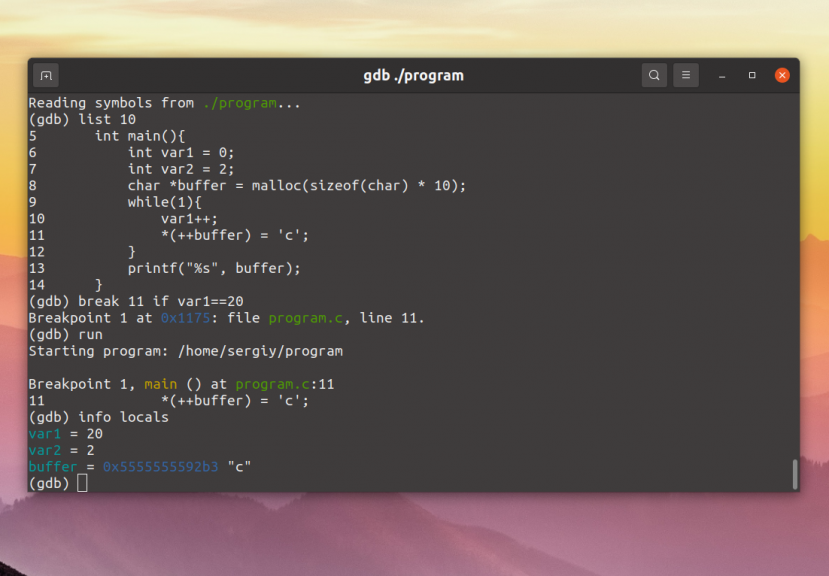
Чтобы этот пример заработал добавьте в код цикла следующую строчку, как на снимке:
var1++;
Посмотреть все установленные точки останова можно такой командой:
info breakpoints
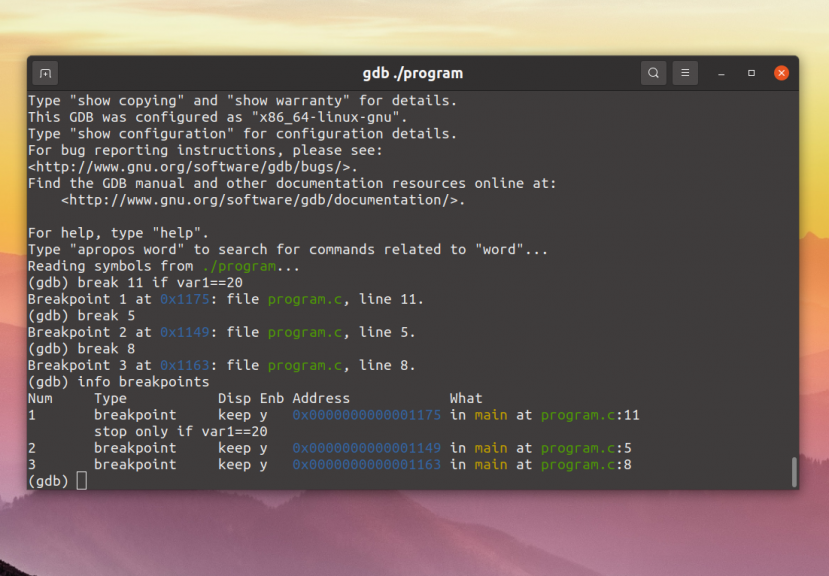
6. Вывод информации
Сами по себе точки останова не очень полезны, но после каждой остановки программы можно посмотреть полностью её состояние и значения всех переменных, а это уже намного интереснее. Для просмотра информации используется команда info, а для вывода значения конкретной переменной — print. Для того чтобы посмотреть значения всех локальных переменных выполните:
(gdb) info locals
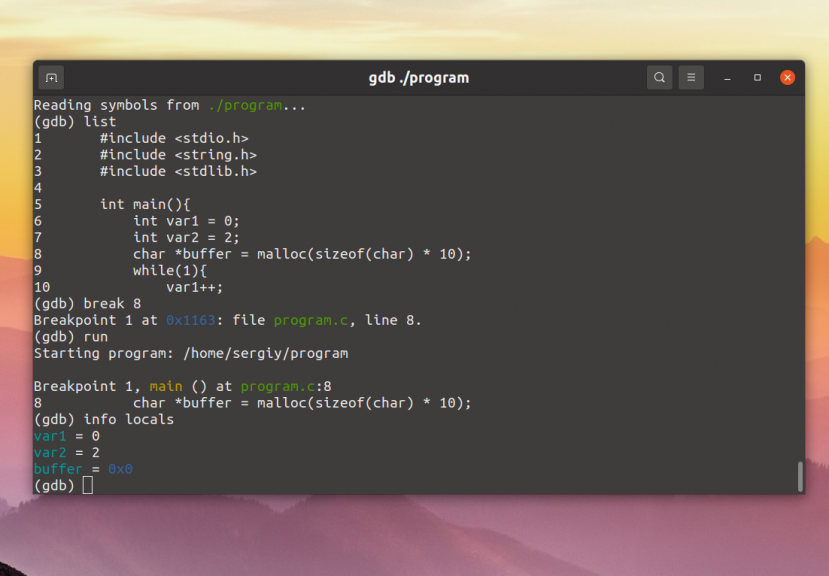
А для вывода значений аргументов функции:
(gdb) info args
Вывести значение определённой переменной можно с помощью print:
(gdb) print var1
Интересно, что с помощью print можно выполнять арифметические операции и их результат не только выводится на экран, но и присваивается внутренней переменной, таким образом его можно будет вывести ещё раз позже или использовать в других вычислениях. Например:
(gdb) print var1+30
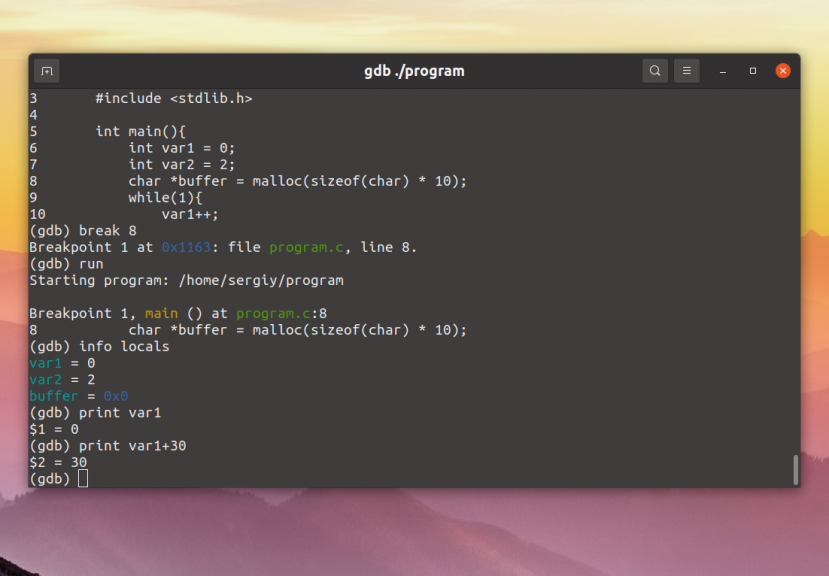
Имя временной переменной, куда были записаны данные отображается перед самим результатом, например, в последней команде это $2. Теперь можно ещё раз вывести это значение:
(gdb) print $2
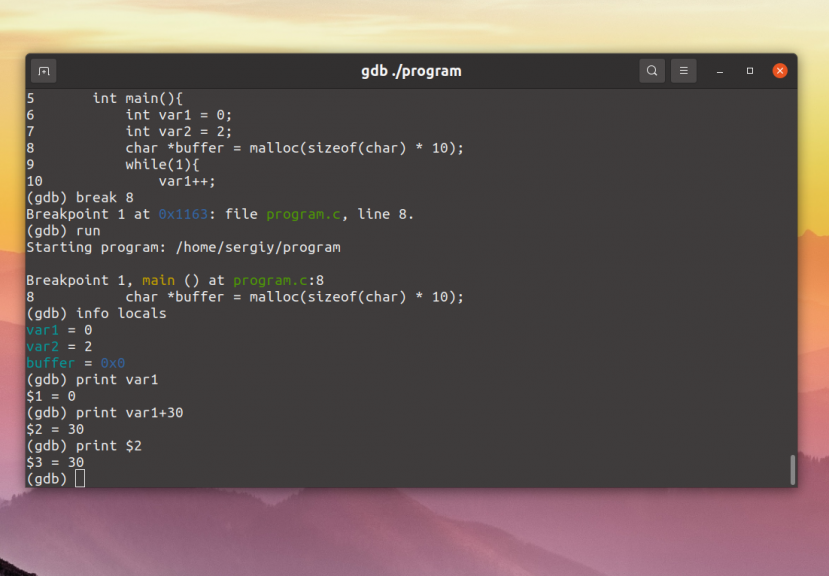
Таким образом вы можете анализировать состояние программы, на каждой точке останова и искать ошибки.
7. Изменение информации
С помощью команды set можно изменить значение переменной прямо во время выполнения программы. Например:
(gdb) break 7
(gdb) run
(gdb) set var2 = 20
(gdb) print var2
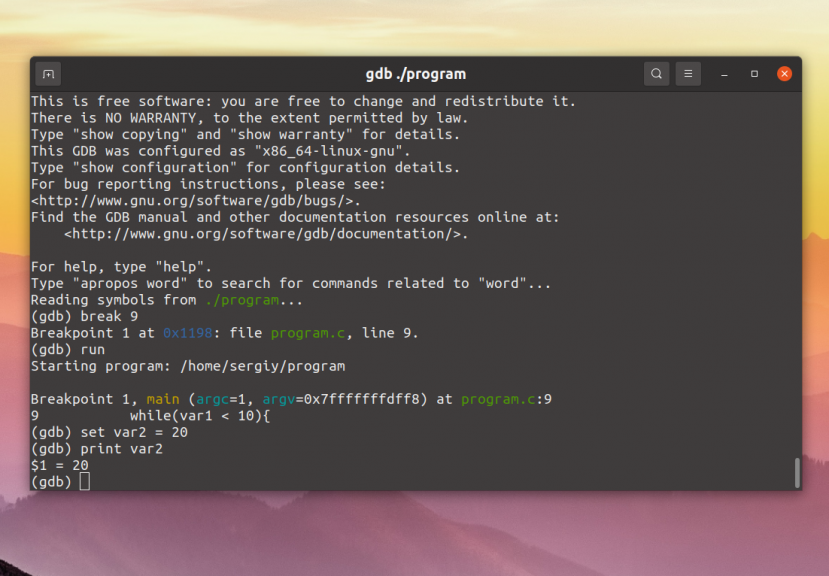
8. Вывод типа
С помощью команды ptype вы можете вывести тип переменной. Например:
(gdb) break 7
(gdb) run
(gdb) ptype var2
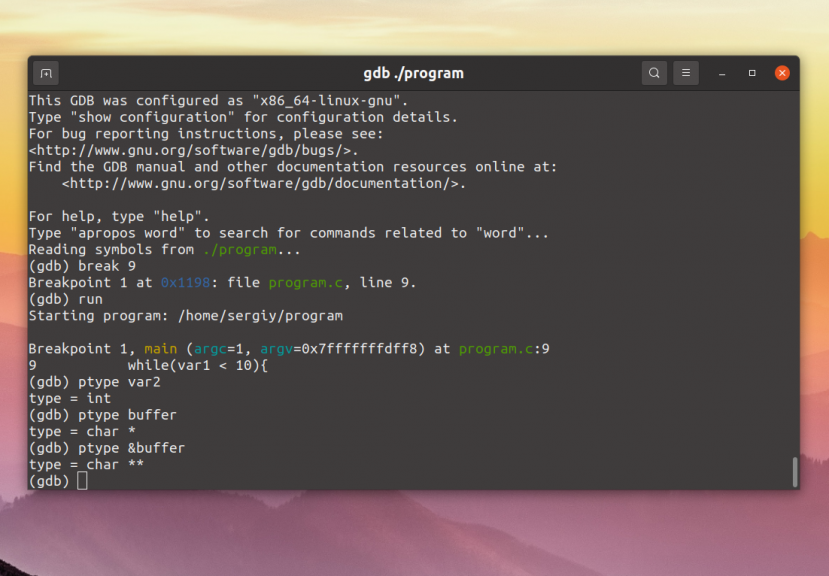
9. Просмотр адресов
Ещё интереснее исследовать как программы на Си работают с памятью. Команда print может выводить не только выводить значения переменных, но и их адреса в памяти. Приведите программу к такому виду и перекомпилируйте её:
#include <stdio.h>
#include <string.h>
#include <stdlib.h>
int main(int argc, char *argv[]){
int var1 = 0;
int var2 = 2;
char *buffer = malloc(sizeof(char) * 10);
while(var1 < 10){
var1++;
*(++buffer) = 'c';
}
printf("%sn", buffer);
}
Запустите отладчик и установите точку останова на девятой строке и запустите программу:
(gdb) break 9
(gdb) run
Теперь вы можете вывести адреса всех переменных в памяти с помощью символа &. Например:
(gdb) print &argc
(gdb) print &var1
(gdb) print &buffer
(gdb) print buffer
Как видите, аргументы функции находятся в одном месте, локальные переменные в другому, но не очень далеко, а во память выделенная из кучи, на которую указывает указатель buffer — совсем далеко. Можете поменять программу и поэкспериментировать с разным количеством переменных.
10. Просмотр памяти
С помощью команды x или eXamine можно посмотреть содержимое памяти, по определённому адресу. Например, смотрим содержимое переменной var2:
(gdb) x &var2
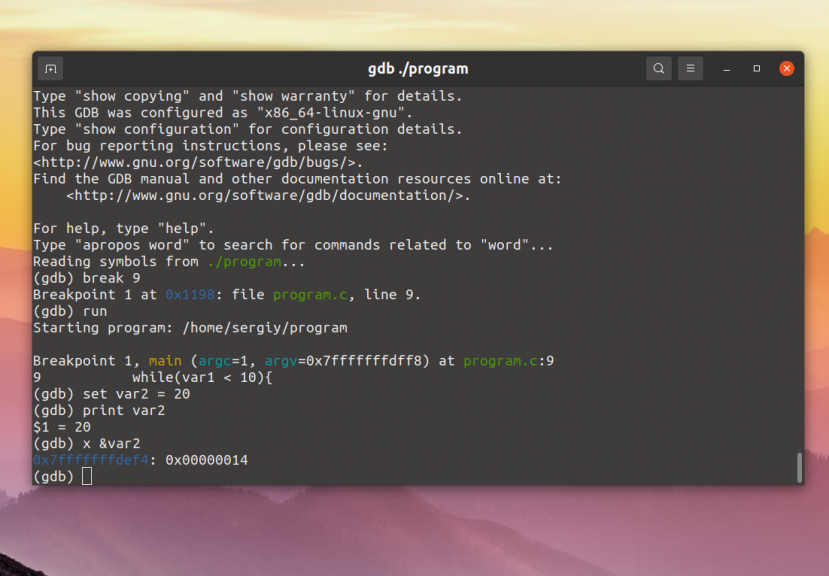
Если вы не знаете адрес переменной, можно передать её имя с оператором &, он извлечет её адрес. Программа выводит шеснадцатиричное значение, и оно обычно мало о чём нам может сообщить. Для того чтобы улучшить ситуацию можно воспользоваться опциями форматирования. Можно указать тип выводимых данных с помощью таких модификаторов:
- o — восьмиричный;
- x — шестнадцатиричный;
- d — десятичный;
- f — число с плавающей запятой;
- i — инструкция процессора;
- с — символ;
- s — строка.
Также можно указать размер выводимого блока:
- b — байт;
- h — полуслово (два байта);
- w — слово (четыре байта);
- g — восемь байт;
Мы пытались вывести переменную типа int. Она занимает обычно четыре байта. Для её корректного вывода используйте такие параметры:
(gdb) x/wd &var2
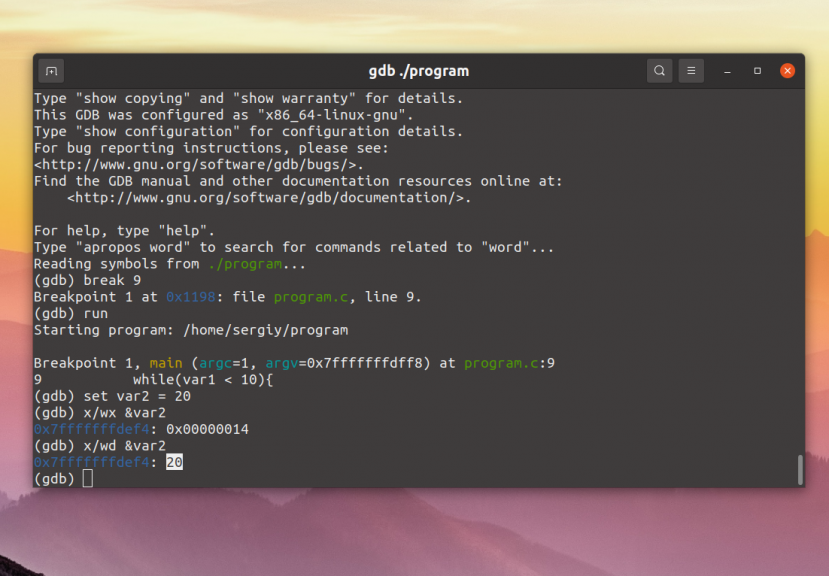
Ещё можно указать количество блоков, которые надо выводить, например два:
(gdb) x/2wd &var2
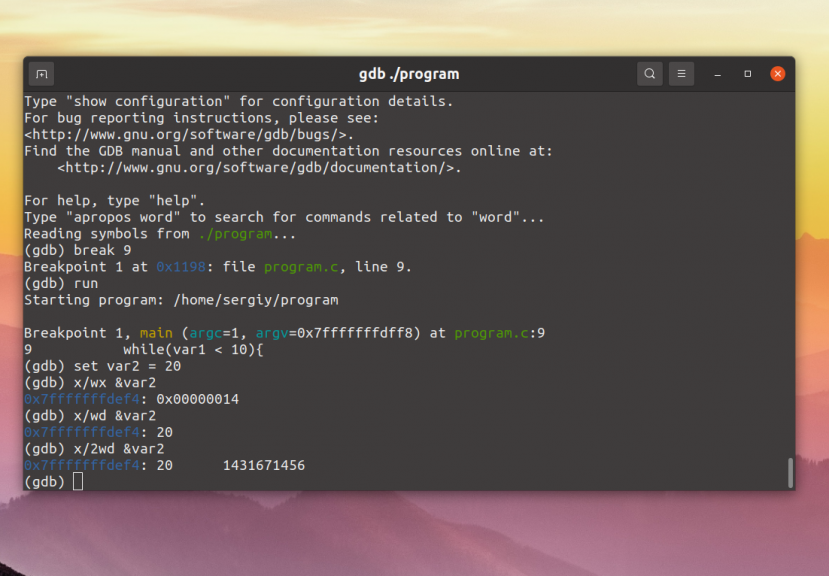
Но поскольку там уже не наша переменная, эти данные не имеют смысла. Аналогично всё работает с строками, символами и другими значениями. Только обратите внимание, что если вы будете выводить переменную не одним блоком, то на результат повлияет порядок расположения байт. Значение будет выводиться задом на перед.
11. Справка по программе
Мы рассмотрели основные возможности отладчика gdb. Но если этого вам не достаточно, вы можете посмотреть справку по любой команде программы в самой программе. Для этого используйте команду help. Например, для команды exemine:
help x
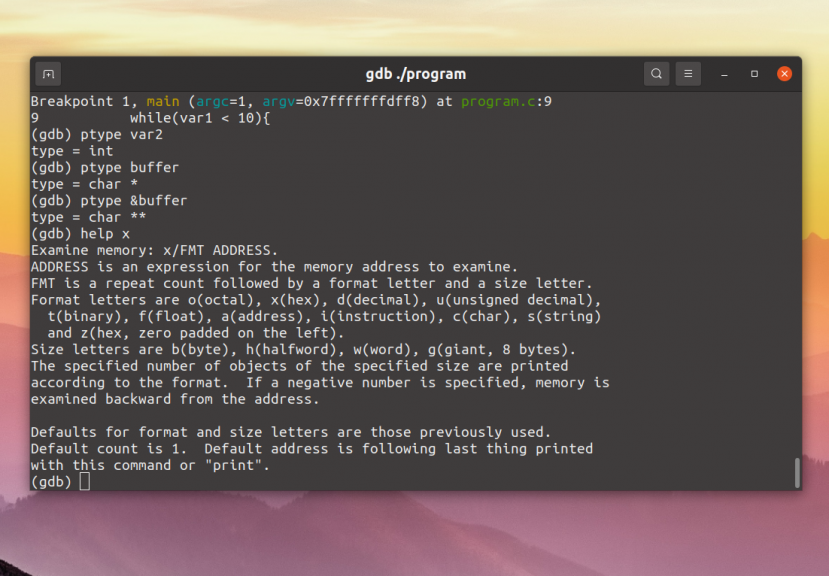
Выводы
Теперь вы знаете как пользоваться gdb для отладки своих программ. Обычно, для отладки намного удобнее использовать графический интерфейс среды программирования, но консоль дает больше возможностей и больше гибкости.
Обнаружили ошибку в тексте? Сообщите мне об этом. Выделите текст с ошибкой и нажмите Ctrl+Enter.

Статья распространяется под лицензией Creative Commons ShareAlike 4.0 при копировании материала ссылка на источник обязательна .
This article is the first in a series demonstrating how to use the GNU Debugger (GDB) effectively to debug applications in C and C++. If you have limited or no experience using GDB, this series will teach you how to debug your code more efficiently. If you are already a seasoned professional using GDB, perhaps you will discover something you haven’t seen before.
In addition to providing developer tips and tricks for many GDB commands, future articles will also cover topics such as debugging optimized code, offline debugging (core files), and server-based sessions (aka gdbserver, used in container debugging).
Why another GDB tutorial?
The majority of GDB tutorials available on the web consist of little more than introductions to the basic list, break, print, and run commands. New GDB users just might as well read (or sing) the official GDB Song!
Instead of simply demonstrating a handful of useful commands, each article in this series will focus on one aspect of using GDB from the perspective of someone who develops GDB. I use GDB daily, and these tips and tricks are the ones that I (and many other advanced GDB users and developers) use to streamline our debugging sessions.
Because this is the first article in the series, allow me to follow the recommendation of the GDB Song and start at the very beginning: How to run GDB.
Compiler options
Let me get the (all-too-often-not-so) obvious out of the way: For the best debugging experience, build applications without optimization and with debugging information. That is trivial advice, but GDB’s public freenode.net IRC channel (#gdb) sees these issues often enough that they warrant mentioning.
TL;DR: Don’t debug applications with optimization if you can avoid it. Watch for a future article on optimization.
Optimization can cause GDB to behave in surprising ways if you are not aware of what might be happening «under the covers.» I always use the C compiler option -O0 (that’s the letter O followed by the number zero) to build executables during the development cycle.
I also always have the toolchain emit debugging information. This is accomplished with the -g option. Specifying the exact debug format is no longer necessary (or desirable); DWARF has been the default debugging information format on GNU/Linux for many years. So ignore advice to use -ggdb or -gdwarf-2.
The one specific option worth adding is -g3, which tells the compiler to include debugging information about the macros (#define FOO ...) used in your application. These macros may then be used in GDB just like any other symbol in your program.
In short, for the best debugging experience, use -g3 -O0 when compiling your code. Some environments (such as those using GNU autotools) set environment variables (CFLAGS and CXXFLAGS) that control the compiler’s output. Check these flags to make sure that your invocations of the compiler enable the debugging environment you want.
For much more information about the impact of -g and -O on the debugging experience, see Alexander Oliva’s treatise GCC gOlogy: Studying the Impact of Optimizations on Debugging.
Startup scripts
Before we look at actually using GDB, something must be said about how GDB starts up and what script files it executes. Upon startup, GDB will execute the commands contained in a number of system and user script files. The location and order of execution of these files are as follows:
/etc/gdbinit(not on FSF GNU GDB): In many GNU/Linux distributions, including Fedora and Red Hat Enterprise Linux, GDB looks first for the system default initialization file and executes commands contained therein. On Red Hat-based systems, this file executes any script files (including Python scripts) installed in/etc/gdbinit.d.$HOME/.gdbinit: GDB will then read the user’s global initialization script from the home directory, if this file exists../.gdbinit: Finally, GDB will look for a startup script in the current directory. Think of this as an application-specific customization file where you can add per-project user-defined commands, pretty-printers, and other customizations.
All of these startup files contain GDB commands to execute, but they may also include Python scripts as long as they are prefaced with the python command, e.g., python print('Hello from python!').
My .gdbinit is actually quite simple. Its most essential lines enable command history so that GDB remembers a given number of commands that were executed from a previous session. This is analogous to the shell’s history mechanism and .bash_history. The entire file is:
set pagination off set history save on set history expansion on
The first line turns off GDB’s built-in paging. The next line enables saving the history (to ~/.gdb_history by default), and the final line enables shell-style history expansion with the exclamation point (!) character. This option is normally disabled because the exclamation point is also a logical operator in C.
To prevent GDB from reading initialization files, give it the --nx command-line option.
Getting help in GDB
There are several ways to get help using GDB, including extensive—if dry—documentation explaining every little switch, knob, and feature.
GDB community resources
The community offers help to users in two places:
- Via email: The GDB mailing list
- Via IRC: #gdb on libera.chat
However, because this article is about using GDB, the easiest way for users to get help with a command is to use GDB’s built-in help system, discussed next.
Accessing the help system
Access GDB’s built-in help system via the help and apropos commands. Don’t know how to use the printf command? Ask GDB:
(gdb) help printf Formatted printing, like the C "printf" function. Usage: printf "format string", ARG1, ARG2, ARG3, ..., ARGN This supports most C printf format specifications, like %s, %d, etc. (gdb)
help accepts the name of any GDB command or option and outputs usage information for that command or option.
Like all GDB commands, the help command supports tab completion. This is perhaps the most useful way to figure out what types of arguments many commands accept. For instance, entering help show ar and pressing the tab key will prompt you for a completion:
(gdb) help show ar architecture args arm (gdb) help show ar
GDB leaves you at the command prompt ready to accept further refinement of the input. Adding g to the command, followed by a tab, will complete to help show args:
(gdb) help show args Show argument list to give program being debugged when it is started. Follow this command with any number of args, to be passed to the program. (gdb)
Don’t know the exact name of the command you’re looking for? Use the apropos command to search the help system for specific terms. Think of it as grepping the built-in help.
Now that you know how and where to find help, we’re ready to move on to starting GDB (finally).
Starting GDB
Unsurprisingly, GDB accepts a large number of command-line options to change its behavior, but the most basic way to start GDB is to pass the application’s name to GDB on the command line:
$ gdb myprogram
GNU gdb (GDB) Red Hat Enterprise Linux 9.2-2.el8
Copyright (C) 2020 Free Software Foundation, Inc.
License GPLv3+: GNU GPL version 3 or later <http://gnu.org/licenses/gpl.html>
This is free software: you are free to change and redistribute it.
There is NO WARRANTY, to the extent permitted by law.
Type "show copying" and "show warranty" for details.
This GDB was configured as "x86_64-pc-linux-gnu".
Type "show configuration" for configuration details.
For bug reporting instructions, please see:
<https://www.gnu.org/software/gdb/bugs/>.
Find the GDB manual and other documentation resources online at:
<http://www.gnu.org/software/gdb/documentation/>.
For help, type "help".
Type "apropos word" to search for commands related to "word"...
Reading symbols from /home/blog/myprogram...
(gdb)
GDB starts up, prints out some version information (GCC Toolset 10 shown), loads the program and its debug information, and displays copyright and help messages, ending with the command prompt, (gdb). GDB is now ready to accept input.
Avoiding messages: The -q or —quiet option
I’ve seen GDB’s startup message thousands of times, so I suppress (or «quiet») it with the -q option:
$ gdb -q myprogram Reading symbols from /home/blog/myprogram... (gdb)
That’s much less to read. If you are really new to GDB, you might find the full startup messaging useful or soothing, but after a while, you’ll also alias gdb in your shell to gdb -q. If you do need the suppressed information, use the -v command-line option or the show version command.
Passing arguments: The —args option
Programs often require command-line arguments. GDB offers multiple ways to pass these to your program (or «inferior,» in GDB parlance). The two most useful ways are to pass application arguments via the run command or at startup via the --args command-line option. If your application is normally started with myprogram 1 2 3 4, simply preface this with gdb -q --args and GDB will remember how your application should be run:
$ gdb -q --args myprogram 1 2 3 4
Reading symbols from /home/blog/myprogram...
(gdb) show args
Argument list to give program being debugged when it is started is "1 2 3 4".
(gdb) run
Starting program: /home/blog/myprogram 1 2 3 4
[Inferior 1 (process 1596525) exited normally]
$
Attaching to a running process: The —pid option
If an application is already running and gets «stuck,» you might want to look inside to find out why. Just give GDB the process ID of your application with --pid:
$ sleep 100000 & [1] 1591979 $ gdb -q --pid 1591979 Attaching to process 1591979 Reading symbols from /usr/bin/sleep... Reading symbols from .gnu_debugdata for /usr/bin/sleep... (No debugging symbols found in .gnu_debugdata for /usr/bin/sleep) Reading symbols from /lib64/libc.so.6... Reading symbols from /usr/lib/debug/usr/lib64/libc-2.31.so.debug... Reading symbols from /lib64/ld-linux-x86-64.so.2... Reading symbols from /usr/lib/debug/usr/lib64/ld-2.31.so.debug... 0x00007fc421d5ef98 in __GI___clock_nanosleep (requested_time=requested_time@entry=0, remaining=remaining@entry=0x0) at ../sysdeps/unix/sysv/linux/clock_nanosleep.c:28 28 return SYSCALL_CANCEL (nanosleep, requested_time, remaining) (gdb)
With this option, GDB automatically loads symbols for programs that have build ID information, such as distribution-supplied packages, and interrupts the program so that you can interact with it. Look for more on how and where GDB finds debug information in a future article.
Following up on a failure: The —core option
If your process aborted and dumped core, use the --core option to tell GDB to load the core file. If the core file contains the build ID of the aborted process, GDB automatically loads that binary and its debugging information if it can. Most developers, however, need to pass an executable to GDB with this option:
$ ./abort-me Aborted (core dumped) $ gdb -q abort-me --core core.2127239 Reading symbols from abort-me... [New LWP 2127239] Core was generated by `./abort-me'. Program terminated with signal SIGABRT, Aborted. #0 __GI_raise (sig=sig@entry=6) at ../sysdeps/unix/sysv/linux/raise.c:50 50 return ret; (gdb)
Tip: Can’t find a core file? On GNU/Linux systems using systemd, check ulimit -c to see whether the shell is preventing programs from creating core files. If the value is unlimited, use coredumpctl to find the core file. Alternatively, run sysctl -w kernel.core_pattern=core to configure systemd to output core files named core.PID, as I have for the previous example.
Expedited command execution: The —ex, —iex, —x, and —batch options
I often run GDB commands repeatedly from the shell to test for problems or run scripts. These command-line options help facilitate that. Most users will use (multiple) --ex arguments to specify commands to run at startup to recreate a debugging session, e.g., gdb -ex "break some_function if arg1 == nullptr" -ex r myprogram.
--exCMDruns the GDB commandCMDafter the program (and debug information) is loaded.--iexdoes the same, but executesCMDbefore the specified program is loaded.-xFILEexecutes GDB commands fromFILEafter the program is loaded and--excommands execute. I use this option most often if I need a lot of--exarguments to reproduce a specific debugging session.--batchcauses GDB to exit immediately at the first command prompt; i.e., after all commands or scripts have run. Note that--batchwill silence even more output than-qto facilitate using GDB in scripts:
$ # All commands complete without error $ gdb -batch -x hello.gdb myprogram Reading symbols from myprogram... hello $ echo $? 0 $ # Command raises an exception $ gdb -batch -ex "set foo bar" No symbol "foo" in current context. $ echo $? 1 $ # Demonstrate the order of script execution $ gdb -x hello.gdb -iex 'echo beforen' -ex 'echo aftern' simple GNU gdb (GDB) Red Hat Enterprise Linux 9.2-2.el8 Copyright (C) 2020 Free Software Foundation, Inc. License GPLv3+: GNU GPL version 3 or later <http://gnu.org/licenses/gpl.html> This is free software: you are free to change and redistribute it. There is NO WARRANTY, to the extent permitted by law. Type "show copying" and "show warranty" for details. This GDB was configured as "x86_64-redhat-linux-gnu". Type "show configuration" for configuration details. For bug reporting instructions, please see: <https://www.gnu.org/software/gdb/bugs/>. Find the GDB manual and other documentation resources online at: <http://www.gnu.org/software/gdb/documentation/>. For help, type "help". Type "apropos word" to search for commands related to "word"... before Reading symbols from simple... hello after (gdb)
Next up
In this article, I’ve shared details about how GDB starts up, reads scripts (and when it reads scripts), and several startup options commonly used by advanced GDB users.
The next article in the series will take a small detour to explain what debugging information is, how to inspect it, where GDB looks for it, and how to install it in distribution-supplied packages.
Do you have a suggestion or tip related to GDB scripts or startup, or a suggestion for a future topic about how to use GDB? Leave a comment on this article and share your idea with us.
Last updated:
October 14, 2022
Отладчик GNU уровня исходного кода
Ричард Столмен, Роланд Пеш, Стан Шебс и другие.
Восьмая Редакция, для GDB версии 5.0
Март 2000
Перевод Сиваченко Дмитрий
- Обзор GDB
- Свободно распространяемые программы
- Кто внес вклад в развитие GDB
- Пример сеанса GDB
- Вход и выход из GDB
- Вызов GDB
- Выбор файлов
- Выбор режимов
- Выход из GDB
- Команды оболочки
- Вызов GDB
- Команды GDB
- Синтаксис команд
- Завершение команд
- Получение справки
- Выполнение программ под управлением GDB
- Компиляция для отладки
- Начало выполнения вашей программы
- Аргументы вашей программы
- Рабочая среда вашей программы
- Рабочий каталог вашей программы
- Ввод и вывод вашей программы
- Отладка запущенного ранее процесса
- Уничтожение дочернего процесса
- Отладка программ с несколькими нитями
- Отладка многонитевых программ
- Остановка и продолжение исполнения
- Точки останова, точки наблюдения и точки перехвата
- Установка точек останова
- Установка точек наблюдения
- Установка точек перехвата
- Удаление точек останова
- Отключение точек останова
- Условия останова
- Команды точки останова
- Меню точки останова
- «Не удается поместить точки останова»
- Продолжение и выполнение по шагам
- Сигналы
- Остановка и запуск многонитевых программ
- Точки останова, точки наблюдения и точки перехвата
- Исследование стека
- Кадры стека
- Цепочки вызовов
- Выбор кадра
- Информация о кадре стека
- Исследование исходных файлов
- Вывод строк исходного текста
- Поиск в исходных файлах
- Определение каталогов с исходными файлами
- Исходный текст и машинный код
- Исследование данных
- Выражения
- Переменные программы
- Искусственные массивы
- Форматы вывода
- Исследование памяти
- Автоматическое отображение
- Параметры вывода
- История значений
- Вспомогательные переменные
- Регистры
- Аппаратные средства поддержки вычислений с плавающей точкой
- Использование GDB с различными языками программирования
- Переход от одного языка к другому
- Соответствие расширений файлов и языков
- Установка рабочего языка
- Распознавание GDB исходного языка
- Отображение языка программирования
- Проверка диапазона и принадлежности типу
- Краткий обзор проверки соответствия типов
- Краткий обзор проверки диапазона
- Поддерживаемые языки
- Си и Си++
- Операторы Си и Си++
- Константы Си и Си++
- Выражения Си++
- Значения Си и Си++ по умолчанию
- Проверки диапазона и принадлежности типу в Си и Си++
- GDB и Си
- Возможности GDB для Си++
- Модула-2
- Операторы Модулы-2
- Встроенные функции и процедуры
- Константы
- Установки по умолчанию Модулы-2
- Отклонения от стандарта Модулы-2
- Проверки диапазона и принадлежности типу Модулы-2
- Операторы определения области видимости
::и. - GDB и Модула-2
- Chill
- Как отображаются режимы
- Местоположения и доступ к ним
- Значения и операции с ними
- Проверка диапазона и типов в Chill
- Установки по умолчанию Chill
- Си и Си++
- Переход от одного языка к другому
- Исследование таблицы символов
- Изменение выполнения
- Присваивание значений пеpеменным
- Продолжение исполнения с другого адреса
- Подача сигнала вашей программе
- Возврат из функции
- Вызов функций программы
- Внесение изменений в программу
- Файлы GDB
- Команды для задания файлов
- Ошибки чтения файлов с символами
- Определение отладочной цели
- Активные цели
- Команды для управления целями
- Выбор целевого порядка байтов
- Удаленная отладка
- Удаленный последовательный протокол GDB
- Что заглушка может сделать для вас
- Что вы должны сделать для заглушки
- Собираем все вместе
- Коммуникационный протокол
- Использование программы
gdbserver - Использование программы
gdbserve.nlm
- Удаленный последовательный протокол GDB
- Отображение объектов ядра
- Информация о конфигурации
- Чистая конфигурация
- HP-UX
- Информация о процессах SVR4
- Встроенные операционные системы
- Использование GDB с VxWorks
- Соединение к VxWorks
- Загрузка на VxWorks
- Запуск задач
- Использование GDB с VxWorks
- Встроенные процессоры
- Встроенный AMD A29K
- A29K UDI
- Протокол EBMON для AMD29K
- Установка связи
- Кросс-отладка EB29K
- Удаленный журнал
- ARM
- Hitachi H8/300
- Соединение с платами Hitachi
- Использование встроенного эмулятора E7000
- Специальные команды GDB для Hitachi
- H8/500
- Intel i960
- Вызов Nindy
- Параметры для Nindy
- Команда сброса Nindy
- Mitsubishi M32R/D
- M68k
- M88K
- Встроенный MIPS
- PowerPC
- Встроенный HP PA
- Hitachi SH
- Tsqware Sparclet
- Установка файла для отладки
- Соединение к Sparclet
- Загрузка на Sparclet
- Выполнение и отладка
- Fujitsu Sparclite
- Tandem ST2000
- Zilog Z8000
- Встроенный AMD A29K
- Архитектуры
- A29K
- Alpha
- MIPS
- Чистая конфигурация
- Управление GDB
- Приглашение
- Редактирование команд
- История команд
- Размер экрана
- Числа
- Необязательные предупреждения и сообщения
- Необязательные сообщения о внутренних событиях
- Фиксированные последовательности команд
- Команды, определяемые пользователем
- Определяемые пользователем команды-ловушки
- Командные файлы
- Команды для управляемого вывода
- Использование GDB под управлением GNU Emacs
- Примечания GDB
- Что такое примечание?
- Префикс server
- Значения
- Кадры
- Отображения
- Примечания ко вводу GDB
- Ошибки
- Информация о точке останова
- Сообщения о недостоверности
- Выполнение программы
- Вывод исходного текста
- Примечания, которые могут понадобиться с будущем
- Интерфейс GDB/MI
- Назначение и цель
- Система обозначений и терминология
- Синтаксис команд GDB/MI
- Входной синтаксис GDB/MI
- Выходной синтаксис GDB/MI
- Простые примеры взаимодействия с GDB/MI
- Совместимость GDB/MI с CLI
- Выходные записи GDB/MI
- Результирующие записи GDB/MI
- Поточные записи GDB/MI
- Внеочередные записи GDB/MI
- Формат описания команд GDB/MI
- Команды GDB/MI для таблицы точек останова
- Управление данными GDB/MI
- Управление программой GDB/MI
- Разные команды GDB в GDB/MI
- Команды управления стеком в GDB/MI
- Команды GDB/MI запросов о символах
- Команды GDB/MI управления целью
- Команды GDB/MI для нитей
- Команды GDB/MI для точек трассировки
- Изменяемые объекты GDB/MI
- Черновик изменений к выходному синтаксису GDB/MI
- Отчеты об ошибках в GDB
- Вы нашли ошибку?
- Как составлять отчеты об ошибках
- Редактирование командной строки
- Введение в редактирование строк
- Взаимодействие с Readline
- Сведения первой необходимости
- Команды перемещения Readline
- Команды уничтожения Readline
- Параметры команд Readline
- Поиск команд в истории
- Файл инициализации Readline
- Синтаксис файла инициализации Readline
- Условные конструкции инициализации
- Пример файла инициализации
- Привязываемые команды Readline
- Команды для перемещения
- Команды для манипуляции историей
- Команды для изменения текста
- Уничтожение и восстановление
- Определение числовых параметров
- Readline вводит за вас
- Клавиатурные макросы
- Некоторые другие команды
- Режим vi Readline
- Использование истории в интерактивном режиме
- Раскрывание истории
- Указатели событий
- Указатели слов
- Модификаторы
- Раскрывание истории
- Форматирование документации
- Установка GDB
- Компиляция GDB в другом каталоге
- Определение имен рабочих и целевых машин
- Ключи
configure
- Алфавитный указатель
Обзор GDB
Назначение отладчика, такого как GDB—позволить вам увидеть,
что происходит «внутри» другой программы во время ее выполнения,
или что делала другая программа в момент краха.
GDB может выполнять действия четырех основных типов (а также
другие, поддерживающие эти основные), чтобы помочь вам выявить ошибку:
-
Начать выполнение вашей программы, задав все, что
может повлиять на ее поведение. - Остановить вашу программу при указанных условиях.
- Исследовать, что случилось, когда ваша программа остановилась.
-
Изменить вашу программу, так что вы можете экспериментировать с
устранением эффектов одной ошибки и продолжить выявление других.
Вы можете использовать GDB для отладки программ, написанных на Си
и Си++.
Для получения более подробной информации, смотрите section Поддерживаемые языки.
Для дополнительной информации, смотрите section Си и Си++.
GDB частично поддерживает языки Модула-2 и Chill. Для получения
информации о Модуле-2, смотрите section Модула-2. Для получения
информации о Chill, см. section Chill
Отладка программ на Паскале, которые используют множества,
поддиапазоны, файловые переменные или вложенные функции, в настоящее
время не работает. GDB не поддерживает ввод выражений, вывод
значений, и аналогичные возможности, использующие синтаксис Паскаля.
GDB может использоваться для отладки программ, написанных на
Фортране, хотя может возникнуть необходимость ссылаться на некоторые
переменные с использованием знака подчеркивания на конце.
Свободно распространяемые программы
GDB—свободная программа, защищенная Универсальной
Общественной Лицензией GNU (GPL). GPL предоставляет вам свободу
копировать или изменять программу, но каждый человек, получая копию,
также получает свободу изменять эту копию (это означает, что он
должен получить доступ к исходному коду), и свободу распространять
последующие копии. Обычные компании, разрабатывающие программы,
используют авторские права для ограничения ваших свобод; Фонд Свободного
Программного Обеспечения использует GPL для сохранения этих свобод.
Главное, Универсальная Общественная Лицензия—это лицензия, говорящая,
что вы имеете эти свободы и что вы не можете их у кого-либо отнять.
Кто внес вклад в развитие GDB
Первоначальным автором GDB, как и многих других программ
GNU, был Ричард Столмен. Многие другие люди внесли вклад в его
разработку. Этот раздел пытается отдать должное основным участникам
разработки. Одним из достоинств свободных программ является то, что
любой человек имеет свободу делать вклад в их развитие; к сожалению, мы
не можем в действительности поблагодарить здесь всех. Файл
`ChangeLog' в поставке GDB представляет детальнейший отчет.
Изменения, сделанные задолго до версии 2.0 потеряны в тумане времен.
Оправдание: Дополнения к этому разделу особенно приветствуются.
Если вы или ваши друзья (или враги, чтобы соблюдать справедливость) были
незаслуженно пропущены в этом списке, мы будем рады добавить ваши имена!
Особенно мы хотим сказать спасибо тем, кто присматривал за GDB
между основными выпусками, чтобы они не сочли свои многочисленные
заслуги оставленными без благодарности:
Эндрю Кагни (выпуск 5.0);
Джим Бленди (выпуск 4.18);
Джесон Моленда (выпуск 4.17);
Стан Шебс (выпуск 4.14);
Фред Фиш (выпуски 4.16, 4.15, 4.13, 4.12, 4.11, 4.10, и 4.9);
Сту Гроссман и Джон Гилмор (выпуски 4.8, 4.7, 4.6, 4.5, и 4.4);
Джон Гилмор (выпуски 4.3, 4.2, 4.1, 4.0, и 3.9);
Джим Кингдон (выпуски 3.5, 3.4, и 3.3)
и Ренди Смит (выпуски 3.2, 3.1, и 3.0).
Ричард Столмен, которому в различные времена помогали Петер ТерМаат, Крис
Хенсон и Ричард Млинарик, занимался выпусками до 2.8.
Михаэль Тиманн является автором большей части поддержки GNU Си++ в
GDB, со значительным дополнительным вкладом от Пера Бозера.
Джеймс Кларк написал дешифровщик (1) имен GNU Си++.
Ранняя работа по Си++ была сделана Петером ТерМаатом (который также сделал
много общей работы по обновлению, приведшей к выпуску 3.0).
Для исследования многих форматов объектных файлов, GDB 4
использует библиотеку подпрограмм BFD. BFD был совместным проектом
Дэвида В. Хенкел-Волласа, Рича Пиксли, Стива Чемберлена, и Джона Гилмора.
Дэвид Джонсон первоначально написал поддержку COFF; Пейс Виллисон
первоначально сделал поддержку инкапсулированного COFF.
Брент Бенсон из Harris Computer Systems сделал поддержку DWARF 2.
Адам ДеБур и Брэндли Дэвис сделали поддержку ISI Optimum V.
Пер Бозер, Нобоюки Хикичи, и Алессандро Форин сделали поддержку MIPS.
Жан-Даниэль Фекет сделал поддержку Sun 386i.
Крис Хенсон улучшил поддержку HP9000.
Нобоюки Хикичи и Томоюки Хаси сделали поддержку Sony/News OS 3.
Дэвид Джонсон сделал поддержку Encore Umax.
Юрки Куоппала сделал поддержку Altos 3068.
Джефф Ло сделал поддержку HP PA и SOM.
Кейс Паккард сделал поддержку NS32K.
Доуг Ребсон сделал поддержку Acorn Risc Machine.
Боб Раск сделал поддержку Harris Nighthawk CX-UX.
Крис Смит сделал поддержку Convex (и отладку программ на Фортране).
Джонатан Стоун сделал поддержку Pyramid.
Михаэль Тиманн сделал поддержку SPARC.
Тим Такер сделал поддержку для Gould NP1 и Gould Powernode.
Пейс Виллисон сделал поддержку Intel 386.
Джей Восбург сделал поддержку Symmetry.
Андреас Шваб сделал поддержку M68K Linux.
Рич Шаефер и Петер Шауер помогли реализовать поддержку разделяемых
библиотек SunOS.
Джей Фенласон и Роланд МакГрес проверили совместимость GDB и GAS
по нескольким наборам машинных инструкций.
Патрик Дювал, Тед Голдстейн, Викрам Кока и Гленн Инжел помогли разработать
удаленную отладку. Intel Corporation, Wind River Systems, AMD и ARM
сделали модули удаленной отладки для целей i960, VxWorks, A29K UDI,
и RDI соответственно.
Брайан Фокс является автором библиотек Readline, предоставляющих
историю команд и возможность редактирования командной строки.
Эндрю Бирс из SUNY Buffalo написал код для переключения языков,
поддержку Модулы-2, главу `Языки’ этого руководства.
Фред Фиш написал большую часть поддержки Unix System Vr4.
Он также улучшил поддержку завершения команд для поддержки перегруженных
символов Си++.
Hitachi America, Ltd. спонсировала поддержку для процессоров H8/300,
H8/500 и Super-H.
NEC спонсировала поддержку процессоров v850, Vr4xxx и Vr5xxx.
Mitsubishi спонсировала поддержку процессоров D10V, D30V и M32R/D.
Toshiba спонсировала поддержку процессора TX39 Mips.
Matsushita спонсировала поддержку процессоров MN10200 и MN10300.
Fujitsu спонсировала поддержку процессоров SPARClite и FR30.
Кунг Шу, Джефф Ло и Рик Слэдки добавили поддержку аппаратных точек
наблюдения.
Михаэль Снайдер добавил поддержку точек трассировки.
Сту Гроссман написал gdbserver.
Джим Кингдон, Петер Шауер, Ян Тейлор и Сту Гроссман сделали почти
бесчисленное количество исправлений и улучшений во всем GDB.
Следующие люди из Hewlett-Packard Company сделали
поддержку архитектуры PA-RISC 2.0, HP-UX 10.20, 10.30 и 11.0
(усеченный режим), реализации нитей HP в ядре, компилятора HP aC++,
и конечного интерфейса пользователя: Бен Крепп, Ричард Тайтл,
Джон Бишоп, Сюзан Макчиа, Кэси Манн, Сэтиш Пай, Индиа Поул, Стив
Рейраур и Елена Заннони. Ким Хаас предоставил специфичную для HP
информацию для этого руководства.
Cygnus Solutions спонсировала поддержку GDB и большую часть его
развития с 1991 года. Среди инженеров Cygnus, работавших над GDB
на постоянной основе, Марк Александер, Джим Бленди, Пер Бозер, Кевин
Беттнер, Эдит Эпштейн, Крис Фейлор, Фред Фиш, Мартин Хант, Джим
Ингам, Джон Гилмор, Сту Гроссман, Кунг Шу, Джим Кингдон, Джон Мецлер,
Фернандо Нассер, Джеффри Ноер, Дон Перчик, Рич Пиксли, Зденек
Радуч, Кейс Сейц, Стан Шебс, Дэвид Тейлор и Елена Заннони. Кроме того,
Дейв Бролли, Ян Кармихаэль, Стив Чемберлен, Ник Клифтон,
Джэй Ти Конклин, Стен Кокс, Ди Джей Делори, Ульрих Дреппер, Фрэнк Эйглер, Дуг
Эванс, Син Фаган, Дэвид Хенкель-Воллас, Ричард Хендерсон, Джефф
Холком, Джефф Ло, Джим Лемке, Том Лорд, Боб Мансон, Михаэль Мейсснер,
Джейсон Меррилл, Кэтрин Мур, Дрю Мосли, Кен Робурн, Гавин
Ромиг-Кох, Роб Савой, Джейми Смит, Майк Стамп, Ян Тейлор, Анжела
Томас, Михаэль Тиманн, Том Тромей, Рон Унро, Джим Вилсон и Дэвид
Зун также сделали свой вклад в большей или меньшей степени.
Пример сеанса GDB
Вы можете пользоваться этим руководством в свое удовольствие, чтобы
прочитать о GDB все. Однако, достаточно небольшого количества
команд, чтобы начать пользоваться отладчиком. Эта глава иллюстрирует
эти команды.
В этом примере сеанса мы выделяем ввод пользователя так: ввод,
чтобы его было проще отличить от находящегося рядом вывода программы.
В одной из предварительных версий программы GNU m4 (настраиваемый
макропроцессор), была допущена следующая ошибка: иногда, при замене
строк, определяющих кавычки, со значений по умолчанию, команды,
использовавшиеся для поиска одного макроопределения внутри другого,
прекращали работать. В следующем коротком сеансе m4, мы
определим макрос foo, который расширяется до 0000; затем мы
используем встроенную процедуру m4 defn, чтобы определить
bar точно также. Однако, когда мы изменим открывающую кавычку
на <QUOTE>, а закрывающую на <UNQUOTE>, та же самая процедура не
сможет определить новый синоним baz:
$ cd gnu/m4
$ ./m4
define(foo,0000)
foo
0000
define(bar,defn('foo'))
bar
0000
changequote(<QUOTE>,<UNQUOTE>)
define(baz,defn(<QUOTE>foo<UNQUOTE>))
baz
C-d
m4: End of input: 0: fatal error: EOF in string(2)
Попытаемся с помощью GDB понять, что же происходит.
$ gdb m4 GDB is free software and you are welcome to distribute copies of it under certain conditions; type "show copying" to see the conditions. There is absolutely no warranty for GDB; type "show warranty" for details. GDB 5.0, Copyright 1999 Free Software Foundation, Inc... (gdb)
GDB читает только минимум символьных данных, достаточный для того,
чтобы знать, где в случае
необходимости искать остальные; в результате первое приглашение
появляется очень быстро. Теперь мы велим GDB использовать меньшую
ширину экрана, чем обычно, чтобы примеры умещались на
страницах этого руководства.
(gdb) set width 70
Нам необходимо увидеть, как работает встроенная процедура m4
changequote. Посмотрев исходный текст, мы знаем, что
соответствующей подпрограммой является m4_changequote, так что мы
устанавливаем там точку останова с помощью команды GDB break.
(gdb) break m4_changequote Breakpoint 1 at 0x62f4: file builtin.c, line 879.
Используя комманду run, мы запускаем m4 под управлением
GDB; до тех пор, пока управление не достигло подпрограммы
m4_changequote, программа выполняется как обычно:
(gdb) run Starting program: /work/Editorial/gdb/gnu/m4/m4 define(foo,0000) foo 0000
Чтобы активировать точку останова, мы вызываем changequote.
GDB приостанавливает выполнение m4, выводя на экран
информацию о том месте, где он остановился.
changequote(<QUOTE>,<UNQUOTE>)
Breakpoint 1, m4_changequote (argc=3, argv=0x33c70)
at builtin.c:879
879 if (bad_argc(TOKEN_DATA_TEXT(argv[0]),argc,1,3))
Теперь мы используем команду n (next), чтобы продолжить
выполнение до следующей строки текущей функции.
(gdb) n 882 set_quotes((argc >= 2) ? TOKEN_DATA_TEXT(argv[1]) : nil,
set_quotes выглядит как нужная нам подпрограмма. Мы можем войти в
нее, используя команду s (step) вместо next.
step переходит на следующую исполняемую строку любой
подпрограммы, так что она входит в set_quotes.
(gdb) s
set_quotes (lq=0x34c78 "<QUOTE>", rq=0x34c88 "<UNQUOTE>")
at input.c:530
530 if (lquote != def_lquote)
Отображение, показывающее подпрограмму (и ее параметры), где m4
сейчас приостановлен, называется отображением кадра стека. Оно
показывает обзор стека. Мы можем использовать команду
backtrace (которая может сокращаться как bt), чтобы посмотреть, в
каком месте стека мы находимся: команда backtrace выводит
кадр стека для каждой активной подпрограммы.
(gdb) bt
#0 set_quotes (lq=0x34c78 "<QUOTE>", rq=0x34c88 "<UNQUOTE>")
at input.c:530
#1 0x6344 in m4_changequote (argc=3, argv=0x33c70)
at builtin.c:882
#2 0x8174 in expand_macro (sym=0x33320) at macro.c:242
#3 0x7a88 in expand_token (obs=0x0, t=209696, td=0xf7fffa30)
at macro.c:71
#4 0x79dc in expand_input () at macro.c:40
#5 0x2930 in main (argc=0, argv=0xf7fffb20) at m4.c:195
Чтобы посмотреть, что же происходит, мы проходим по шагам еще несколько строк.
Первые два раза мы можем использовать ‘s’; следующие два раза
мы пользуемся командой n, чтобы избежать
вхождения в подпрограмму xstrdup.
(gdb) s 0x3b5c 532 if (rquote != def_rquote) (gdb) s 0x3b80 535 lquote = (lq == nil || *lq == '') ? def_lquote : xstrdup(lq); (gdb) n 536 rquote = (rq == nil || *rq == '') ? def_rquote : xstrdup(rq); (gdb) n 538 len_lquote = strlen(rquote);
Последняя выведенная строка выглядит несколько странно; мы можем
исследовать переменные lquote и rquote, чтобы понять,
действительно ли это определенные нами новые левая и правая кавычки.
Мы используем команду p (print), чтобы посмотреть их значения.
(gdb) p lquote $1 = 0x35d40 "<QUOTE>" (gdb) p rquote $2 = 0x35d50 "<UNQUOTE>"
Действительно, lquote и rquote являются новыми кавычками. Для
просмотра контекста, мы можем вывести десять строк исходного текста,
окружающих текущую строку, используя команду l (list).
(gdb) l 533 xfree(rquote); 534 535 lquote = (lq == nil || *lq == '') ? def_lquote : xstrdup (lq); 536 rquote = (rq == nil || *rq == '') ? def_rquote : xstrdup (rq); 537 538 len_lquote = strlen(rquote); 539 len_rquote = strlen(lquote); 540 } 541 542 void
Давайте пройдем еще две строки, которые устанавливают len_lquote и
len_rquote, и затем исследуем значения этих переменных.
(gdb) n 539 len_rquote = strlen(lquote); (gdb) n 540 } (gdb) p len_lquote $3 = 9 (gdb) p len_rquote $4 = 7
Это, очевидно, неправильно, так как len_lquote и len_rquote
обозначают длины переменных lquote и rquote соответственно.
Мы можем присвоить им лучшие значения, используя
команду p, так как она может выводить значение любого выражения, а
выражение может содержать вызовы подпрограмм и присваивания.
(gdb) p len_lquote=strlen(lquote) $5 = 7 (gdb) p len_rquote=strlen(rquote) $6 = 9
Достаточно ли этого, чтобы решить проблему использования новых кавычек
во встроенной процедуре m4 defn? Мы можем
продолжить выполнение m4 командой c (continue),
и затем попробовать пример, первоначально вызывавший ошибку:
(gdb) c Continuing. define(baz,defn(<QUOTE>foo<UNQUOTE>)) baz 0000
Успех! Теперь новые кавычки работают так же хорошо, как и стандартные.
Кажется, проблема заключалась лишь в двух опечатках, приводивших к
неправильному определению длин. Мы позволим m4 выйти, подавая ему
на вход EOF:
C-d Program exited normally.(3)
Сообщение `Program exited normally.’
исходит от GDB; оно
показывает, что m4 закончил выполнение. Мы можем завершить наш
сеанс работы с GDB командой quit.
(gdb) quit
Вход и выход из GDB
Эта глава посвящена тому, как запустить GDB и как из него выйти.
Основные принципы:
- введите `gdb’ для вызова GDB.
-
введите
quitили C-d для выхода из него.
Вызов GDB
Вызывайте GDB путем запуска программы gdb.
Начав работу, GDB считывает команды с терминала до тех пор,
пока вы не скажете ему выйти.
Вы также можете запустить gdb с различными аргументами и
ключами, чтобы в самом начале лучше настроить среду отлаживания.
Ключи командной строки, описанные здесь, предназначены для охвата
различных ситуаций; в дейтсвительности, в некоторых средах часть этих
ключей может быть недоступна.
Чаще всего GDB вызывается с одним аргументом, который определяет
исполняемую программу:
gdb программа
Вы также можете указать при старте как исполняемую программу, так и файл
дампа памяти:
gdb программа дамп
Если вы хотите отладить выполняющийся в данный момент процесс, то
вместо этого, вы можете указать вторым аргументом идентификатор этого
процесса:
gdb программа 1234
присоединит GDB к процессу 1234 (если, конечно, у вас
нет файла с именем `1234', GDB сначала проверяет
наличие файла дампа памяти).
Преимущества, которые можно получить при использовании второго аргумента
командной строки, требуют наличия достаточно совершенной операционной системы;
если вы используете GDB как удаленный отладчик, присоединенный к
компьютеру без операционной системы, там вообще может не быть понятия
«процесса», и часто нет никакого способа получить дамп. GDB
предупредит вас, если ему не удается присоединиться к процессу или
считать файл дампа памяти.
Вы можете запустить gdb без вывода начального сообщения,
описывающего отсутствие гарантии на него, указав -silent:
gdb -silent
Кроме того, вы можете контролировать процесс запуска GDB с
помощью ключей командной строки. GDB может сам напомнить вам о
доступных ключах.
Введите
gdb -help
чтобы вывести на экран все доступные опции с кратким описанием их использования
(сокращенный эквивалент—`gdb -h’).
Все заданные вами ключи и параметры командной строки обрабатываются
последовательно. Порядок становится важным при использовании ключа `-x’.
Выбор файлов
При запуске, GDB считывает параметры, отличные от ключей, как
указатели на исполняемую программу и файл дампа (или
идентификатор процесса), точно так же, как если бы эти параметры
задавались ключами `-se’ и `-c’ соответственно. (GDB
считает первый параметр, не имеющий соответствующего флага ключа,
эквивалентом ключа `-se’, за которым следует этот параметр; а
второй параметр, не имеющий соответствующего флага ключа, если он есть,
эквивалентом ключа `-c’, за которым следует этот параметр.)
Если GDB был сконфигурирован без включения поддержки файлов дампа,
что имеет место для большинства встроенных целей, то он выразит недовольство
вторым аргументом и проигнорирует его.
Многие ключи имеют как длинную, так и краткую формы;
в следующем списке приводятся обе. GDB также распознает
сокращения длинных форм, не являющиеся двусмысленными. (Вы можете,
по желанию, обозначать ключи с помощью `—‘, а не `-‘, хотя
мы показываем наиболее употребляемый формат.)
-symbols файл-s файл-
Читать таблицу символов из файла файл.
-exec файл-e файл-
Использовать файл как исполняемый для выполнения и исследования
данных вместе с дампом памяти, когда это необходимо. -se файл-
Читать таблицу символов из файла файл и использовать его как
исполняемый файл. -core файл-c файл-
Использовать файл как дамп памяти для исследования.
-c номер-
Присоединиться к процессу с идентификатором номер, также, как
по командеattach(при условии, что нет файла в формате дампа
памяти с именем номер; в этом
случае `-c’ определяет этот файл как дамп для считывания). -command файл-x файл-
Выполнить команды GDB из файла файл. See section Командные файлы.
-directory каталог-d каталог-
Добавить каталог к путям поиска файлов с исходными текстами.
-m-mapped-
Предупреждение: этот ключ зависит от возможностей операционной системы,
которые реализованы не везде.
Если отображаемые в память файлы поддерживаются в вашей системе через
системный вызовmmap, вы можете использовать этот ключ,
чтобы GDB записывал символы из вашей программы в файл в текущем
каталоге, допускающий повторное использование. Если программа,
которую вы отлаживаете, называется`/tmp/fred', то отображаемым
символьным файлом будет`/tmp/fred.syms'. Последующие отладочные
сеансы GDB замечают наличие этого файла и могут быстро
отобразить в память символьную информацию из него, а не читать
таблицу символов из выполняемого файла.
Файл`.syms'специфичен для рабочей машины, на которой запускается
GDB. Он содержит точный образ внутренней символьной
таблицы GDB. Он не может быть разделен между несколькими
рабочими платформами. -r-readnow-
Читать символьную таблицу каждого файла, содержащего таблицу символов,
сразу целиком, а не стандартным образом, при котором она считывается
постепенно по мере необходимости. Эта команда замедляет запуск, но дальнейшие
операции производятся быстрее.
Ключи -mapped и -readnow обычно используются вместе, чтобы
построить файл `.syms', который содержит полную информацию о
символах. (See section Команды для задания файлов, для информации о
файлах `.syms'.) Вот простой вызов GDB, не делающий
ничего, кроме построения файла `.syms' для использования в будущем:
gdb -batch -nx -mapped -readnow имя-программы
Выбор режимов
Вы можете вызывать GDB в различных альтернативных
режимах—например, в пакетном или в «тихом» режиме.
-nx-n-
Не выполнять команды ни из каких файлов инициализации (обычно
назваемых`.gdbinit', или`gdb.ini'на PC). В нормальном
режиме, GDB выполняет команды из этих файлов после обработки всех
командных ключей и параметров. See section Командные файлы. -quiet-silent-q-
«Тихий». Не печатать вводное сообщение и информацию об авторских
правах. Эти сообщения также подавляются в пакетном режиме. -batch-
Выполняться в пакетном режиме. Выйти со значением
0после обработки
всех командных файлов, заданных ключем `-x’ (и всех команд
из инициализационных файлов, если это не запрещено ключем `-n’).
Выйти с ненулевым значением, если во время выполнения
команд GDB из командных файлов произойдет ошибка.
Пакетный режим может быть полезен при вызове GDB как
фильтра; например, чтобы загрузить программу и запустить ее на
другом компьютере. Для того, чтобы сделать это более удобным, сообщениеProgram exited normally.
(которое обычно выдается при завершении программы, выполняемой
под управлением GDB), при выполнении в пакетном режиме не выдается. -nowindows-nw-
«Без окон». Если GDB имеет встроенный графический интерфейс
пользователя (GUI), то этот ключ велит GDB использовать только
интерфейс командной строки. Если GUI недоступен, этот ключ не
оказывает никакого действия. -windows-w-
Если GDB включает GUI, этот ключ требует использовать его, если
только возможно. -cd каталог-
Запустить GDB, используя в качестве рабочего каталога
каталог, вместо текущего. -fullname-f-
GNU Emacs устанавливает этот ключ, когда вызывает GDB как
подпроцесс. Это велит GDB выводить полное имя файла и
номер строки в стандартном, распознаваемом стиле всякий раз, когда
отображается кадр стека (что включает каждую остановку вашей программы).
Этот распознаваемый формат выглядит как два знака `32′,
за которыми следует имя файла, номер строки и символьная позиция,
разделенные двоеточиями, и знак новой строки.
Программа интерфейса Emacs-GDB использует два
знака `32′ как сигнал для отображения исходного текста
для кадра. -epoch-
Интерфейс Emacs-GDB Epoch устанавливает этот ключ, когда
вызывает GDB как подпроцесс. Это велит GDB изменить
свои подпрограммы печати так, чтобы позволить Epoch отображать значения
выражений в отдельном окне. -annotate уровень-
Этот ключ устанавливает уровень примечаний внутри
GDB. Его эффект аналогичен использованию `set annotate
уровень‘ (see section Примечания GDB). Уровень примечаний контролирует,
какое количество информации GDB выводит вместе с приглашением,
значениями выражений, строками исходного текста и другими типами
вывода. Уровень 0 является обычным, уровень 1
используется, когда GDB выполняется как подпроцесс GNU
Emacs, уровень 2 выводит максимальное количество примечаний и подходит
для программ, которые управляют GDB. -async-
Использовать асинхронный цикл событий для интерфейса командной строки.
GDB обрабатывает все события, такие как ввод пользователя с
клавиатуры, через специальный цикл событий. Это позволяет GDB
принимать и обрабатывать команды пользователя параллельно с выполнением
отлаживаемого процесса(4), так что вы не должны ждать возвращения
управления GDB, прежде чем ввести следующую команду.
(Замечание: в версии 5.0, асинхронное выполнение на целевой
системе еще не поддерживается, так что режим `-async’ еще
реализован не полностью.)
Когда стандартный ввод соединен с терминальным устройством, GDB
по умолчанию использует асинхронный цикл событий, если это не отключено
ключем `-noasync’. -noasync-
Отключить асинхронный цикл событий для интерфейса командной строки.
-baud бод-в-сек-b бод-в-сек-
Устанавливает скорость линии (скорость в бодах, или в битах в
секунду) любого последовательного интерфейса, используемого GDB
для удаленной отладки. -tty устройство-t устройство-
Запуститься, используя устройство для стандартного ввода и вывода вашей
программы. -interpreter интерп-
Использовать интерпретатор интерп к качестве интерфейса с
управляющей программой или устройством. Подразумевается, что этот ключ
должет устанавливаться программами, которые взаимодействуют с
GDB, используя его как выходной буфер.
Например, `—interpreter=mi’ велит GDB использовать
интерфейс gdbmi (see section Интерфейс GDB/MI). -write-
Открыть выполняемый файл и файл дампа памяти как для чтения, так и для
записи. Это эквивалентно команде GDB `set write on’
(see section Внесение изменений в программу). -statistics-
Этот ключ велит GDB печатать статистику о времени и
использовании памяти после завершения каждой команды и
возврата к приглашению. -version-
Этот ключ велит GDB напечатать номер своей версии и объявление
об отсутствии гарантий, и затем завершиться.
Выход из GDB
quit [выражение]q-
Чтобы выйти из GDB, используйте команду
quit
(сокращенноq),
или введите знак конца файла (обычно C-d).
Если вы не укажете выражение, GDB
закончит работу нормально; в противном случае, он
использует результат выражения как код ошибки.
Прерывание (часто C-c) не приводит к выходу из GDB,
а завершает любую выполняющуюся команду и возвращает вас
на командный уровень. Вы можете безопасно пользоваться
прерыванием в любое время, потому что GDB не позволяет ему вступить в
силу до того, как это станет безопасным.
Если вы использовали GDB для управления присоединенным процессом
или устройством, вы можете освободить его командой detach
(see section Отладка запущенного ранее процесса).
Команды оболочки
Если вам случайно потребовалось выполнить команды оболочки в течение сеанса
отладки, нет смысла приостанавливать или покидать
GDB; вам достаточно воспользоваться командой shell.
shell командная строка-
Вызвать стандартную оболочку для выполнения командной строки.
Переменная окруженияSHELL, если она существует, определяет,
какую оболочку запустить. В противном случае, GDB
использует оболочку по умолчанию (`/bin/sh'в системах Unix,
`COMMAND.COM'в MS-DOS, и так далее).
В средах разработки часто бывает необходимо воспользоваться
утилитой make. Для этой цели вам не обязательно пользоваться
командой shell в GDB:
make make-арг-
Выполнить программу
makeс указанными аргументами. Это
эквивалентно `shell make make-арг‘.
Команды GDB
Вы можете сокращать команды GDB по нескольким первым символам
имени команды, если это сокращение однозначно; и вы можете повторять
определенные команды GDB простым нажатием RET. Вы также
можете использовать клавишу TAB для того, чтобы GDB сам
дополнил остаток слова в команде (или показал вам возможные
альтернативы, если существует несколько вариантов).
Синтаксис команд
Команда GDB представляет собой одну строку ввода. Никаких
ограничений на ее длину нет. Она начинается именем команды, за которым
следуют параметры, значение которых определяется ее названием.
Например, команда step допускает в качестве параметра число
шагов, как в `step 5′. Вы также можете использовать команду
step и без параметров. Некоторые команды не допускают
никаких параметров.
Названия команд GDB всегда могут быть сокращены, если это
сокращение однозначно. Другие возможные сокращения команд перечислены в
документации по отдельным командам. В некоторых случаях, допускаются
даже неоднозначные сокращения; напрмер, s специально определено
как эквивалент step, даже если существуют другие команды, чьи
названия начинаются на s. Вы можете проверить сокращения,
задавая их как параметр для команды help.
Введенная пустая строка (просто нажатие RET), означает повтор
предыдущей команды. Определенные команды (например, run)
не повторяются таким способом; это те команды, непреднамеренное
повторение которых может вызвать проблемы и которые вы вряд ли захотите
повторять.
Команды list и x, при их повторе нажатием RET,
вместо точного повтора создают новые параметры. Это позволяет легко
просматривать исходный текст или память.
GDB может также использовать RET по-другому: для
разделения длинного вывода, аналогично обычной утилите more
(see section Размер экрана). Так как в такой ситуации легко
нажать RET слишком много раз, GDB блокирует повтор после
любой команды, генерирующей такой тип вывода.
Любой текст, расположенный от # до конца строки является
комментарием; он ничего не делает. В основном, это полезно в
командных файлах (see section Командные файлы).
Завершение команд
GDB может дополнить за вас окончание слова в команде, если
существует только один вариант; он также может в любой момент
показать, какие завершения возможны для следующего слова в
команде. Это работает для команд и подкоманд GDB, а
также для имен символов в вашей программе.
Нажмите TAB в любой момент, когда захотите, чтобы
GDB дополнил оставшуюся часть слова. Если существует только
одна возможность, GDB дополняет слово и ждет, пока вы закончите
команду (или нажмете RET, чтобы ввести ее). Например, если вы
введете
(gdb) info bre TAB
GDB дополнит остаток слова `breakpoints’, так как у
команды info есть единственная подкоманда, начинающаяся с `bre’:
(gdb) info breakpoints
Теперь вы можете нажать либо RET, чтобы выполнить команду
info breakpoints, либо удалить часть символов и ввести что-то другое,
если `breakpoints’ не является той командой, которую вы ожидали.
(Если вы с самого начала были уверены, что хотите info breakpoints,
вы также могли просто нажать RET, сразу после `info bre’,
использовав сокращение команды вместо завершения).
Если при нажатии TAB существует несколько вариантов для следующего
слова, GDB издает звук. Вы можете либо ввести больше символов
и попробовать снова, либо нажать TAB второй раз; GDB
выведет все возможные завершения для этого слова. Например, вы можете
захотеть установить точку останова на подпрограмме, чье имя начинается с
`make_’, но когда вы вводите b make_TAB, GDB
лишь издает звук. Повторное нажатие TAB отображает все имена
функций в вашей программе, начинающиеся с этих символов. Например:
(gdb) b make_ TAB GDB издает звук; нажав TAB еще раз, видим: make_a_section_from_file make_environ make_abs_section make_function_type make_blockvector make_pointer_type make_cleanup make_reference_type make_command make_symbol_completion_list (gdb) b make_
После отображения возможных вариантов, GDB копирует ваш
частичный ввод (`b make_’ в этом примере), так что вы можете закончить
команду.
Если вы сначала хотите только увидеть список альтернатив, вы можете
нажать M-?, а не нажимать TAB дважды. M-? означает
META ?. Вы можете ввести это либо удерживая клавишу,
обозначенную на вашей клавиатуре как META (если такая есть), и
нажать ?, или как ESC, за которой следует ?.
Иногда нужная вам строка, являясь логически «словом», может содержать
скобки или другие символы, которые GDB обычно исключает из
своего понятия о слове. Чтобы позволить завершению слов работать в
такой ситуации, вы можете заключить слова в командах GDB в
' (знаки одинарных кавычек).
Наиболее вероятная ситуация, где вам это может потребоваться, это при
вводе имени функции в Си++. Это происходит потому, что Си++ допускает
перегрузку функций (множественные определения одной и той же функции,
различающиеся типом параметров). Например, когда вы хотите установить
точку останова, вам может потребоваться различать, имеете вы в виду
версию name с параметром целого типа, name(int), или же
версию с параметром вещественного типа, name(float). Для
использования возможностей завершения слов в такой ситуации, введите
одинарную кавычку ' в начале имени функции. Это предупреждает
GDB, что ему может потребоваться принять во внимание больше
информации, чем обычно, когда вы нажимаете TAB или M-? для
запроса завершения слова:
(gdb) b 'bubble( M-? bubble(double,double) bubble(int,int) (gdb) b 'bubble(
В некоторых случаях, GDB может сам определить, что завершение
имени требует использования кавычек. Когда это происходит, GDB
вставляет кавычку за вас (выполняя завершение на столько, на сколько это
возможно), если вы не ввели ее в первой позиции:
(gdb) b bub TAB GDB изменяет вашу строку ввода на следующую, и издает звук: (gdb) b 'bubble(
Вообще, GDB может определить, что кавычка нужна (и вставляет
ее), если вы запрашиваете завершение перегруженного символа до того, как
начали вводить список параметров.
Для большей информации о перегруженных функциях, смотрите section Выражения Си++. Вы можете использовать команду set для отключения распознавания перегруженных
overload-resolution off
символов; смотрите section Возможности GDB для Си++.
Получение справки
Используя команду help, вы всегда можете запросить информацию о
командах у самого GDB.
helph-
Вы можете использовать
help(сокращенноh) без параметров,
для отображения короткого списка именованных классов команд:(gdb) help List of classes of commands: aliases -- Aliases of other commands breakpoints -- Making program stop at certain points data -- Examining data files -- Specifying and examining files internals -- Maintenance commands obscure -- Obscure features running -- Running the program stack -- Examining the stack status -- Status inquiries support -- Support facilities tracepoints -- Tracing of program execution without stopping the program user-defined -- User-defined commands Type "help" followed by a class name for a list of commands in that class. Type "help" followed by command name for full documentation. Command name abbreviations are allowed if unambiguous. (gdb) help класс-
Используя один из общих классов справки как параметр, вы можете получить
список отдельных команд этого класса. Вот, например, отображение справки
для классаstatus:(gdb) help status Status inquiries. List of commands: info -- Generic command for showing things about the program being debugged show -- Generic command for showing things about the debugger Type "help" followed by command name for full documentation. Command name abbreviations are allowed if unambiguous. (gdb)
help команда-
Если указать имя команды в качестве параметра
help, GDB
выведет короткую справку о том, как ей пользоваться. apropos арг-
Команда
apropos аргпроизводит поиск по регулярному
выражению, заданному в арг, во всех командах GDB и их
документации. Она выводит все найденные совпадения. Например:apropos reload
приводит к:
set symbol-reloading -- Set dynamic symbol table reloading multiple times in one run show symbol-reloading -- Show dynamic symbol table reloading multiple times in one run complete арг-
Команда
complete аргперечисляет все возможные завершения для
начала команды. Используйте арг для задания начала команды,
которую вы хотите завершить. Например,complete i
приводит к:
if ignore info inspect
Это предназначено для использования GNU Emacs.
В дополнение к help, вы можете использовать команды GDB
info и show для получения информации о состоянии вашей программы,
или о состоянии самого GDB. Каждая команда поддерживает много
тем запросов; это руководство описывает каждую тему в соответствующем месте.
Списки в разделах info и show в Алфавитном указателе
указывают на все подкоманды. See section Алфавитный указатель.
info-
Эта команда (сокращенно
i) предназначена для описания состояния
вашей программы. Например, вы можете с помощьюinfo args
просмотреть аргументы, переданные вашей программе, с помощьюinfoперечислить используемые в настоящий момент регистры, или
registers
используяinfo breakpointsвывести установленные вами точки
останова. Вы можете получить полный список подкоманд команды
infoс помощьюhelp info. set-
Вы можете присвоить переменной среды результат выражения с помощью
set. Например, вы можете установить приглашение GDB в
знак $ используяset prompt $. show-
В отличие от
info, командаshowпредназначена для описания
состояния самого GDB. Вы можете изменить почти все, что
показываетshow, используя соответствующую командуset.
Например, командойset radixвы можете задать, какую систему
счисления использовать для вывода, или просто узнать, какая система
используется в данный момент с помощью командыshow radix.Для отображения всех устанавливаемых параметров и их текущих значений,
вы можете использоватьshowбез аргументов; также можно
использоватьinfo set. Обе команды приводят к одинаковому
результату.
Вот три разнообразные подкоманды show, которые не имеют
соответствующих set-команд:
show version-
Показывает, какая версия GDB запущена. Вам следует включать
эту информацию в отчеты об ошибках в GDB. Если вы
используете несколько версий GDB, вам может потребоваться
определить, какая из них запущена; по мере развития отладчика
появляются новые команды, а старые могут исчезнуть. Кроме того, многие
распространители операционных систем поставляют модифицированные версии
GDB, также существуют модифицированные версии GDB в
GNU/Linux. Номер версии—это номер, появляющийся при старте. show copying- Выводит информацию о правах на распространение GDB.
show warranty-
Отображает заявление GNU об отсутствии гарантий, или гарантии, если
ваша версия GDB поставляется с гарантиями.
Выполнение программ под управлением GDB
Прежде чем выполнять программу под управлением GDB, при
компиляции вы должны сгенерировать отладочную информацию.
Вы можете запустить GDB с параметрами или без, в любой среде
по вашему выбору. Если вы отлаживаете программу на той же машине, на
которой выполняется GDB, вы можете перенаправить ввод и вывод
вашей программы, отлаживать уже выполняющийся процесс, или убить
дочерний процесс.
Компиляция для отладки
Для эффективной отладки программы, при компиляции вы должны
сгенерировать отладочную информацию. Эта отладочная информация
сохраняется в объектном файле; она описывает тип данных
каждой переменной или функции, и соответствие между номерами строк
исходного текста и адресами в выполняемом коде.
Чтобы запросить генерацию отладочной информации, укажите ключ `-g’
при вызове компилятора.
Многие компиляторы Си не могут обрабатывать ключи `-g’ и `-O’
вместе. Используя такие компиляторы, вы не можете создавать
оптимизированные выполняемые файлы, содержащие отладочную информацию.
GCC, GNU компилятор Си, поддерживает `-g’ с или без
`-O’, делая возможным отладку оптимизированного кода. Мы
рекомендуем, чтобы вы всегда использовали `-g’ при
компиляции программ. Вы можете думать, что ваша программа правильная,
но нет никакого смысла испытывать удачу.
Когда вы отлаживаете программу, откомпилированную с `-g -O’,
помните, что оптимизатор перестраивает ваш код; отладчик же показывает то, что
там находится в действительности. Не удивляйтесь, если
порядок выполнения не будет в точности соответствовать вашему исходному
файлу! Крайний пример: если вы определяете переменную, но нигде ее не
используете, GDB никогда не увидит этой переменной, потому
что при оптимизации компилятор ее исключит.
Некоторые вещи не работают с `-g -O’ также, как просто с `-g’,
в частности, на машинах с планированием инструкций.
Если сомневаетесь, перекомпилируйте с одним ключем `-g’, и если это
устранит проблему, пожалуйста, сообщите нам об этом как об ошибке
(включите тестовый пример!).
Ранние версии компилятора GNU Си допускали вариант ключа для отладочной
информации `-gg’. GDB больше не поддерживает этот
формат; если этот ключ есть у вашего компилятора GNU Си, не
используйте его.
Начало выполнения вашей программы
runr-
Используйте команду
runдля запуска вашей программы под
управлением GDB. Сначала вы должны задать имя программы (кроме
как на VxWorks) с параметрами GDB (see section Вход и выход из GDB), или используя командыfileилиexec-file
(see section Команды для задания файлов).
Если вы запускаете вашу программу в среде выполнения, поддерживающей
процессы, run создает подчиненный процесс, и этот процесс
выполняет вашу программу. (В средах, не поддерживающих процессы,
run выполняет переход на начало вашей программы.)
Выполнение программы зависит от определенной информации, которую она
получает от породившего ее процесса. GDB предоставляет способы
задать эту информацию, что вы должны сделать до запуска
программы. (Вы можете изменить ее после старта, но такие
изменения воздействуют на вашу программу только при следующем запуске.)
Эта информация может быть разделена на четыре категории:
- Параметры.
-
Задайте параметры, которые нужно передать вашей программе, как параметры
командыrun. Если на вашей системе доступна оболочка, она
используется для передачи параметров, так что при их описании вы можете
использовать обычные соглашения (такие как раскрывание шаблонов или
подстановка переменных).
В системах Unix, вы можете контролировать, какая оболочка используется, с
помощью переменной средыSHELL.
See section Аргументы вашей программы. - Среда.
-
Обычно ваша программа наследует свою среду от GDB, но вы
можете использовать команды GDBset environmentи
unset environment, чтобы изменить часть настроек среды, влияющих
на нее. See section Рабочая среда вашей программы. - Рабочий каталог.
-
Ваша программа наследует свой рабочий каталог от GDB. Вы
можете установить рабочий каталог GDB командойcd.
See section Рабочий каталог вашей программы. - Стандартный ввод и вывод.
-
Обычно ваша программа использует те же устройства для стандартного
ввода и вывода, что и GDB. Вы можете перенаправить ввод и
вывод в строке командыrun, или использовать командуtty,
чтобы установить другое устройство для вашей программы.
See section Ввод и вывод вашей программы.Предупреждение: Хотя перенаправление ввода и вывода работает, вы
не можете использовать каналы для передачи выходных данных отлаживаемой
программы другой программе; если вы попытаетесь это сделать, скорее
всего GDB перейдет к отладке неправильной программы.
Когда вы подаете команду run, ваша программа начинает выполняться
немедленно. See section Остановка и продолжение исполнения, для обсуждения
того, как остановить вашу программу. Как только ваша программа
остановилась, вы можете вызывать функции вашей программы, используя
команды print или call. See section Исследование данных.
Если время модификации вашего символьного файла изменилось с того
момента, когда GDB последний раз считывал символы, он
уничтожает свою символьную таблицу и считывает ее заново. При этом
GDB старается сохранить ваши текущие точки останова.
Аргументы вашей программы
Аргументы к вашей программе могут быть заданы как аргументы к команде
run.
Они передаются оболочке, которая раскрывает символы шаблонов и выполняет
перенаправление ввода-вывода, и с того момента попадают в вашу
программу. Ваша переменная среды SHELL (если она существует)
определяет, какую оболочку использует GDB. Если вы не
определите SHELL, он использует оболочку по умолчанию
(`/bin/sh' в Unix).
В не-Unix системах, программу обычно запускает непосредственно
GDB, который эмулирует перенаправление ввода-вывода через
соответствующие системные вызовы, и символы шаблонов раскрываются кодом
запуска, а не оболочкой.
run без аргументов использует те же аргументы, которые
использовались предыдущей командой run, или которые установлены
командой set args.
set args-
Задает аргументы, которые будут использоваться при следующем запуске
вашей программы. Если уset argsнет аргументов,run
выполняет вашу программу без аргументов. Если вы запустили вашу
программу с аргументами, то единственный способ запустить ее
снова без аргументов—это использоватьset argsдо следующего
запуска командойrun. show args- Показать аргументы, которые будут переданы вашей программе при ее вызове.
Рабочая среда вашей программы
Среда состоит из набора переменных среды и их значений.
Переменные среды обычно хранят такие данные, как ваше имя пользователя,
домашний каталог, тип терминала и путь поиска для
запуска программ. Как правило, вы устанавливаете переменные среды с
помощью оболочки и они наследуются всеми другими программами, которые вы
вызываете. При отладке может оказаться полезным попробовать
запустить программу в измененной среде, не перезапуская
GDB.
path каталог-
Добавить каталог в начало переменной среды
PATH(пути
поиска выполняемых файлов), как для GDB, так и для вашей
программы. Вы можете указать названия нескольких каталогов, разделив их
пробелом или системно-зависимым разделителем (`:’ в Unix, `;’
в MS-DOS и MS-Windows). Если каталог уже находится в списке путей,
он переносится в начало, так что поиск в нем будет производиться
раньше.
Вы можете использовать строку `cwd’, чтобы сослаться на
рабочий каталог, который является текущим в тот момент, когда
GDB производит поиск. Если вместо этого вы используете
`.’, то она будет указывать на тот каталог, в котором вы
выполнили командуpath. GDB заменяет `.’ в
аргументе каталог (на текущий путь) до добавления каталога к
списку путей поиска. show paths-
Отобразить список путей для поиска выполняемых файлов (переменную среды
PATH). show environment [имя-перем]-
Вывести значение переменной среды имя-перем, которое будет
передано вашей программе при ее старте. Если вы не указываете
имя-перем, вывести названия и значения всех переменных среды,
передаваемых вашей программе. Вы можете сократить
environmentкакenv. set environment имя-перем [=значение]-
Присваивает значение переменной среды имя-перем. Значение
меняется только для вашей программы, но не для самого GDB.
значение может быть любой строкой; значениями переменных среды
являются просто строки, а их интерпретацию обеспечивает ваша
программа. Параметр значение является необязательным; если он
опущен, переменная устанавливается в пустое значение.
Например, эта команда:set env USER = foo
говорит отлаживаемой программе, что при последующих запусках именем
пользователя является `foo’. (Пробелы, окружающие `=’,
использованы здесь для ясности; в действительности, они не обязательны.) unset environment имя-перем-
Удалить переменную имя-перем из среды, передаваемой вашей
программе. Это отличается от `set env имя-перем =’;
unset environmentудаляет переменную из среды, а не присваивает
ей пустое значение.
Предупреждение: В системах Unix, GDB вызывает вашу
программу, используя оболочку, указанную вашей переменной среды
SHELL, если она определена (или /bin/sh, если не
определена). Если ваша переменная SHELL указывает на оболочку,
которая выполняет файл инициализации—такой как `.cshrc' для
оболочки C-shell, или `.bashrc' для BASH—любая переменная, которую вы
установите в этом файле, воздействует на вашу программу. В этой
связи, вы можете захотеть перенести установку переменных среды в
файлы, которые выполняются только при вашем входе в систему, такие как
`.login' или `.profile'.
Рабочий каталог вашей программы
Каждый раз, когда вы запускаете свою программу командой run, она
наследует рабочий каталог от текущего рабочего каталога
GDB. В начальный момент, рабочий каталог GDB
наследуется от его родительского процесса (обычно оболочки), но вы
можете задать новый рабочий каталог командой cd из GDB.
Рабочий каталог GDB также служит каталогом по умолчанию для
команд отладчика, определяющих действия с файлами. See section Команды для задания файлов.
cd каталог-
Установить рабочий каталог GDB в каталог.
pwd- Вывести рабочий каталог GDB.
Ввод и вывод вашей программы
По умолчанию, программа, которую вы запускаете под управлением
GDB, осуществляет ввод и вывод на тот же терминал, что и
GDB. Для взаимодействия с вами, GDB переключает
терминал в свой собственный терминальный режим, но он записывает
терминальные режимы, которые использовала ваша программа, и
переключается назад к ним, когда вы продолжаете выполнение программы.
info terminal-
Отображает информацию, записанную GDB о терминальных режимах,
которые использует ваша программа.
Вы можете перенаправить ввод и/или вывод вашей программы, используя
перенаправление оболочки с помощью команды run. Например,
run > выходной-файл
запускает вашу программу, перенаправляя ее вывод в `выходной-файл'.
Другой способ задать, как ваша программа должна осуществлять ввод и
вывод—использовать команду tty. Эта команда принимает в
качестве агрумента имя файла, который будет использоваться по умолчанию
для будущих команд run. Эта команда также сбрасывает управляющий
терминал для дочернего процесса для будущих команд run.
Например,
tty /dev/ttyb
указывает, что процессы, запущенные последующими командами run,
для ввода и вывода используют по умолчанию терминал `/dev/ttyb', и
что он будет их управляющим терминалом.
Явное перенаправление в run замещает эффект команды tty
для устройств ввода-вывода, но не ее воздействие на управляющий терминал.
Когда вы используете команду tty или перенаправляете ввод в
команде run, изменяется только ввод для вашей программы.
Ввод для GDB по прежнему происходит через ваш терминал.
Отладка запущенного ранее процесса
attach идент-процесса-
Эта команда присоединяется к выполняющемуся процессу—процессу, который
был запущен вне GDB. (Командаinfo filesпоказывает ваши
активные цели.) В качестве аргумента команда получает идентификатор
процесса. Обычный способ узнать идентификатор
Unix-процесса—воспользоваться утилитойpsили командой оболочки
`jobs -l’.
attachне повторяется, если вы нажмете RET второй раз
после выполнения команды.
Чтобы использовать attach, ваша программа должна выполняться в
среде, поддерживающей процессы; например, attach не работает на
специальных машинах, не имеющих операционной системы. Вы также должны
обладать полномочиями для посылки сигнала процессу.
Когда вы используете attach, отладчик находит программу
выполняющегося процесса, производя поиск сперва в текущем рабочем
каталоге, а затем (если программа не найдена), используя пути поиска
исходных файлов (see section Определение каталогов с исходными файлами). Также, для загрузки программы вы можете
использовать команду file. See section Команды для задания файлов.
Первое, что GDB делает после подготовки указанного процесса к
отладке—останавливает его. Вы можете исследовать и изменять
присоединенный процесс всеми командами GDB, которые обычно
доступны, когда вы запускаете процессы с помощью run. Вы можете
устанавливать точки останова; вы можете пошагово выполнять программу и
продолжить ее обычное выполнение, вы можете изменять области данных.
Если вы решите продолжить выполнение процесса после присоединения к нему
GDB, вы можете использовать команду continue.
detach-
Когда вы закончили отлаживать присоединенный процесс, для его
освобождения из под управления GDB вы можете использовать
командуdetach. Отсоединение процесса продолжает его
выполнение. После командыdetach, этот процесс и
GDB снова становятся совершенно независимыми, и вы готовы
присоединить или запустить с помощьюrunдругой процесс.
detachне повторяется, если вы нажмете RET еще раз
после выполнения команды.
Если вы выйдете из GDB или используете команду run, пока
у вас есть присоединенный процесс, вы убьете этот процесс. По
умолчанию, GDB запрашивает подтверждение, если вы пытаетесь
сделать одну из этих вещей; вы можете контролировать, нужно вам это
подтверждение или нет, используя команду set confirm
(see section Необязательные предупреждения и сообщения).
Уничтожение дочернего процесса
kill-
Уничтожить дочерний процесс, в котором ваша программа выполняется под
управлением GDB.
Эта команда полезна, если вы хотите отладить дамп памяти, а не
выполняющийся процесс. GDB игнорирует любые дампы памяти, пока
ваша программа выполняется.
В некоторых операционных системах, программа не может быть выполнена вне
GDB, пока у вас есть в ней точки останова, установленные
отладчиком. В этой ситуации вы можете использовать команду
kill, чтобы разрешить выполнение вашей программы вне отладчика.
Команда kill также полезна, если вы хотите перекомпилировать и
перекомпоновать вашу программу, так как во многих системах невозможно
модифицировать исполняемый файл во время выполнения процесса. В этом
случае, когда вы в следующий раз введете run, GDB
заметит, что файл изменился, и заново прочитает символьную таблицу
(стараясь при этом сохранить ваши точки останова).
Отладка программ с несколькими нитями
В некоторых операционных системах, таких как HP-UX и Solaris, одна
программа может иметь несколько нитей выполнения. Точная семантика
нитей меняется от одной операционной системы к другой, но в общем, нити
одной программы сродни нескольким процессам—за исключением того, что
они разделяют одно адресное пространство (то есть, все они могут исследовать и
модифицировать одни и те же переменные). С другой стороны, каждая нить
имеет свои собственные регистры и стек выполнения, и, возможно, свои
собственные участки памяти.
GDB предоставляет следующие возможности для отладки
многонитевых программ:
- автоматическое уведомление о новых нитях
- `thread номер-нити‘, команда для переключения между
нитями - `info threads’, команда для запроса информации о
существующих нитях - `thread apply [номер-нити] [all] арг‘,
команда для применения некоторой команды к списку нитей - точки останова, определяемые отдельно для каждой нити
Предупреждение: Эти возможности доступны еще не в любой
конфигурации GDB, где операционная система поддерживает нити.
Если ваш GDB не поддерживает нити, эти команды не имеют
эффекта. Например, в системах без поддержки нитей, GDB ничего
не выводит на команду `info threads’, и всегда отвергает команду
thread, как в этом примере:(gdb) info threads (gdb) thread 1 Thread ID 1 not known. Use the "info threads" command to see the IDs of currently known threads.(5)
Возможности отладки нитей GDB позволяют вам наблюдать все нити
во время выполнения вашей программы, но когда управление переходит к
GDB, одна конкретная нить выделяется для отладки. Она
называется текущей нитью. Отладочные команды показывают
информацию о программе с точки зрения текущей нити.
Когда GDB обнаруживает новую нить в вашей программе, он выводит
для нее идентификатор на целевой системе с сообщением в форме `[New
сист-тег]’. Сист-тег является идентификатором нити, чья форма
различается в зависимости от конкретной системы. Например, в LynxOS вы
можете увидеть
[New process 35 thread 27]
когда GDB замечает новую нить. Напротив, в системе SGI,
сист-тег выглядит просто как `process 368′, без дополнительных
спецификаций.
Для отладочных целей, GDB присваивает свои собственные номера
нитей—всегда в виде одного целого числа—каждой нити в вашей
программе.
info threads-
Вывести краткую информацию обо всех имеющихся в данный момент в вашей
программе нитях. Для каждой нити, GDB отображает (в этом
порядке):- номер нити, назначенный GDB
- идентификатор нити на целевой системе (сист-тег)
- краткие сведения о текущем кадре стека для этой нити
Звездочка `*’ слева от номера нити GDB обозначает текущую
нить.
Например,
(gdb) info threads
3 process 35 thread 27 0x34e5 in sigpause ()
2 process 35 thread 23 0x34e5 in sigpause ()
* 1 process 35 thread 13 main (argc=1, argv=0x7ffffff8)
at threadtest.c:68
В системах HP-UX:
Для отладочных целей, GDB присваивает свои собственные номера
нитей—небольшие целые, присваиваемые в порядке создания нитей—
каждой нити в вашей программе.
Когда GDB обнаруживает новую нить в вашей программе, он выводит
как номер нити, присвоенный GDB, так и идентификатор на целевой
системе для нити с сообщением в форме `[New сист-тег]’.
сист-тег является идентификатором нити, чья форма
различается в зависимости от конкретной системы. Например, в HP-UX,
когда GDB замечает новую нить, вы увидите
[New thread 2 (system thread 26594)]
info threads-
Вывести краткую информацию обо всех имеющихся в данный момент в вашей
программе нитях. Для каждой нити, GDB отображает (в этом
порядке):- номер нити, назначенный GDB
- идентификатор нити на целевой системе (сист-тег)
- краткие сведения о текущем кадре стека для этой нити
Звездочка `*’ слева от номера нити GDB означает текущую
нить.
Например,
(gdb) info threads
* 3 system thread 26607 worker (wptr=0x7b09c318 "@")
at quicksort.c:137
2 system thread 26606 0x7b0030d8 in __ksleep ()
from /usr/lib/libc.2
1 system thread 27905 0x7b003498 in _brk ()
from /usr/lib/libc.2
thread номер-нити-
Сделать нить с номером номер-нити текущей. Аргумент команды,
номер-нити, является внутренним номером нити GDB, который
показан в первом поле `info threads’. GDB отвечает,
выводя системный идентификатор выбранной вами нити, и обзор ее кадра
стека:(gdb) thread 2 [Switching to process 35 thread 23] 0x34e5 in sigpause ()
Также как и с сообщением `[New …]’, форма текста после
`Switching to’ зависит от соглашений для идентификации нитей в
вашей системе. threads apply [номер-нити] [all] арг-
Команда
thread applyпозволяет вам применить команду к одной или
нескольким нитям. Задайте номера нитей, на которые вы хотите
воздействовать, в аргументе номер-нити. Номер-нити—это
внутренний номер нити GDB, который показан в первом поле
`info threads’. Чтобы применить команду ко всем нитям, используйте
thread apply allарг.
Когда GDB останавливает вашу программу, вследствие точки
останова или по сигналу, он автоматически выбирает нить, в которой
появилась точка останова или сигнал. GDB предупреждает вас о
переключении контекста сообщением в форме `[Switching to
сист-тег]’ для идентификации нити.
See section Остановка и запуск многонитевых программ, для
дополнительной информации о поведении GDB, когда вы
останавливаете и запускаете многонитевую программу.
See section Установка точек наблюдения, для
информации о точках наблюдения в многонитевых программах.
Отладка многонитевых программ
В большинстве систем, GDB не имеет специальной поддержки для
отладки программ, создающих дополнительные процессы с помощью функции
fork. Когда программа вызывает fork, GDB будет
продолжать отладку родительского процесса, а дочерний процесс будет
выполняться беспрепятственно. Если выполнение дочернего процесса дойдет
до места, где вы установили точку останова, дочерний процесс получит
сигнал SIGTRAP, который приведет к остановке процесса (если он не
перехватывает этот сигнал).
Однако, если вы хотите отладить дочерний процесс, существует достаточно
простое решение. Поместите вызов sleep в код программы, который
дочерний процесс выполнит после fork. Может быть удобным
вызывать sleep только если установлена определенная переменная
среды или если существует определенный файл, так что задержка не будет
происходить, если вы не захотите отлаживать дочерний процесс.
Пока дочерний процесс спит, используйте программу ps для
получения ее идентификатора процесса. Затем укажите GDB
(новому экземпляру GDB, если вы отлаживаете также и родительский
процесс) присоединиться к дочернему процессу (see section Отладка запущенного ранее процесса).
Начиная с этого момента, вы можете отлаживать дочерний процесс точно
также, как любой другой процесс, к которому вы присоединились.
В системе HP-UX (только в версиях 11.x и более поздних?) GDB
предоставляет средства для отладки программ, которые создают
дополнительные процессы, используя функции fork или vfork.
По умолчанию, когда программа ветвится, GDB будет продолжать
отладку родительского процесса, а дочерний процесс будет выполняться
беспрепятственно.
Если вы хотите отлаживать дочерний процесс вместо родительского,
используйте команду set follow-fork-mode.
set follow-fork-mode режим-
Устанавливает реакцию отладчика на вызов
forkилиvforkв
программе. Вызовforkилиvforkсоздает новый процесс.
режим может быть:parent-
После ветвления отлаживается исходный процесс. Дочерний процесс
выполняется беспрепятственно. Это поведение по умолчанию. child-
После ветвления отлаживается новый процесс. Родительский процесс
выполняется беспрепятственно. ask- Отладчик будет запрашивать один из этих вариантов.
show follow-fork-mode-
Отображает текущую реакцию отладчика на вызов
forkили
vfork.
Если вы запрашиваете отладку дочернего процесса и за
vfork следует exec, GDB выполняет новую программу
до первой точки останова, установленной в ней. Если у вас была
установлена точка останова на функции main в вашей исходной
программе, она будет также установлена на main в
дочернем процессе.
Когда дочерний процесс порождается вызовом vfork, вы не можете
отлаживать дочерний или родительский процесс до тех пор, пока не
завершится вызов exec.
Если вы даете GDB команду run после выполнения
exec, новая программа стартует заново. Чтобы перезапустить
родительский процесс, используйте команду file с именем
выполняемого файла родительской программы в качестве аргумента.
Вы можете использовать команду catch, чтобы остановить
GDB, когда сделан вызов fork, vfork или
exec. See section Установка точек перехвата.
Остановка и продолжение исполнения
Основные цели применения отладчика—остановка вашей программы до ее
завершения, или чтобы в случае нарушений в работе вашей программы вы могли
выяснить их причину.
Внутри GDB ваша программа может остановиться по нескольким
причинам, таким как сигнал, точка останова, или достижение новой строки
после команды GDB, такой как step. Затем вы можете
исследовать и изменять значения переменных, устанавливать новые точки
останова и удалять старые, и затем продолжить выполнение. Обычно,
выводимые GDB сообщения предоставляют достаточную информацию о
состоянии вашей программы, но вы также можете запросить эту информацию
явно в любое время.
info program-
Отобразить информацию о состоянии вашей программы: выполняется она или
нет, каким процессом она является и почему остановлена.
Точки останова, точки наблюдения и точки перехвата
Точка останова останавливает вашу программу всякий раз, когда ее
выполнение достигает определенной точки. Для каждой точки останова вы
можете добавлять условия для лучшего управления условиями остановки.
Вы можете устанавливать точки останова командой
break и ее вариантами (see section Установка точек останова), чтобы задать место, где должна остановиться
ваша программа, по номеру строки, имени функции или точному адресу.
В конфигурациях HP-UX, SunOS 4.x, SVR4 и Alpha OSF/1, вы можете устанавливать
точки останова в разделяемых библиотеках до запуска выполняемого файла.
В системах HP-UX существует небольшое ограничение: вы должны подождать,
пока программа не перестанет выполняться, для установки точек
останова в подпрограммах из разделяемой библиотеки, которые не
вызываются напрямую из программы (например, подпрограммах, являющихся
аргументами вызова pthread_create).
Точка наблюдения—это специальная точка останова, которая
останавливает вашу программу при изменении значения выражения. Вы
должны использовать другую команду для установки точки наблюдения
(see section Установка точек наблюдения), но
помимо этого, вы можете обращаться с ней так же, как с любой
другой точкой останова: вы включаете, отключаете и удаляете точки
останова и точки наблюдения при помощи одних и тех же команд.
Вы можете установить, что значения из вашей программы должны
отображаться автоматически, когда GDB останавливается в точке
останова. See section Автоматическое отображение.
Точка перехвата—это другая специализированная точка останова,
которая останавливает вашу программу при возникновении события
определенного типа, такого как выбрасывание исключения в Си++ или
загрузка библиотеки. Также как с точками наблюдения, вы используете
другую команду для установки точки перехвата, (see section Установка точек перехвата), но помимо этого, вы можете
обращаться с ней так же, как с любой другой точкой останова. (Для
остановки, когда ваша программа получает сигнал, используйте команду
handle; смотрите section Сигналы.)
Когда вы создаете точку останова, наблюдения или перехвата, GDB
присваивает ей номер; эти номера являются последовательными
целыми числами, начинающимися с единицы. Во многих командах для
управления различными возможностями точек останова, вы используете эти
номера для указания, какую точку останова вы хотите изменить. Каждая
точка останова может быть включена или отключена; если точка
останова отключена, она не оказывает никакого влияния на вашу программу,
пока вы снова не включите ее.
Некоторые команды GDB допускают в качестве указания точек
останова, на которые они действуют, их диапазоны. Диапазон точек
останова—это или номер одной точки, например `5′, или два таких
номера, в порядке увеличения, разделенные дефисом, например `5-7′.
Когда команде задается диапазон точек останова, она действует на все
точки останова в этом диапазоне.
Установка точек останова
Точки останова устанавливаются командой break (сокращенно
b). Вспомогательная переменная отладчика `$bpnum’ хранит
номер последней установленной вами точки останова; смотрите
section Вспомогательные переменные, для
обсуждения того, что вы можете делать со вспомогательными переменными.
Вы можете задавать место для установки новой точки останова несколькими
способами.
break функция-
Установить точку останова на входе в функцию функция.
При использовании языков, допускающих перегрузку символов, таких как
Си++, функция может ссылаться более чем на одно возможное место
останова. See section Меню точки останова, для
обсуждения такой ситуации. break +смещениеbreak -смещение-
Установить точку останова через несколько строк впереди или сзади от
позиции, на которой выполнение остановилось в текущем выбранном
кадре стека. (See section Кадры стека, для описания кадров стека.) break номер-строки-
Установить точку останова на строке номер-строки в текущем
исходном файле. Текущий исходный файл—это файл, исходный текст
которого отображался последним. Точка останова остановит вашу программу
сразу перед выполнением какого-либо кода на этой строке. break имя-файла:номер-строки-
Установить точку останова на строке номер-строки в исходном
файле имя-файла. break имя-файла:функция-
Установить точку останова на входе в функцию,
находящуюся в файле имя-файла. Указание имени файла вместе с
именем функции является излишним, за исключением ситуаций, когда
несколько файлов содержат одинаково названные функции. break *адрес-
Установить точку останова по адресу адрес. Вы можете
использовать это для установки точек останова в тех частях вашей
программы, которые не имеют отладочной информации или исходных файлов. break-
При вызове без аргументов,
breakустанавливает точку останова на
инструкции, которая должна быть выполнена следующей в выбранном кадре
стека (see section Исследование стека). В любом выбранном кадре,
кроме самого внутреннего, это останавливает вашу программу, как только
управление возвращается в этот кадр. Это похоже на результат команды
finishв кадре внутри выбранного кадра—за исключением того, что
finishне оставляет активной точки останова. Если вы используете
breakбез аргументов в самом внутреннем кадре, GDB
останавливается, когда в следующий раз достигает текущего места; это
может быть полезно внутри циклов.
Обычно GDB игнорирует точки останова, когда он возобновляет
выполнение, пока не будет выполнена хотя бы одна
инструкция. Если бы он этого не делал, вы не могли бы продолжать
выполнение после точки останова, не отключив сперва эту точку останова.
Это правило применяется вне зависимости от того, существовала или нет
точка останова, когда ваша программа остановилась. break ... if усл-
Установить точку останова с условием усл; каждый раз, когда
достигается точка останова, происходит вычисление выражения усл, и
остановка происходит только если эта величина не равна нулю—то есть, если
усл истинно. `…’ означает один из возможных
аргументов, перечисленных выше (или отсутствие аргументов), описывающих
место остановки. See section Условия останова, для большей
информации об условных точках останова. tbreak арг-
Установить точку останова только до первой активизации. Аргументы
арг такие же, как для командыbreak, и точка останова
устанавливается аналогичным образом, но она автоматически уничтожается
после того, как ваша программа первый раз на ней остановится.
See section Отключение точек останова. hbreak арг-
Установить аппаратно-поддерживаемую точку останова.
Аргументы арг такие же, как и для командыbreak, и точка
останова устанавливается аналогичным образом, но она требует аппаратной
поддержки и некоторые целевые платформы могут ее не иметь. Основной
целью этого является отладка кода EPROM/ROM, так что вы можете установить точку
останова на инструкции без изменения инструкции. Это может быть
использовано с новой генерацией ловушек, предоставляемой SPARClite DSU и
некоторыми машинами на базе x86. Эти платформы будут генерировать
ловушки, когда программа обращается к некоторым данным или адресу
инструкции, которые назначены регистрам отладки. Однако, регистры
аппаратных точек останова могут хранить ограниченное число точек
останова. Например, на DSU, только две точки останова могут быть
установлены одновременно, и GDB будет отвергать эту команду,
если используется больше. Удалите или отключите неиспользуемые
аппаратные точки останова перед установкой новых (see section Отключение точек останова). See section Условия останова. thbreak арг-
Установить аппаратно-поддерживаемую точку останова,
включенную только до первой активизации. Аргументы арг такие же,
как и для командыhbreak, и точка останова устанавливается
аналогичным образом. Однако, как в случае командыtbreak, точка
останова автоматически уничтожается после того, как программа первый раз
на ней остановится. Также, как и в случае командыhbreak,
точка останова требует аппаратной поддержки и некоторые аппаратные
платформы могут ее не иметь. See section Отключение точек останова. Смотрите также section Условия останова. rbreak рег-выр-
Установить точки останова на всех функциях, удовлетворяющих
регулярному выражению рег-выр. Эта команда устанавливает
безусловные точки останова при всех совпадениях, выводя список всех
установленных точек останова. После установки,
они рассматриваются точно так же, как точки останова,
установленные командойbreak. Вы можете удалять их, отключать,
или делать их условными таким же способом, как любые другие точки
останова.
Регулярные выражения имеют стандартный синтаксис, используемый такими
средствами, как`grep'. Заметьте, что это отличается от
синтаксиса, используемого оболочками; так, например,foo*
подходит для всех функций, которые включаютfo, за которым
следует любое число буквo. Существует неявное.*в
начале и в конце введенного вами регулярного выражения, так что для
нахождения только тех функций, которые начинаются наfoo,
используйте^foo.
При отладке программ, написанных на Си++,rbreakполезна для
установки точек останова на перегруженных функциях, не являющихся
членами никакого специального класса. info breakpoints [n]info break [n]info watchpoints [n]-
Вывести таблицу всех установленных и не удаленных точек останова,
наблюдения и перехвата, со следующими колонками для каждой точки:- Номер точки останова
- Тип
- Точка останова, наблюдения или перехвата.
- План
- Помечена ли точка останова для отключения или удаления после активации.
- Включена или отключена
-
Включенные точки останова помечаются как `y’. `n’ отмечает
отключенные точки. - Адрес
- Адрес памяти, где расположена точка останова в вашей программе.
- Где
- Файл и номер строки, где расположена точка останова в исходном файле.
Если точка останова условная,
info breakпоказывает условие на
строке, следующей за этой точкой; команды точки останова, если они есть,
перечисляются после этого.
info breakс номером точки останова n в качестве аргумента
отображает только эту точку. Вспомогательная переменная$_и
адрес по умолчанию для исследования для командыxустанавливаются
равными адресу последней из перечисленных точек останова (see section Исследование памяти).
info breakотображает то число раз, которое точка останова была
активирована. Это особенно полезно при использовании вместе с командой
ignore. Вы можете игнорировать большое число активаций точки
останова, посмотреть информацию о точке останова чтобы узнать, сколько
раз она активировалась, и затем запустить заново, игнорируя на единицу
меньше, чем это число. Это быстро приведет вас к последней активации
этой точки останова.
GDB позволяет вам установить любое число точек останова в
одном и том же месте вашей программы. В этом нет ничего глупого или
бессмысленного. Когда точки останова являются условными, это даже
полезно (see section Условия останова).
GDB сам иногда устанавливает точки останова в вашей программе
для специальных целей, таких как правильная обработка longjmp (в
программах на Си). Этим внутренним точкам останова присваиваются
отрицательные номера, начиная с -1; `info breakpoints’ не
отображает их.
Вы можете увидеть эти точки останова с помощью служебной команды
GDB `maint info breakpoints’.
maint info breakpoints-
Используя тот же формат, что и `info breakpoints’, отобразить как
точки останова, установленные вами явно, так и те, которые
GDB использует для внутренних целей. Внутренние точки останова
показываются с отрицательными номерами. Колонка типа определяет, какого
типа точка останова показана:breakpoint- Обычная, явно установленная точка останова.
watchpoint- Обычная, явно установленная точка наблюдения.
longjmp-
Внутренняя точка останова, используемая для корректной обработки
пошагового выполнения вызововlongjmp. longjmp resume-
Внутренняя точка останова на цели
longjmp. until-
Временная внутренняя точка останова, используемая командой GDB
until. finish-
Временная внутренняя точка останова, используемая командой GDB
finish. shlib events- События в разделяемых библиотеках.
Установка точек наблюдения
Вы можете использовать точку наблюдения для остановки
выполнения, как только изменится значение какого-либо выражения, не
предсказывая конкретное место, где это может произойти.
В зависимости от вашей системы, точки наблюдения могут быть реализованы
программно или аппаратно. GDB осуществляет программную реализацию
точек наблюдения путем пошагового выполнения вашей программы и проверки
значения переменной на каждом шаге, что в сотни раз медленнее
нормального выполнения. (Но тем не менее это может стоить того, найти
ошибку в программе, когда вы не представляете, в какой ее части она
находится, может быть очень нелегко.)
В некоторых системах, таких как HP-UX, Linux и некоторых других
платформах, базирующихся на x86, GDB включает поддержку для
аппаратных точек наблюдения, которые не замедляют выполнение вашей
программы.
watch выраж-
Устанавливает точку наблюдения за выражением. GDB остановит
программу, когда выраж сохраняется программой и его величина
изменяется. rwatch выраж-
Устанавливает точку наблюдения, которая остановит программу, когда
наблюдаемое выраж считывается программой. awatch выраж-
Устанавливает точку наблюдения, которая остановит программу, когда
выраж либо считывается, либо сохраняется программой. info watchpoints-
Эта команда печатает список точек наблюдения, останова и перехвата; это
то же самое, что иinfo break.
Когда это возможно, GDB устанавливает аппаратную точку
наблюдения. Аппаратные точки наблюдения выполняются очень быстро, и
отладчик сообщает об изменении величины точно в месте инструкции, где это
изменение произошло. Если GDB не может установить аппаратную
точку наблюдения, он устанавливает программную точку наблюдения, которая
выполняется намного медленнее и сообщает об изменении величины на следующем
операторе, а не инструкции, после появления изменения.
Когда вы даете команду watch, GDB сообщает
Hardware watchpoint номер: выраж
если ему удалось установить аппаратную точку наблюдения.
В настоящее время, команды awatch и rwatch могут
устанавливать только аппаратные точки наблюдения, так как доступы к данным,
которые не изменяют величины наблюдаемого выражения, не могут быть
замечены без исследования каждой инструкции во время ее выполнения, а
GDB пока этого не делает. Если GDB обнаруживает, что
не может установить аппаратную точку останова командами awatch
или rwatch, он напечатает сообщение, аналогичное этому:
Expression cannot be implemented with read/access watchpoint.(6)
Иногда GDB не может установить аппаратную точку наблюдения из-за
того, что тип данных наблюдаемого выражения занимает больше места, чем
допускает аппаратная точка наблюдения на целевой платформе. Например,
некоторые системы позволяют наблюдать за областями, занимающими до 4
байт; на таких системах вы не можете устанавливать аппаратные точки
наблюдения за выражениями, которые в результате дают число
с плавающей точкой двойной точности (которое обычно занимает 8 байт). В
качестве одного из решений, можно разбить большую область на несколько
меньших областей, и затем наблюдать за каждой из них с помощью отдельной
точки наблюдения.
Если вы установите слишком много аппаратных точек наблюдения,
GDB может быть не в состоянии задействовать их все, когда вы
возобновите выполнение вашей программы. Так как точное количество
активных точек наблюдения неизвестно до того момента, когда ваша
программа должна возобновить выполнение, GDB может быть не в
состоянии предупредить вас об этом, когда вы устанавливаете точку
наблюдения, и предупреждение будет напечатано только когда программа
возобновит выполнение:
Hardware watchpoint номер: Could not insert watchpoint(7)
Если это происходит, удалите или отключите некоторые точки наблюдения.
SPARClite DSU будет генерировать ловушки, когда программа обращается к
некоторым данным или адресу инструкции, которые отведены для отладочных
регистров. Для адресов данных, DSU упрощает команду watch.
Однако, аппаратные регистры точек останова могут принять только две
точки наблюдения за данными, и обе точки наблюдения должны быть одного
типа. Например, вы можете установить две точки наблюдения с помощью
команды watch, две с помощью команды rwatch, или
две с помощью команды awatch, но вы не можете установить одну
точку наблюдения с помощью одной команды, а другую с помощью другой.
GDB не примет команду, если вы попытаетесь смешать различные
точки наблюдения. Удалите или отключите неиспользуемые точки наблюдения
перед установкой новых.
Если вы вызываете функцию интерактивно, используя print или
call, все установленные вами точки наблюдения будут неактивными,
до тех пор пока GDB не достигнет точки останова другого типа,
или пока вызов не завершится.
GDB автоматически удаляет точки наблюдения, которые наблюдают
за локальными переменными, или за выражениями, которые используют такие
переменные, когда они выходят из области видимости, то есть когда
выполнение покидает блок, в котором эти переменные были определены. В
частности, когда отлаживаемая программа завершается, все
локальные переменные выходят из области видимости, и таким образом
остаются установленными только те точки наблюдения, которые наблюдают за
глобальными переменными. Если вы снова запустите программу, вы должны
будете заново установить все такие точки наблюдения. Одним из способов
сделать это будет установить точку останова на входе в функцию
main, и, когда программа остановится, установить все точки
наблюдения.
Предупреждение: В многонитевых программах точки наблюдения
являются лишь частично полезными. С текущей реализацией точек
наблюдения, GDB может наблюдать только за величиной выражения
в одной нити. Если вы уверены, что выражение может измениться
только вследствие действий внутри текущей нити (и если вы также уверены,
что никакая другая нить не может стать текущей), то вы можете
использовать точки наблюдения как обычно. Однако, GDB может не
заметить, когда действия в не текущей нити изменяют выражение.Предупреждение для HP-UX: В многонитевых программах, программные
точки наблюдения
являются лишь частично полезными. Если GDB создает программную
точку наблюдения, она может наблюдать только за величиной выражения
в одной нити. Если вы уверены, что выражение может измениться
только вследствие действий внутри текущей нити (и если вы также уверены,
что никакая другая нить не может стать текущей), то вы можете использовать
программные точки наблюдения как обычно. Однако, GDB может не
заметить, когда действия в не текущей нити изменяют выражение.
(Аппаратные же точки наблюдения напротив, наблюдают за выражением во
всех нитях.)
Установка точек перехвата
Вы можете использовать точки перехвата, чтобы вызвать остановку
отладчика в ответ на определенные типы событий в программе, такие как
исключения в Си++ или загрузка разделяемой библиотеки. Для установки
точки перехвата используйте команду catch.
catch событие-
Остановиться, когда происходит событие. Событие может быть
одним из:throw-
Выбрасывание исключения Си++.
catch-
Перехват исключения Си++.
exec-
Вызов
exec. В настоящее время это доступно только на HP-UX. fork-
Вызов
fork. В настоящее время это доступно только на HP-UX. vfork-
Вызов
vfork. В настоящее время это доступно только на HP-UX. loadload имя-библ-
Динамическая загрузка любой разделяемой библиотеки, или загрузка
библиотеки имя-библ. В настоящее время это доступно только на
HP-UX. unloadunload имя-библ-
Выгрузка любой динамически загруженной разделяемой библиотеки, или
выгрузка библиотеки имя-библ. В настоящее время это доступно
только на HP-UX.
tcatch событие-
Установить точку перехвата, которая включена только до первой
активации. Точка перехвата автоматически уничтожается после того, как
событие перехвачено первый раз.
Используйте команду info break для получения списка текущих точек
перехвата.
В настоящее время, в GDB существуют некоторые ограничения на
обработку исключений Си++ (catch throw и catch catch):
-
Если вы вызываете функцию интерактивно, GDB обычно возвращает
вам управление после того, как функция закончила выполнение. Однако,
если вызов возбуждает исключение, он может обойти механизм, возвращающий
вам управление, и заставить вашу программу либо остановиться, либо просто
продолжить выполнение до тех пор, пока она не активирует точку останова,
получит сигнал, который ждет GDB, или выйдет. Это имеет место
даже если вы установите точку перехвата для исключения; точки перехвата
для исключений отключены при интерактивных вызовов. - Вы не можете возбуждать исключения интерактивно.
- Вы не можете интерактивно установить обработчик исключения.
Иногда catch не является лучшим способом отладки обработки
исключений: если вам необходимо точно знать, где исключение возбуждено,
то лучше остановиться до того, как вызван обработчик исключения,
так как в этом случае вы можете увидеть стек до того, как произойдет
какое-либо развертывание.
Если вместо этого вы установите точку останова в обработчике исключений,
то может быть нелегко определить, где исключение было возбуждено.
Для остановки сразу перед вызовом обработчика исключений, вам необходимы
некоторые знания о реализации. В случае GNU Си++, исключения
возбуждаются путем вызова библиотечной функции __raise_exception,
которая имеет следующий интерфейс ANSI Си:
/* addr -- где хранится идентификатор исключения.
id -- идентификатор исключения. */
void __raise_exception (void **addr, void *id);
Для того, чтобы отладчик перехватывал все исключения до того, как
произойтет развертывание стека, установите точку останова на
__raise_exception (see section Точки останова, точки наблюдения и точки перехвата).
С помощью условных точек останова (see section Условия останова),
зависящих от величины id, вы можете остановить вашу программу,
когда возбуждается определенное исключение. Вы можете использовать
несколько условных точек останова, чтобы остановить программу, когда
возбуждается любое из нескольких исключений.
Удаление точек останова
Часто бывает необходимо уничтожить точку останова, наблюдения или
перехвата, когда она сделала свое дело и вы больше не хотите
останавливать там свою программу. Это называется уничтожением
точки останова. Точка останова, которая была уничтожена, более не
существует; она забыта.
С помощью команды clear вы можете удалять точки останова в
соответствии с тем, где они находятся в вашей программе. С помощью
команды delete вы можете удалять отдельные точки останова,
наблюдения или перехвата, указывая их номера.
Не обязательно удалять точку останова, чтобы продолжить выполнение после
нее. GDB автоматически игнорирует точки останова на первой
инструкции, которая должна быть выполнена, когда вы продолжаете
исполнение без изменения адреса выполнения.
clear-
Удаляет любые точки останова, установленные на следующей инструкции,
которая должна быть выполнена в выбранном кадре стека (see section Выбор кадра). Когда выбран самый внутренний кадр, это хороший способ
удалить ту точку останова, на которой ваша программа только что
остановилась. clear функцияclear имя-файла:функция- Удалить любые точки останова, установленные на входе в функцию.
clear номер-строкиclear имя-файла:номер-строки-
Удалить все точки останова, установленные на или внутри кода на
указанной строке. delete [breakpoints] [диапазон...]-
Удалить точки останова, наблюдения или перехвата из диапазона, указанного
в качестве аргумента. Если аргумент не задан, удалить все точки
останова (GDB запрашивает подтверждение, если у вас не
установленоset confirm off). Вы можете сократить это команду
какd.
Отключение точек останова
Вместо того, чтобы удалять точку останова, наблюдения или перехвата, вам
может быть удобнее отключить ее. Это делает точку останова
бездействующей, как если бы она была удалена, но информация о ней
запоминается, так что вы можете позже включить ее
снова.
Вы отключаете и включаете точки останова, наблюдения и перехвата
командами enable и disable, возможно указывая один или
более номеров точек останова в качестве аргументов. Используйте
info break или info watch для распечатки списка точек
останова, наблюдения и перехвата, если вы не знаете какие номера
использовать.
Точка останова, наблюдения или перехвата может находиться в одном из четырех
состояний:
-
Включена. Точка останова останавливает вашу программу. Точка останова,
установленная командойbreak, изначально находится в таком состоянии. - Отключена. Точка останова не оказывает воздействия на вашу программу.
-
Включена до первого срабатывания. Точка останова останавливает вашу
программу, но потом становится отключенной. -
Включена для удаления. Точка останова останавливает вашу программу, но
сразу после этого она удаляется навсегда. Точка останова, установленная
командойtbreak, изначально находится в этом состоянии.
Вы можете использовать следующие команды для включения или отключения
точек останова, наблюдения и перехвата:
disable [breakpoints] [диапазон...]-
Отключить указанные точки останова, или все точки останова, если ни
одна не перечислена. Отключенная точка останова не оказывает никакого
действия, но она не забывается. Все параметры, такие как счетчик
игнорирований, условия и команды запоминаются, на случай, если точка
останова позже будет снова включена. Вы можете сокращатьdisable
какdis. enable [breakpoints] [диапазон...]-
Включает указанные (или все определенные) точки останова. Они
снова становятся значимыми для остановки вашей программы. enable [breakpoints] once диапазон...-
Временно включить указанные точки останова. GDB отключает
любую из этих точек останова немедленно после срабатывания. enable [breakpoints] delete диапазон...-
Включить указанные точки останова до первого срабатывания, затем
уничтожить. GDB удаляет любую из этих точек останова, как
только ваша программа останавливается на ней.
Кроме точек останова, установленных командой tbreak
(see section Установка точек останова),
установленные вами точки останова изначально включены; следовательно,
они становятся отключенными или включенными только когда вы используете
одну из вышеперечисленных команд. (Команда until может
устанавливать и удалять свою собственную точку останова, но она не
изменяет состояние ваших других точек останова; см. section Продолжение и выполнение по шагам.)
Условия останова
Простейшая точка останова останавливает вашу программу каждый раз, когда
управление достигает заданного места. Вы можете также указать
условие для точки останова. Условие является просто булевым
выражением в вашем языке программирования (see section Выражения). Точка останова с условием вычисляет выражение каждый раз,
когда ваша программа достигает ее, и ваша программа остановится только в
том случае, если условие истинно.
Это противоположно использованию утверждений для проверки правильности
программы; в этом случае, вы хотите остановиться, когда утверждение
нарушается—то есть, когда условие ложно. В Си, если вы хотите
проверить утверждение, выраженное условием assert, вы должны
установить условие `! assert‘ на соответствующей точке
останова.
Условия также допускаются для точек наблюдения; вам они могут не
понадобиться, так как точка наблюдения так или иначе контролирует значение
выражения—но может оказаться проще, скажем, просто установить точку
наблюдения на имя переменной и указать условие, проверяющее, является ли
новое значение тем, которое нас интересует.
Условия останова могут иметь побочные эффекты, и даже могут вызывать
функции в вашей программе. Это может быть полезным, например, для
активации функций, которые запоминают продвижение выполнения вашей
программы, или для использования ваших собственных функций печати для
форматирования специальных структур данных. Результаты полностью
предсказуемы, если нет другой включенной точки останова по тому же
адресу. (В этом случае, GDB может сначала увидеть другую точку
останова и остановить вашу программу программу без проверки условия
первой точки останова.) Заметьте, что команды точек останова обычно
более удобны и гибки, чем условия останова, для выполнения побочных
эффектов, когда достигается точка останова
(see section Команды точки останова).
Условия останова могут быть заданы в момент установки точки останова,
используя `if’ в аргументах команды break. See section Установка точек останова. Они могут быть также
изменены в любой момент с помощью команды condition.
Вы также можете использовать ключевое слово if с командой
watch. Команда catch не распознает ключевое слово
if; condition является единственным способом наложить
дальнейшие условия на точку перехвата.
condition номер выражение-
Задайте выражение как условие остановки для точки останова,
наблюдения или перехвата с номером номер. После того, как вы
установили условие, данная точка останова остановит вашу программу только
если значение выражения будет истинным (ненулевым, в Си). Когда
вы используетеcondition, GDB немедленно проверяет
выражение на синтаксическую корректность и для определения, что
символы в нем имеют объекты ссылки в контексте вашей точки останова.
Если выражение использует символы, не существующие в контексте
точки останова, GDB выведет сообщение об ошибке:No symbol "foo" in current context.(8)
Однако, GDB в действительности не вычисляет выражение в
момент подачи командыcondition(или команды, устанавливающей
точку останова с условием, такой какbreak if ...).
See section Выражения. condition номер-
Снимает условие с точки останова с номером номер. Она становится
обычной безусловной точкой останова.
Специальным случаем условия для точки останова является остановка только
когда точка останова была достигнута определенное число раз. Это
настолько полезно, что существует специальный способ сделать это,
используя счетчик игнорирования точки останова. Каждая точка
останова имеет счетчик игнорирования, являющийся целым числом.
Как правило, счетчик игнорирования равен нулю, и,
следовательно, не производит никакого действия. Но если ваша программа
достигает точки останова, чей счетчик игнорирования положителен, тогда
вместо того чтобы остановиться, она лишь уменьшит его на единицу и
продолжит выполнение. В результате, если величина счетчика
игнорирования равна n, точка останова не остановит программу
следующие n раз, когда программа его достигнет.
ignore номер значение-
Устанавливает счетчик игнорирований точки останова с номером номер в
значение. Следующие значение раз, когда точка останова
будет достигнута, выполнение вашей программы не будет остановлено; кроме
как уменьшить счетчик игнорирований, GDB не производит никаких
действий.
Чтобы точка останова сработала при следующем достижении, установите
счетчик в ноль.
Когда вы используетеcontinueдля возобновления выполнения вашей
программы от точки останова, вы можете установить счетчик игнорирований
непосредственно как аргумент кcontinue, а не использовать
ignore. See section Продолжение и выполнение по шагам.
Если точка останова имеет положительный счетчик игнорирований и условие,
то условие не проверяется. Как только счетчик игнорирований достигнет
нуля, GDB возобновит проверку условия.
Вы можете достигнуть эффекта счетчика игнорирований с помощью такого
условия, как `$foo— <= 0′, используя вспомогательную
переменную отладчика, которая уменьшается каждый раз.
See section Вспомогательные переменные.
Счетчики игнорирований можно использовать с точками останова, точками
наблюдения и точками перехвата.
Команды точки останова
Вы можете подать любой точке останова (наблюдения или
перехвата) ряд команд, которые будут выполняться при остановке вашей
программы на этой точке останова. Например, вы можете захотеть вывести
значения определенных выражений, или включить другие точки останова.
commands [номер]... список-команд ...end-
Определяет список команд для точки останова с номером номер. Сами
команды указываются в следующих строках. Для завершения списка команд,
введите строку, содержащую толькоend.
Чтобы удалить все команды от точки останова, введитеcommandsи
немедленно за этимend, то есть задайте пустой список команд.
Без аргумента номер,commandsотносится к последней
установленной точке останова, наблюдения или перехвата (но не к
последней встреченной).
Нажатие RET, как средство повторения последней команды
GDB, отключено внутри списка-команд.
Вы можете использовать команды для точки останова, чтобы снова запустить
вашу программу на выполнение. Просто используйте команду continue, или
step, или любую другую команду, возобновляющую выполнение.
После команды, возобновляющей выполнение, любые другие команды в списке
игнорируются. Так сделано потому, что каждый раз, когда вы
возобновляете выполнение (даже просто с помощью next или
step), вы можете встретить другую точку останова—которая может
иметь свой собственный список команд, что приведет к неоднозначности,
какой из списков выполнять.
Если в качестве первой команды в списке команд вы укажете silent,
обычное сообщение об остановке на точке останова не будет выводиться.
Это может быть желательно для точек останова, которые должны вывести
определенное сообщение, и затем продолжить выполнение. Если никакая из
оставшихся команд ничего не выводит, вы не увидите никакого знака о том,
что точка останова была достигнута. silent имеет смысл только в
начале списка команд точки останова.
Команды echo, output и printf позволяют вам
более точно контролировать выводимый текст, и часто полезны в «тихих»
точках останова. See section Команды для управляемого вывода.
Например, вот как вы можете использовать команды точки останова для
вывода величины x на входе в foo, когда x
положительна.
break foo if x>0 commands silent printf "x is %dn",x cont end
Одним из применений команд точки останова является компенсация одной
ошибки, так, чтобы вы могли искать другую. Поместите точку останова
сразу после строки кода, содержащей ошибку, задайте ей условие для
определения случая, в котором было сделано что-то ошибочное, и
определите команды для присвоения правильных значений тем переменным,
для которых это требуется. Закончите командой continue, чтобы
ваше программа не останавливалась, а начните с команды silent,
чтобы не было никакого вывода. Вот пример:
break 403 commands silent set x = y + 4 cont end
Меню точки останова
Некоторые языки программирования (особенно Си++) допускают, чтобы одно и
то же имя функции было определено несколько раз, для применения в
различных контекстах. Это называется перегрузкой. Когда имя
функции перегружается, `break функция‘ не достаточно, чтобы
указать GDB, где вы хотите установить точку останова.
Если вы столкнулись с этой проблемой, вы можете использовать что-то типа
`break функция(типы)’ для указания, какую конкретную
версию функции вы имеете в виду. В противном случае, GDB
предлагает вам выбор из пронумерованных вариантов для различных
возможных точек останова, и ждет вашего выбора с приглашением
`>’. Первыми двумя вариантами всегда являются `[0] cancel’
и `[1] all’. Ввод 1 устанавливает точку останова на каждом
определении функции, и ввод 0 прерывает команду break
без установки новых точек останова.
Например, следующая выдержка из сеанса иллюстрирует попытку установить
точку останова на перегруженном символе String::after. Мы
выбрали три конкретных определения имени функции:
(gdb) b String::after [0] cancel [1] all [2] file:String.cc; line number:867 [3] file:String.cc; line number:860 [4] file:String.cc; line number:875 [5] file:String.cc; line number:853 [6] file:String.cc; line number:846 [7] file:String.cc; line number:735 > 2 4 6 Breakpoint 1 at 0xb26c: file String.cc, line 867. Breakpoint 2 at 0xb344: file String.cc, line 875. Breakpoint 3 at 0xafcc: file String.cc, line 846. Multiple breakpoints were set. Use the "delete" command to delete unwanted breakpoints. (gdb)
«Не удается поместить точки останова»
В некоторых операционных системах точки останова не могут быть
использованы в программе, если какой-либо другой процесс выполняет эту
программу. В этом случае, попытка выполнить или продолжить выполнение
программы с точкой останова приводит тому, что GDB печатает
сообщение об ошибке:
Cannot insert breakpoints. The same program may be running in another process.(9)
Когда это происходит, у вас есть три варианта дальнейших действий:
- Удалить или отключить точки останова, и затем продолжить.
-
Приостановить GDB и скопировать файл, содержащий вашу
программу, под другим иненем. Возобновить работу GDB и
использовать командуexec-fileдля указания, что GDB
должен выполнять вашу программу под этим именем. Затем запустите вашу
программу снова. -
Скомпоновать заново вашу программу так, чтобы сегмент текста был
неразделяемым, используя ключ компоновщика `-N’. Ограничения
операционной системы могут не распространяться на неразделяемые
выполняемые файлы.
Аналогичное сообщение может выводиться, если вы запрашиваете слишком
много активных аппаратно-поддерживаемых точек останова и наблюдения:
Stopped; cannot insert breakpoints. You may have requested too many hardware breakpoints and watchpoints.(10)
Это сообщение выводится, когда вы пытаетесь возобновить выполнение
программы, так как только тогда GDB знает точно, сколько аппаратных
точек останова и наблюдения ему нужно установить.
Когда это сообщение выводится, вам необходимо отключить или удалить
некоторые аппаратно-поддерживаемые точки останова и наблюдения, и затем
продолжить.
Продолжение и выполнение по шагам
Продолжение означает возобновление выполнения программы до ее
нормального завершения. Напротив, пошаговое выполнение означает
выполнение еще одного «шага» вашей программы, где «шаг» быть либо
одной строкой исходного кода, либо одной машинной инструкцией (в
зависимости от того, какую именно команду вы используете). И в
случае продолжения, и в случае выполнения по шагам, ваша программа
может остановиться и раньше, вследствие точки останова или сигнала.
(Если она останавливается по сигналу, вы можете использовать
handle, или `signal 0′ для возобновления выполнения.
See section Сигналы.)
continue [счетчик-игнор]c [счетчик-игнор]fg [счетчик-игнор]-
Возобновить выполнение программы, с того адреса, где ваша программа
остановилась последний раз; все точки останова, установленные по этому
адресу, пропускаются. Необязательный аргумент счетчик-игнор
позволяет вам задать количество последующих игнорирований точки останова
в этом месте; его действие совпадает с действиемignore
(see section Условия останова).
Аргумент счетчик-игнор имеет смысл только если ваша программа
остановилась в точке останова. В остальных случаях, аргумент к
continueигнорируется.
Синонимыcиfg(от foregroung, так как отлаживаемая
программа считается фоновой), предоставляются исключительно для
удобства, и имеют в точности тот же смысл, что иcontinue.
Чтобы возобновить выполнение с другого места, вы можете использовать
return (see section Возврат из функции) чтобы вернуться
назад к вызывающей функции; или jump (see section Продолжение исполнения с другого адреса) для перехода к произвольному месту в
вашей программе.
Типичная техника для использования пошагового выполнения заключается в
установке точки останова (see section Точки останова, точки наблюдения и точки перехвата) на начале функции или раздела вашей программы,
где предположительно находится ошибка, выполнении вашей программы до
остановки на этой точке останова, и затем пошаговом выполнении
подозреваемого участка, с исследованием интересуемых переменных, пока вы
не увидите, что случилась ошибка.
step-
Продолжить выполнение вашей программы, пока управление не достигнет
другой строки исходного текста, затем остановить ее и возвратить
управление GDB. Эту команду можно сокращать доs.Предупреждение: Если вы используете команду
step, когда
управление находится внутри функции, которая была скомпилирована без
отладочной информации, выполнение продолжается, пока управление не
достигнет функции, которая имеет ее. Аналогично, пошаговое
выполнение не будет заходить в функцию, скомпилированную без отладочной
информации. Для пошагового выполнения таких функций
используйте командуstepi, описанную ниже.Команда
stepостанавливается только на первой инструкции строки
исходного текста. Это предотвращает множественные остановки, которые
в противном случае могут возникнуть в оператореswitch, цикле
for, и так далее.stepпродолжает останавливаться, если
функция, имеющая отладочную информацию, вызывается внутри строки.
Другими словами,stepзаходит внутрь функций, вызываемых в
данной строке.
Также, командаstepвходит в функцию только если для нее существует
информация о номерах строк. Иначе она действует как команда
next. Это позволяет избежать проблем, появляющихся при
использованииcc -glна машинах MIPS. Раньшеstep
заходила в подпрограмму, если существовала хоть какая-нибудь отладочная
информация о подпрограмме. step число-
Продолжает выполнение как по команде
step, но делает это
число раз. Если достигается точка останова, или приходит
сигнал, не связанный с пошаговым выполнением, до выполнения числа
шагов, пошаговое выполнение сразу останавливается. next [число]-
Продолжает выполнение до следующей строки исходного текста в текущем
(внутреннем) кадре стека. Это аналогичноstep, но вызовы
функций, которые появляются внутри строки кода, выполняются без
остановки. Выполнение останавливается, когда управление достигает другой
строки кода в исходном уровне стека, который выполнялся, когда вы дали
командуnext. Эта команда сокращается какn.
Аргумент число является счетчиком повторений, как дляstep.
Командаnextостанавливается только на первой инструкции исходной
строки. Это предотвращает множественные остановки, которые
иначе могут возникнуть в операторахswitch, циклахfor, и
так далее. finish-
Продолжить выполнение до возврата из функции в выбранном кадре стека.
Напечатать возвращенное значение (если таковое существует).
Сравните это с командойreturn(see section Возврат из функции). untilu-
Продолжить выполнение до достижения строки исходного текста, следующей за
текущей, в текущем кадре стека. Эта команда используется для избежания
выполнения цикла по шагам больше одного раза.
Она похожа на командуnext, за исключением
того, что когдаuntilвстречает переход, она автоматически
продолжает выполнение, пока счетчик выполнения программы не станет
больше, чем адрес перехода.
Это означает, что когда вы достигаете конца цикла после его выполнения по
шагам,untilпродолжает выполнение вашей программы, пока она не
выйдет из цикла. Напротив, командаnextв конце цикла просто
переходит назад в начало цикла, что заставляет вас выполнять по
шагам следующую итерацию.
untilвсегда останавливает вашу программу, если она пытается выйти
из текущего кадра стека.
untilможет привести к несколько неожиданным результатам, если
порядок машинных кодов не совпадает с порядком строк исходного текста.
Например, в следующем отрывке сеанса отладки, командаf
(frame) показывает, что выполнение остановилось на строке
206; хотя, когда мы используемuntil, мы переходим к строке
195:(gdb) f #0 main (argc=4, argv=0xf7fffae8) at m4.c:206 206 expand_input(); (gdb) until 195 for ( ; argc > 0; NEXTARG) {Это произошло потому, что для эффектвности выполнения компилятор
сгенерировал код для проверки окончания цикла в конце, а не в начале
цикла—даже если проверка в циклеforСи написана до тела
цикла. Кажется, что командаuntilпереместилась назад к началу
цикла, когда двигалась к этому выражению; однако, в действительности она
не переходила к более раннему оператору—в терминах фактического
машинного кода.
untilбез аргументов работает посредством пошагового выполнения
отдельных инструкций, и, следовательно, является более медленной, чем
untilс аргументом. until положениеu положение-
Продолжить выполнение вашей программы, пока либо указанное место не
будет достигнуто, либо не произойдет возврат из текущего кадра стека.
положение может быть любой из доступных форм аргумента для
break(see section Установка точек останова). Эта форма команды использует точки останова, и,
следовательно, является более быстрой, чемuntilбез аргумента. stepistepi аргsi-
Выполнить одну машинную инструкцию, затем остановиться и вернуться в
отладчик.
При пошаговом выполнении машинных инструкций, часто бывает полезным
сделать `display/i $pc’. Это велит GDB автоматически
отображать инструкцию, которая будет выполняться следующей, каждый раз,
когда ваша программа останавливается. See section Автоматическое отображение.
Аргумент является счетчиком повторений, как дляstep. nextinexti аргni-
Выполнить одну машинную инструкцию, но если это вызов функции,
продолжать до возврата из нее.
Аргумент является счетчиком повторений, как дляnext.
Сигналы
Сигнал—это асинхронное событие, которое может произойти в программе.
Операционная система определяет возможные типы сигналов и дает каждому
типу имя и номер. В Unix, например, SIGINT—это сигнал, получаемый
программой, когда вы вводите знак прерывания (часто C-c);
SIGSEGV—сигнал, получаемый программой при ссылке на область
памяти, отличную от всех используемых областей; SIGALRM появляется
при срабатывании интервального таймера (возникает только, если ваша
программа запросила временной сигнал).
Некоторые сигналы, такие как SIGALRM, являются обычной частью
функционирования вашей программы. Другие, такие как SIGSEGV,
обозначают ошибки; эти сигналы являются фатальными (они немедленно
убивают вашу программу), если программа не определила заранее другой
способ их обработки. SIGINT не указывает на ошибку в вашей
программе, но обычно является фатальным, так что он может выполнять
функцию прерывания: убить программу.
GDB способен обнаружить любое появление сигнала в вашей
программе. Вы можете заранее сообщить GDB, что делать для
каждого типа сигнала.
Обычно, GDB установлен так, чтобы игнорировать неошибочные сигналы,
такие как SIGALRM (чтобы не мешать их действию при исполнении вашей
программы), но немедленно останавливать вашу программу всякий раз, когда
возникает сигнал об ошибке. Вы можете изменить эти установки командой
handle.
info signalsinfo handle-
Напечатать таблицу всех типов сигналов и описания, как GDB
будет обрабатывать каждый из них. Вы можете использовать эту команду, чтобы
посмотреть номера всех определенных типов сигналов.
info handleявляется синонимом дляinfo signals. handle сигнал ключевые-слова...-
Изменить способ, которым GDB обрабатывает сигнал.
сигнал может быть номером сигнала или его именем (с `SIG’ или
без него в начале). Ключевые-слова определяют, какие сделать изменения.
Ключевые слова, допускаемые командой handle, могут быть
сокращены. Вот их полные имена:
nostop-
GDB не должен останавливать вашу программу при получении
этого сигнала. Все же он может вывести сообщение, уведомляющее о
получении сигнала. stop-
GDB должен остановить вашу программу при получении этого
сигнала. Это также подразумевает ключевое словоprint. print- GDB должен вывести сообщение при возникновении данного сигнала.
noprint-
GDB вообще не должен замечать возникновение сигнала. Это также
подразумевает ключевое словоnostop. pass-
GDB должен позволить вашей программе увидеть этот сигнал; ваша
программа может обработать сигнал, или же она может завершиться,
если сигнал фатальный и не обработан. nopass- GDB не должен позволять вашей программе видеть этот сигнал.
Когда сигнал останавливает вашу программу, он невидим для нее,
пока вы не продолжите выполнение. Затем ваша программа видит
сигнал, если в данный момент на рассматриваемый сигнал
распространяется действие команды pass. Другими словами, после
того, как GDB сообщит о сигнале, вы можете использовать команду
handle c pass или nopass, чтобы
указать, должна ли ваша программа увидеть этот сигнал при продолжении.
Вы также можете использовать команду signal для того, чтобы
помешать вашей программе увидеть сигнал или, наоборот, заставить ее
заметить обычно игнорируемый сигнал, или чтобы подать ей произвольный
сигнал в любое время. Например, если ваша программа остановилась
вследствие какой-либо ошибки обращения к памяти, вы можете сохранить
правильные значения в ошибочные переменные и продолжить выполнение, в
надежде посмотреть на дальнейшее выполнение, но ваша программа вероятно
немедленно остановилась бы из-за фатального сигнала, как только она бы
его заметила. Чтобы помешать этому, вы можете продолжить выполнение с
`signal 0′. See section Подача сигнала вашей программе.
Остановка и запуск многонитевых программ
Когда ваша программа имеет несколько нитей выполнения
(see section Отладка программ с несколькими нитями), вы можете выбрать,
установить точки останова либо во всех, либо в каких-то отдельных нитях.
break ном-строки thread номер-нитиbreak ном-строки thread номер-нити if ...-
ном-строки определяет строки исходного текста; существует
несколько способов их задания, но результат всегда один и тот
же—указать строку исходного текста.
Используйте классификатор `thread номер-нити‘ с командой точки
останова, чтобы указать GDB, что вы хотите остановить программу,
только когда определенная нить достигнет этой точки.
номер-нити—это один из числовых идентификаторов нити,
присвоенный GDB, показываемый в первой колонке при выводе
`info threads’.
Если при установке точки останова вы не укажете `thread
номер-нити‘, точка останова будет действовать для всех
нитей вашей программы.
Вы также можете использовать классификаторthreadдля условных
точек останова; в этом случае, поместите `thread номер-нити‘
перед условием точки останова, вот так:(gdb) break frik.c:13 thread 28 if bartab > lim
При любой остановке вашей программы под управлением GDB,
прекращается выполнение всех нитей, а не только текущей. Это
позволяет вам исследовать полное состояние программы, включая
переключение между нитями, не опасаясь, что это может изменить что-либо в
дальнейшем.
Наоборот, когда вы снова запускаете программу, все нити
начинают выполняться. Это верно даже при пошаговом выполнении
такими командами, как step или next.
В частности, GDB не может пошагово выполнять все нити
параллельно. Так как планированием выполнения нити занимается
операционная система отлаживаемой цели (не контролируемая GDB),
то пока в текущей
нити выполняется один шаг, в других может выполниться несколько. Более
того, когда выполнение программы останавливается, другие потоки вообще могут
остановиться в середине операторов, а не на границе между ними.
Вы даже можете обнаружить, что после продолжения исполнения или
после пошагового выполнения ваша программа остановилась в другой
нити. Это случается всякий раз, когда другая нить достигает точки
останова, получает сигнал или в ней возникает исключительная ситуация,
прежде чем первая нить завершает выполнение того, что вы запросили.
В некоторых операционных системах вы можете заблокировать планировщик
заданий и тем самым позволить выполняться только одной нити.
set scheduler-locking режим-
Устанавливает режим блокировки планировщика заданий. Если он установлен
вoff, то блокировки нет и любая нить может выполняться в любое
время. Если этот режим установлен вon, то только текущая нить
может выполняться, когда выполнение продолжается.
Режимstepпроизводит оптимизацию для пошагового выполнения. Он
не дает другим нитям «захватывать приглашение» путем приоритетного
прерывания обслуживания текущей нити во время пошагового выполнения.
Другие нити едва ли получат возможность начать выполнение, когда вы
выполняете очередной шаг. С большей вероятностью они начнут выполняться,
когда вы выполняете командуnextна вызове функции, и им не что
не помешает выполняться, когда вы используете такие команды, как
`continue’, `until’ или `finish’. Однако, если другие
нити не достигнут точки останова в течение отведенного ему для
выполнения времени, они никогда не перехватят приглашение GDB у
отлаживаемой вами нити. show scheduler-locking- Отобразить текущий режим блокировки.
Исследование стека
Когда ваша программа остановилась, первое, что вам нужно
знать—где она остановилась и как она туда попала.
Каждый раз, когда ваша программа производит вызов функции,
о нем создается определенная информация. Она включает положение вызова
в вашей программе, параметры вызова и локальные переменные вызываемой
функции. Информация сохраняется в блоке данных, называемом
кадром стека. Кадры стека размещаются в области памяти, называемой
стеком вызовов.
Команды GDB для исследования стека позволяют вам увидеть всю эту
информацию при остановке вашей программы.
Один из кадров стека является выбранным GDB, и многие
команды GDB неявно относятся к нему. В частности, когда вы
запрашиваете у GDB значение переменной вашей программы, это
значение находится в выбранном кадре. Для выбора интересующего вас
кадра существуют специальные команды GDB. See section Выбор кадра.
Когда ваша программа останавливается, GDB автоматически
выбирает текущий выполняющийся кадр и выдает его краткое описание,
аналогично команде frame (see section Информация о кадре стека).
Кадры стека
Cтек вызовов разделен на непрерывные участки, называемые
кадрами стека, или кадрами для краткости;
каждый кадр является данными, связанными с одним вызовом одной
функции. Кадр содержит аргументы, переданные функции, ее локальные
переменные и адрес, с которого она выполняется.
Когда ваша программа стартует, стек содержит только один кадр—для
функции main. Он называется начальным или внешним
кадром. Каждый
раз при вызове функции создается новый кадр. При каждом выходе
из функции, кадр этого вызова функции уничтожается. Если функция
является рекурсивной, для нее может существовать множество кадров. Кадр
для функции, исполняемой в данный момент, называется внутренним
кадром. Это кадр, созданный самым последним из всех существующих кадров стека.
Внутри вашей программы кадры стека идентифицируются своим адресом.
Кадр стека состоит из множества байт, каждый из которых имеет
свой собственный адрес; каждый тип компьютеров имеет свой способ для
выбора одного байта, чей адрес служит адресом кадра. Обычно, пока
выполнение происходит в данном кадре, этот адрес содержится в
регистре, называемом регистром указателя кадра.
GDB присваивает номера всем существующим кадрам стека, начиная
с нуля для внутреннего кадра, единицу—вызвавшему его кадру, и так далее. В
действительности, эти номера не существуют в вашей программе; они
назначаются GDB, чтобы предоставить вам способ различать кадры
стека в командах GDB.
Некоторые компиляторы позволяют компилировать функции так, чтобы
они выполнялись без создания кадров стека. (Например, ключ gcc
`-fomit-frame-pointer'
создает функции без кадра.) Это иногда делается
с часто используемыми библиотечными функциями, чтобы сохранить время,
требуемое для установки кадра. GDB имеет ограниченные
возможности для обработки таких функциональных вызовов. Если
вызов внутренней функции происходит без создания кадра стека,
GDB, тем не менее, описывает его так, как если бы он имел
отдельный кадр, который имеет, как обычно, номер 0, позволяя корректно
трассировать цепочку функциональных вызовов. Однако, GDB не
имеет средств для работы с функциями без кадра в другом месте стека.
frame арг-
Команда
frameпозволяет вам перемещаться от одного кадра стека
к другому, и распечатывать выбранный вами кадр. Арг может быть либо
адресом кадра, либо его номером. Без аргумента,frame
выводит текущий кадр стека. select-frame-
Команда
select-frameпозволяет вам перемещаться от одного кадра
стека к другому без его распечатки. Это «тихая» версияframe.
Цепочки вызовов
Цепочка вызовов предоставляет собой информацию о том, как ваша программа
оказалась там, где она есть. Она отображает по одной строке для каждого кадра,
начиная с текущего выполняющегося кадра (кадра 0), за которым следует
кадр, из которого он был вызван (кадр 1), и далее вверх по стеку.
backtracebt-
Вывести цепочку вызовов всего стека: по одной строке на кадр,
для всех кадров в стеке.
Вы можете прервать цепочку вызовов в любое время, введя знак
системного прерывания, обычно C-c. backtrace nbt n- То же самое, но выводятся только n внутренних кадров.
backtrace -nbt -n- То же самое, но выводятся только n внешних кадров.
where и info stack (сокращенно info)—дополнительные синонимы для
sbacktrace.
Каждая строка в цепочке вызовов показывает номер кадра и имя функции.
Счетчик команд также показывается, если только вы не используете
set print address off. Цепочка вызовов также показывает имя
исходного файла, номер строки и аргументы функции. Значение счетчика
команд опускается, если он указывает на начало кода для данной строки.
Ниже приведен пример цепочки вызовов. Она была получена командой
`bt 3′, так что она показывает три внутренних кадра.
#0 m4_traceon (obs=0x24eb0, argc=1, argv=0x2b8c8)
at builtin.c:993
#1 0x6e38 in expand_macro (sym=0x2b600) at macro.c:242
#2 0x6840 in expand_token (obs=0x0, t=177664, td=0xf7fffb08)
at macro.c:71
(More stack frames follow...)
Информация о нулевом кадре не начинается со значения счетчика команд,
что указывает на то, что ваша программа остановилась в начале кода для
строки 993 файла builtin.c.
Выбор кадра
Большинство команд для исследования стека и других данных в вашей
программе применяются выбранному в данный момент кадру.
Здесь приведены команды для выбора кадра стека; все они
завершаются выводом краткого описания выбранного кадра стека.
frame nf n-
Выбрать кадр номер n. Напоминаем, что нулевой кадр—это
внутренний (исполняемый в данный момент) кадр, первый кадр—тот, из
которого вызван нулевой, и так далее. Кадр с наибольшим номером—это кадр
для функцииmain. frame адресf адрес-
Выбрать кадр, расположенный по адресу адрес. В основном это
полезно, если формирование цепочки кадров стека было нарушено из-за
ошибки, сделавшей невозможным для GDB правильное присвоение
номеров всем кадрам. Кроме того, это может быть полезным,
когда у вашей программы есть несколько стеков и происходит
переключение от одного к другому.
В архитектуре SPARC, командеframeдля выбора произвольного
кадра необходимо указать два адреса: указатель кадра и указатель вершины
стека.
В архитектурах MIPS и Alpha требуется два адреса: указатель
вершины стека и указатель команд.
В архитектуре 29k требуется три адреса: указатель вершины
стека регистров, указатель команд и указатель вершины стека памяти. up n-
Переместиться вверх по стеку на n кадров. Для положительных
значений n, это перемещение происходит по направлению к внешнему
кадру, к кадрам с большими номерами, к кадрам, которые существуют
дольше. По умолчанию n принимается равным единице. down n-
Передвинуться вниз по стеку на n кадров. Для положительных
значений n, это продвижение происходит по направлению к
внутреннему кадру, к кадру с меньшим номером, к кадрам, которые были
созданы позже. По умолчанию, значение n принимается равным
единице. Вы можете сокращатьdownкакdo.
Все эти команды заканчиваются выводом двух строк, описывающих кадр.
Первая строка показывает номер кадра, имя функции, аргументы,
имя исходного файла и номер выполняемой строки в этом кадре. Вторая
строка показывает содержимое этой строки исходного текста.
Например:
(gdb) up
#1 0x22f0 in main (argc=1, argv=0xf7fffbf4, env=0xf7fffbfc)
at env.c:10
10 read_input_file (argv[i]);
После такого вывода, команда list без аргументов выводит десять
строк, расположенных вокруг точки выполнения в кадре.
See section Вывод строк исходного текста.
up-silently ndown-silently n-
Эти две команды являются вариантами
upиdownсоответственно,
отличаясь от них тем, что делают свою работу «тихо», не отображая новый
кадр. Они предназначены для использования в основном в
командных сценариях GDB, где вывод может быть ненужным и
отвлекающим.
Информация о кадре стека
Существуют несколько других команд для вывода информации о выбранном
кадре стека.
framef-
При использовании без аргументов, эта команда не выбирает новый
кадр, а выводит краткое описание текущего выбранного кадра стека. Эту
команду можно сокращать какf. С аргументом, эта команда
используется для выбора кадра стека.
See section Выбор кадра. info frameinfo f-
Эта команда выводит подробное описание выбранного кадра стека,
включающее:- адрес кадра
- адрес следующего вниз по стеку кадра (вызываемого из данного)
- адрес следующего вверх по стеку кадра (того, из которого был вызван данный)
- язык, на котором написан исходный код, соответствующий этому кадру
- адрес аргументов кадра
- адрес локальных переменных кадра
- сохраненный в кадре счетчик команд (адрес выполнения в кадре, вызвавшем данный)
- регистры, которые были сохранены в кадре
Подробное описание полезно, если из-за какой-либо ошибки формат
стека не соответствует обычным соглашениям. info frame адресinfo f адрес-
Вывести подробное описание кадра стека, расположенного по адресу
адрес, не выбирая этот кадр. Выбранный кадр этой командой не
изменяется. Она требует параметр
адрес того же типа, что и командаframe(для некоторых архитектур
не один, а несколько).
See section Выбор кадра. info args- Вывести аргументы выбранного кадра, каждый на отдельной строке.
info locals-
Вывести локальные переменные выбранного кадра, каждую на отдельной
строке. Выводятся все переменные (объявленные как статические или как
автоматические), доступные в точке выполнения выбранного кадра стека. info catch-
Выводит список всех обработчиков исключительных ситуаций, являющихся
активными в текущей точке выполнения текущего кадра стека. Чтобы
увидеть другие обработчики исключительных ситуаций, перейдите в
соответствующую секцию (используя командыup,downили
frame); затем наберитеinfo catch.
See section Установка точек перехвата.
Исследование исходных файлов
GDB может выводить части исходных текстов вашей программы, так как
отладочная информация, записанная в ней, сообщает GDB, какие исходные
файлы использовались при создании программы. Когда ваша программа
останавливается, GDB сам выводит строку, на которой она
остановилась. Аналогично, когда вы выбираете кадр стека (see section Выбор кадра), GDB выводит строку, на которой
остановилось выполнение в этом кадре. Вы можете выводить другие части
исходных файлов с помощью явных команд.
Если вы используете GDB через интерфейс к GNU Emacs, вы можете
предпочесть воспользоваться средствами Emacs для просмотра исходных текстов;
смотрите section Использование GDB под управлением GNU Emacs.
Вывод строк исходного текста
Чтобы вывести строки файла с исходным текстом, используйте команду
list (сокращенно l). По умолчанию выводятся десять строк.
Существует несколько способов определения того, какую часть файла вы хотите
вывести.
Здесь представлены наиболее употребительные формы команды list:
list номер-строки-
Вывести строки, расположенные вокруг строки с номером номер-строки
в текущем исходном файле. list функция- Вывести строки, расположенные вокруг начала функции функция.
list-
Вывести еще определенное количество строк. Если последние выведенные
строки выводились с помощью командыlist, то выводятся
строки, следующие за последними выведенными; если, однако,
последней выведенной строкой была одиночная строка, выведенная
как часть отображения кадра стека (see section Исследование стека),
то выводятся строки, расположенные вокруг нее. list --
Вывести строки, расположенные непосредственно перед последними
выведенными.
По умолчанию, для любой из этих форм команды list GDB
выводит десять строк исходного текста. Вы можете изменить это
командой set listsize:
set listsize число-
Установить количество выводимых командой
listстрок в число
(если аргумент командыlistне задает явно какое-нибудь другое число). show listsize-
Отобразить количество строк, выводимых по команде
list.
Повторение команды list нажатием RET отбрасывает аргумент,
так что это эквивалентно вводу просто list. Это полезнее, чем
вывод тех же самых строк снова. Исключение сделано для параметра
`-‘; этот параметр сохраняется при повторе команды, так что каждое
повторение приводит к перемещению вверх по исходному файлу.
Обычно команда list ожидает от вас ноль, один или два
указателя строк. Указатели строк определяют строки
исходного текста; существует несколько способов их задания, но
результат всегда заключается в задании строки исходного текста. Вот
полное описание возможных параметров команды list:
list указ-стр- Вывести строки, расположенные вокруг строки, определяемой указ-стр.
list перв,посл-
Вывести строки с перв до посл. Оба параметра являются
указателями строк. list ,посл- Вывести строки, расположенные перед посл.
list перв,- Вывести строки, начиная с перв.
list +- Вывести строки, расположенные сразу за последними выведенными.
list -- Вывести строки, расположенные непосредственно перед последними выведенными.
list- Описано в предыдущей таблице.
Ниже перечислены способы указания одиночной строки исходного
текста—все виды указателей строк.
номер-
Определяет строку с номером номер из текущего исходного файла.
Если в качестве параметров к командеlistзадано два указателя
строк, это относится к тому же исходному файлу, что и первый указатель
строки. +смещение-
Указывает на строку, смещенную вперед на смещение строк
относительно последней выведенной строки. Когда используется в качестве
второго указателя строки для командыlist, имеющей два указателя,
задает строку, смещенную на смещение строк вниз относительно строки,
определенной первым указателем. -смещение-
Указывает на строку, расположенную на смещение строк раньше
последней выведенной строки. имя-файла:номер- Задает строку номер из исходного файла имя-файла.
функция-
Определяет строку, с которой начинается тело функции функция.
Например, в Си это строка с открывающейся фигурной скобкой. имя-файла:функция-
Определяет строку с открывающейся фигурной скобкой, с которой
начинается тело функции функция в файле имя-файла. Имя
файла необходимо лишь для того, чтобы избежать неоднозначности, когда в
различных исходных файлах есть одинаково названные функции. *адрес-
Определяет строку, соответствующую адресу адрес программы.
адрес может быть любым выражением.
Поиск в исходных файлах
Существуют две команды для поиска по регулярному выражению в текущем
исходном файле.
forward-search рег-выражsearch рег-выраж-
Команда `forward-search рег-выраж‘ проверяет на соответствие
регулярному выражению рег-выраж каждую строку, начиная со
строки, следующей за последней выведенной. Найденная строка выводится.
Вы можете использовать синоним `search рег-выраж‘ или
сокращать имя команды какfo. reverse-search рег-выраж-
Команда `reverse-search рег-выраж‘, двигаясь назад, проверяет на
соответствие регулярному выражению рег-выраж каждую строку,
начиная с предшествующей последней выведенной. Найденная
строка выводится. Вы можете сокращать эту команду какrev.
Определение каталогов с исходными файлами
Исполняемые программы иногда не сохраняют имена каталогов, в которых
находились исходные файлы, из которых они скомпилированы, а хранят лишь имена
файлов. Даже если они их сохранили, каталоги могли быть перемещены в
период между компиляцией и сеансом отладки. У GDB есть список
каталогов для поиска исходных файлов; он называется путь для
исходных файлов. Каждый раз, когда GDB требуется исходный
файл, он перебирает по порядку все каталоги из этого списка, пока не
находит файл с требуемым именем. Заметьте, что пути поиска исполняемых
файлов для этой цели не используются, как не используется и
текущий рабочий каталог, если только он не присутствует в пути для
исходных файлов.
Если GDB не может найти исходный файл, используя путь для
исходных файлов, а в объектном файле программы указан какой-либо
каталог, GDB просматривает также и его. В последнюю очередь, если
путь для исходных файлов пуст и запись о каталоге компиляции отсутствует,
GDB просматривает текущий каталог.
При переустановке или переупорядочивании пути для исходных файлов,
GDB очищает любую запомненную им информацию о том,
где исходные файлы были найдены и о расположении строк в них.
Когда вы вызываете GDB, путь для исходных файлов
содержит только `cdir’ и `cwd’, в этом порядке. Для
добавления других каталогов, используйте команду directory.
directory имя-каталога ...dir имя-каталога ...-
Добавить каталог имя-каталога в начало пути для исходных
файлов. Этой команде могут быть заданы несколько имен, разделенные
`:’ (`;’ в MS-DOS и MS-Windows, где `:’ обычно является
частью абсолютного имени файла) или пробелом. Вы можете указать
каталог, который уже содержится в пути для исходных файлов; это
переместит его в начало, так что GDB будет просматривать его
раньше.Вы можете использовать строку `$cdir’ для ссылки на каталог
компиляции (если информация о нем сохранена), и `$cwd’ для ссылки
на текущий рабочий каталог. `$cwd’ не есть то же самое, что
`.’. Первая отслеживает текущий рабочий каталог, который может
меняться во время вашего сеанса работы с GDB, тогда как
вторая сразу преобразовывается в текущий каталог в момент его
добавления в путь для исходных файлов. directory-
Очистить путь для файлов с исходными текстами. Эта команда
требует подтверждения. show directories-
Вывести путь поиска исходных файлов: показать, какие каталоги он
содержит.
Если ваш путь для исходных файлов перемешан с уже неиспользуемыми
каталогами, GDB может иногда вызвать недоумение, найдя
неправильный вариант исходного файла. Вы можете исправить ситуацию
следующим образом:
-
Использовать
directoryбез параметров, чтобы очистить путь
поиска исходных файлов. -
Использовать
directoryс подходящими аргументами, чтобы
переустановить каталоги, которые вы хотите видеть в пути для исходных
файлов. Вы можете добавить все каталоги одной командой.
Исходный текст и машинный код
Вы можете использовать команду info line, чтобы отобразить cтроки
исходного текста в программные адреса (и наоборот), и
команду disassemble, чтобы вывести диапазон адресов в виде
машинных инструкций. При запуске в режиме GNU Emacs, команда
info line выводит стрелку, указывающую на заданную строку.
Также info line выводит адреса как в символьной форме, так и в
шестнадцатеричной.
info line указ-стр-
Выводит начальный и конечный адреса скомпилированного кода,
соответствующего строке исходного текста указ-стр. Вы можете
определить строки исходного текста любым способом, воспринимаемым
командойlist(see section Вывод строк исходного текста).
Например, мы можем использовать info line для определения
положения объектного кода первой строки функции
m4_changequote:
(gdb) info line m4_changequote Line 895 of "builtin.c" starts at pc 0x634c and ends at 0x6350.
Мы также можем запросить (используя *адрес как форму
задания указ-стр), какая строка исходного текста соответствует
определенному адресу:
(gdb) info line *0x63ff Line 926 of "builtin.c" starts at pc 0x63e4 and ends at 0x6404.
После info line, адрес, используемый по умолчанию для команды
x, меняется на начальный адрес строки, так что `x/i’
достаточно для начала исследования машинного кода (see section Исследование памяти). Этот адрес также сохраняется как значение
вспомогательной переменной $_ (see section Вспомогательные переменные).
disassemble-
Эта специализированная команда служит для дампа диапазона памяти в виде
машинных инструкций. Диапазоном памяти по умолчанию является функция, в
которой находится счетчик программы в выбранном кадре. Одиночным
параметром этой команды является значение счетчика программы;
GDB выводит дамп функции, которой принадлежит указанный адрес. Два
параметра определяют диапазон адресов для дампа (первый включается, второй
исключается).
Следующий пример показывает результат дисассемблирования диапазона
адресов кода HP PA-RISC 2.0:
(gdb) disas 0x32c4 0x32e4 Dump of assembler code from 0x32c4 to 0x32e4: 0x32c4 <main+204>: addil 0,dp 0x32c8 <main+208>: ldw 0x22c(sr0,r1),r26 0x32cc <main+212>: ldil 0x3000,r31 0x32d0 <main+216>: ble 0x3f8(sr4,r31) 0x32d4 <main+220>: ldo 0(r31),rp 0x32d8 <main+224>: addil -0x800,dp 0x32dc <main+228>: ldo 0x588(r1),r26 0x32e0 <main+232>: ldil 0x3000,r31 End of assembler dump.
Некоторые архитектуры имеют несколько широко используемых наборов мнемоник
инструкций или другой синтаксис.
set disassembly-flavor набор-инструкций-
Выбрать набор инструкций для использования при дисассемблировании программы
командамиdisassembleиx/i.
В настоящее время, эта команда определена только для Intel x86. Вы
можете установить набор-инструкций вintelилиatt.
По умолчанию установленоatt, диалект AT&T используется по
умолчанию ассемблерами Unix на архитектурах, базирующихся на x86.
Исследование данных
Для исследования данных в вашей программе обычно используется
команда print (сокращенно p) или ее синоним
inspect. Она вычисляет и выводит значение выражения, записанного
на том же языке, что и ваша программа (see section Использование GDB с различными языками программирования).
print выражprint /f выраж-
выраж является выражением (на исходном языке). По умолчанию, значение
выраж выводится в формате, соответствующем его типу данных; вы можете
выбрать другой формат, указав `/f‘, где f—буква,
определяющая формат; смотрите section Форматы вывода. printprint /f-
Если вы опустите выраж, GDB отображает последнее
значение снова (из истории значений; see section История значений). Это предоставляет вам удобный способ изучить то же
самое значение в другом формате.
Команда x позволяет исследовать данные на более низком уровне. Она
исследует данные в памяти по указанному адресу и выводит их в
указанном формате. See section Исследование памяти.
Если вас интересует информация о типах или о том, как объявлены
поля структуры или класса, используйте команду ptype выраж
вместо print. See section Исследование таблицы символов.
Выражения
print и многие другие команды GDB допускают в качестве
параметра выражение и вычисляют его значение. В выражении GDB
допустимо использование любого типа констант, переменных или операторов,
определенных в используемом вами языке программирования, включая
условные выражения, вызовы функций, приведение типов и строковые
постоянные. К сожалению, исключением являются символы, определенные
командами препроцессора #define.
GDB поддерживает константы-массивы в выражениях, введенных
пользователем. Синтаксис следующий: {элемент,
элемент…}. Например, вы можете использовать команду
print {1, 2, 3}, чтобы создать в памяти массив,
который будет доступен в программе так же, как выделенный функцией
malloc.
По причине широкого распространения Си, большинство выражений в
примерах этого руководства написаны на Си. See section Использование GDB с различными языками программирования, для информации об использовании
выражений в других языках.
В этом разделе мы обсуждаем операторы, которые вы можете использовать
в выражениях GDB независимо от используемого вами языка
программирования.
Приведения типов поддерживается во всех языках, а не только в Си,
так как бывает очень полезно преобразовать число в указатель, чтобы
исследовать структуру, расположенную по этому адресу в памяти.
GDB поддерживает эти операторы, в дополнении к следующим,
являющимися общими для языков программирования:
@-
`@’ является бинарным оператором, позволяющим рассматривать
области памяти как массивы.
See section Искусственные массивы, для дополнительной информации. ::-
`::’ позволяет вам указывать переменную в терминах файла или функции,
где она определена. See section Переменные программы. {тип} адрес-
Ссылается на объект типа тип, хранящийся в памяти по адресу
адрес. Адрес может быть любым выражением, значением которого
является целое число или указатель (но вокруг бинарных операторов, также
как и вокруг оператора приведения типа, требуются скобки). Эта
конструкция допустима, независимо от того, какого типа данные
предположительно расположены по адресу.
Переменные программы
Чаще всего в качестве выражения используется имя переменной вашей
программы.
Переменные в выражениях трактуются в контексте выбранного кадра стека
(see section Выбор кадра); они могут быть либо
- глобальными (или статическими)
либо
-
видимыми из точки выполнения в данном кадре, в соответствии с правилами
определения области видимости языка программирования.
Это означает, что в функции
foo (a)
int a;
{
bar (a);
{
int b = test ();
bar (b);
}
}
вы можете исследовать и использовать переменную a всякий раз,
когда ваша программа выполняется в пределах функции foo, но вы
можете использовать или исследовать переменную b только тогда,
когда ваша программа выполняется внутри блока, в котором она объявлена.
Есть исключение: вы можете ссылаться на переменную или функцию, областью
видимости которой является единственный исходный файл, даже если точка
текущего выполнения в нем не находится. Допускается существование
нескольких переменных или функций с одинаковым именем (в различных
исходных файлах). Если это так, обращение к этому имени приводит к
непредсказуемым результатам. Если хотите, вы можете указать
статическую переменную в конкретной функции или в файле, используя
двойное двоеточие:
файл::переменная функция::переменная
Здесь файл или функция—название контекста для статической
переменной. В первом случае вы можете использовать кавычки, чтобы
GDB рассматривал имя файла как одно слово; например, чтобы вывести
глобальное значение переменной x, определенной в `f2.c':
(gdb) p 'f2.c'::x
Такое использование `::’ крайне редко конфликтует с похожим
использованием той же записи в Си++. GDB также поддерживает
использование оператора определения области видимости Си++ в выражениях.
Предупреждение: В некоторых случаях, в определенной точке функции
(сразу после входа в новую область видимости, и непосредственно перед
выходом из нее)
может показаться, что локальная переменная имеет неверное значение.
Вы можете столкнуться с этой проблемой при пошаговом выполнении по
одной машинной инструкции. Она возникает из-за того, что на большинстве
машин процедура установки кадра стека (включая определения локальных
переменных) занимает более одной инструкции; если вы
производите пошаговое выполнение по одной машинной инструкции, может
показаться, что переменная имеет неверное значение, пока кадр стека не
будет полностью построен. При выходе, для уничтожения кадра стека
обычно также требуется более одной инструкции; после начала
пошагового выполнения этой группы инструкций, определения локальных переменных
могут пропасть.
Это также может случиться, когда компилятор делает значительную
оптимизацию. Чтобы быть уверенным, что вы всегда видите точные
значения, отключите всю оптимизацию при компиляции.
Другой возможный эффект оптимизации компилятора заключается в уничтожении
неиспользуемых переменных, или в присвоении переменных регистрам (а не
адресам памяти). В зависимости от поддержки таких ситуаций,
предоставляемой форматом отладочной информации, который использует
компилятор, GDB может не вывести значения таких локальных
переменных. Если это происходит, GDB выведет сообщение,
подобное этому:
No symbol "foo" in current context.
Для решения таких проблем, либо перекомпилируйте программу без
оптимизации, или используйте другой формат отладочной информации, если
компилятор поддерживает несколько таких форматов. Например
GCC, компилятор GNU Си/Си++, обычно поддерживает ключ
`-gstabs’. `-gstabs’ создает отладочную информацию в формате,
являющимся развитием таких форматов, как COFF. У вас может быть
возможность использовать DWARF-2 (`-gdwarf-2′), который тоже
является эффективной формой представления отладочной информации.
Смотрите section `Опции для отладки вашей программы или GNU CC’ in Использование GNU CC, для дополнительной
информации.
Искусственные массивы
Часто бывает полезным вывести несколько объектов одного типа,
расположенных в памяти последовательно; часть массива или динамический
массив, для которого в программе существует только указатель.
Вы можете это сделать, обращаясь к непрерывному участку памяти как к
искусственному массиву, используя бинарный оператор `@’.
Левым операндом для `@’ должен быть первый элемент желаемого
массива, и он должен быть индивидуальным объектом. Правым операндом
должна быть длина массива. Результатом операции будет массив, все элементы
которого имеют тот же тип, что и левый аргумент. Первым элементом
массива является левый аргумент; второй элемент формируется из байтов
памяти, непосредственно следующих за байтами, содержащими первый элемент, и
так далее. Например, если в программе есть строка
int *array = (int *) malloc (len * sizeof (int));
то вы можете вывести содержимое array с помощью
p *array@len
Левый операнд операции `@’ должен находиться в памяти.
Значения массивов, полученных операцией `@’, при индескации ведут
себя точно так же, как и другие массивы, и приводятся к указателям при
использовании в выражениях. Искусственные массивы чаще всего появляются
в выражениях через историю значений (see section История значений), после вывода одного из них.
Другой способ создания искусственного массива—использование приведения
типов. Оно заново интерпретирует значение так, как если бы оно было
массивом. Значение не обязано находиться в памяти.
(gdb) p/x (short[2])0x12345678
$1 = {0x1234, 0x5678}
Если вы опускаете длину массива (как в
`(тип[])значение‘), GDB для удобства вычисляет
его размер для заполнения значениями (как
`sizeof(значение)/sizeof(тип)’:
(gdb) p/x (short[])0x12345678
$2 = {0x1234, 0x5678}
Иногда механизма искусственных массивов бывает недостаточно;
в сравнительно сложных структурах данных, интересующие нас элементы могут
не быть смежными—например, если вас интересуют значения указателей в
массиве. Одно из полезных решений этой проблемы—использование
вспомогательной переменной (see section Вспомогательные переменные) в качестве счетчика в выражении, выводящем
первое интересующее нас значение, а затем повторять это выражение
нажатием RET. Предположим, например, у вас есть массив
dtab указателей на структуры, и вас интересуют значения полей
fv в каждой структуре. Ниже приведен пример ваших возможных действий:
set $i = 0 p dtab[$i++]->fv RET RET ...
Форматы вывода
По умолчанию, GDB печатает значение в соответствии с его типом.
Это не всегда отвечает вашему желанию. Например, вы можете захотеть вывести
число в шестнадцатеричной записи, или указатель в десятичной. Или вы
можете захотеть просмотреть данные по некоторому адресу в памяти в
виде строки символов или в виде инструкций. Для этого, при выводе значения
укажите формат вывода.
Простейшим применением форматов вывода является форматирование вывода
уже вычисленного выражения. Это осуществляется путем начала параметров
команды print с косой черты и символа формата. Поддерживаются
следующие символы формата:
x-
Рассматривать биты значения как целое, и вывести целое в
шестнадцатеричном виде. d- Вывести как десятичное целое со знаком.
u- Вывести как десятичное целое без знака.
o- Вывести как восьмеричное целое.
t-
Вывести как целое в двоичном виде. Буква `t’ означает «two».
(11) a-
Вывести в виде адреса, как абсолютного в шестнадцатеричной записи, так и
в виде смещения от ближайшего предшествующего символа. Вы можете
использовать этот формат для того, чтобы определить, где (в какой
функции) расположен какой-либо неизвестный адрес:(gdb) p/a 0x54320 $3 = 0x54320 <_initialize_vx+396>
c- Рассматривать как целое и вывести в виде строковой постоянной.
f-
Рассматривать биты значения как число с плавающей точкой и вывести с
использованием обычного синтаксиса для чисел с плавающей точкой.
Например, чтобы вывести счетчик программы в шестнадцатеричном виде
(see section Регистры), введите
p/x $pc
Обратите внимание, что перед косой чертой не требуется пробела, потому
что имена команд в GDB не могут содержать косую черту.
Чтобы вывести последнее значение из истории значений в другом
формате, вы можете воспользоваться командой print лишь с указанием
формата и без выражения. Например, `p/x’ выведет последнее
значение в шестнадцатеричной форме.
Исследование памяти
Вы можете использовать команду x (от слова «examine») для
исследования памяти в одном из нескольких форматов, независимо от типов
данных вашей программы.
x/nfu адресx адресx-
Для исследования памяти используйте команду
x.
n, f и u—необязательные параметры, определяющие,
сколько памяти отобразить и в каком формате; адрес—это выражение,
задающее адрес, с которого вы хотите начать отображение памяти. Если вы
используете значения по умолчанию для nfu, то вам не нужно вводить
косую черту `/’. Некоторые команды устанавливают удобные значения
по умолчанию для адреса.
- n, счетчик повторений
-
Счетчик повторений является десятичным целым числом; по умолчанию 1.
Он определяет, сколько памяти отобразить (считая в единицах u). - f, формат отображения
-
Формат отображения—это один из форматов, используемых командой
print, `s’ (строка, оканчивающаяся нулем), или `i’
(машинная инструкция). Первоначально, значением по умолчанию
установлено `x’ (шестнадцатеричная форма). Значение по умолчанию
изменяется каждый раз, когда вы используете либоx, либо
print. - u, размер единицы измерений
-
Размер единицы измерений может быть одним из
b- Байты.
h- Полуслова (два байта).
w- Слова (четыре байта). Это первоначальное значение по умолчанию.
g- Длинные слова (восемь байт).
Каждый раз, когда вы определяете размер единицы измерений командой
x,
этот размер становится размером по умолчанию при последующем использовании
x. (Для форматов `s’ и `i’, размер единицы измерений
игнорируется и обычно не пишется.) - адрес, начальный адрес отображения
-
адрес—это адрес, с которого вы хотите, чтобы GDB
начинал отображение памяти. Значение выражения не обязано должно быть
указателем (хотя может им быть); оно всегда интерпретируется как целый
адрес байта в памяти. See section Выражения, для дополнительной
информации о выражениях. Значением по умолчанию для адреса
обычно является адрес, следующий за последним изученным адресом, но некоторые
другие команды также устанавливают это значение:info breakpoints
(в адрес последней выведенной точки останова),info line(в
начальный адрес строки) иprint(если вы используете эту
команду для отображения значения из памяти).
Например, `x/3uh 0x54320′—запрос на вывод трех полуслов
(h) памяти в формате беззнаковых десятичных целых (`u’),
начиная с адреса 0x54320. `x/4xw $sp’ выводит четыре слова
(`w’) памяти, расположенные над указателем стека (здесь `$sp’;
see section Регистры), в шестнадцатеричном виде (`x’).
Так как все буквы, обозначающие размер единиц измерения, отличаются от букв,
определяющих форматы вывода, вы не должны запоминать, формат или размер
единиц измерений указывается раньше; это можно делать в любом
порядке. Спецификации вывода `4xw’ и `4wx’ означают в
точности одно и то же. (Однако, число n должно быть первым;
`wx4′ не сработает.)
Хотя размер единицы измерения u игнорируется для форматов `s’
и `i’, тем не менее вы можете воспользоваться счетчиком повторений
n; например, `3i’ указывает, что вы хотите вывести три
машинные инструкции, включая любые операнды. Команда disassemble
предоставляет альтернативный способ исследования машинных инструкций;
смотрите section Исходный текст и машинный код.
Все значения по умолчанию для аргументов команды x разработаны
таким образом, чтобы облегчить продолжение сканирования памяти с
минимальными конкретизациями при очередном использовании x. Например,
после того, как вы просмотрели три машинные инструкции с помощью
`x/3i адрес‘, вы можете просмотреть следующие семь, используя
просто `x/7′. Если вы повторяете команду x нажатием
RET, число повторений n остается прежним; другие параметры
берутся по умолчанию, как для последовательных использований x.
Адреса и их содержимое, выводимые командой x, не сохраняются в
истории значений, так как они мешали бы.
Вместо этого,
GDB делает их доступными для последующего использования в
выражениях как значения вспомогательных переменных $_ и
$__. После команды x, последний исследованный адрес
доступен для использования в выражениях во вспомогательной переменной
$_. Содержимое этого адреса, исследованное только что, доступно во
вспомогательной переменной $__.
Если команде x задан счетчик повторений, адрес и его содержимое
сохраняются из последнего выведенного элемента памяти; это не то же
самое, что последний выведенный адрес, если в последней строке вывода
были отображены несколько элементов.
Автоматическое отображение
Если вам необходимо часто выводить значение какого-либо выражения
(чтобы увидеть, как оно меняется), вы можете добавить его в
список автоматического отображения, чтобы GDB выводил его
значение каждый раз при остановке вашей программы. Каждому выражению,
добавленному в список, присваивается идентификационный номер; чтобы
удалить выражение из списка, вы указываете этот номер. Автоматическое
отображение выглядит следующим образом:
2: foo = 38 3: bar[5] = (struct hack *) 0x3804
Это отображение показывает номера элементов, выражения и их текущие
значения. Как и при отображении, запрашиваемом вручную с помощью x
или print, вы можете указать предпочитаемый формат вывода;
фактически, display определяет, следует использовать print
или x, в зависимости от того, на сколько жесткая ваша
спецификация формата: используется x, если вы указываете размер
элемента или один из двух форматов (`i’ и s), которые
поддерживаются только x; в остальных случаях используется print.
display выраж-
Добавляет выражение выраж к списку выражений, отображаемых каждый
раз, когда ваша программа останавливается. See section Выражения.
displayне повторяется, если вы повторно нажимаете
RET после ее использования. display/формат выраж-
Если формат определяет только формат вывода, а не размер или
счетчик повторений, выражение выраж добавляется в список
автоматического отображения, но его отображение осуществляется в
указанном формате формат. See section Форматы вывода. display/формат адрес-
Если форматом является `i’ или `s’, или он включает в себя размер
элементов или их число, выражение адрес добавляется как адрес
памяти для исследования при каждой остановке вашей программы. Под
исследованием в данном случае подразумевается выполнение
`x/формат адрес‘. See section Исследование памяти.
Например, команда `display/i $pc’ может быть полезна, чтобы при каждой
остановке видеть машинную инструкцию, которая будет
выполняться следующей (`$pc’—это общее обозначение счетчика
программы; see section Регистры).
undisplay номера...delete display номера...-
Удалить элементы с номерами номера из списка выражений, подлежащих
отображению.
undisplayне повторяется при последующем нажатии RET.
(Иначе вы сразу получили бы сообщение об ошибке `No display number
…’.) disable display номера...-
Отключить отображение элементов с номерами номера. Отключенные
элементы не выводятся автоматически, но и не забываются.
Впоследствии их можно снова включить. enable display номера...-
Включить отображение элементов с номерами номера. Выражения,
соответствующие этим номерам, снова будут выводиться автоматически, пока
вы укажете обратное. display-
Отобразить текущие значения выражений из списка, точно так же,
как это происходит при остановке вашей программы. info display-
Вывести список выражений, ранее установленных для автоматического
отображения, каждое с его номером элемента, но не показывая значений. Список
включает отключенные выражения, с соответствующей пометкой. Он также
включает в себя выражения, которые не могут быть показаны прямо сейчас,
потому что обращаются к автоматическим переменным, недоступным
в данный момент.
Если отображаемое выражение обращается к локальным переменным, оно
не имеет смысла вне того лексического контекста, для которого оно
устанавливалось. Такое выражения отключается, как только выполнение
входит в контекст, где одна из его переменных становится неопределенной.
Например, если вы дадите команду display last_char, находясь
внутри функции с аргументом last_char, GDB будет
отображать этот аргумент, пока программа останавливается внутри этой
функции. Как только она остановится где-то еще—где нет переменной
last_char—отображение будет отключено автоматически. Вы
можете снова включить его при следующей остановке программы там, где
last_char будет вновь иметь смысл.
Параметры вывода
GDB предоставляет следующие способы управления выводом массивов,
структур и символов.
Данные параметры полезны при отладке программ на любом языке:
set print addressset print address on-
GDB выводит адреса памяти, показывающие положение стека,
структур, указателей, точек останова, и так далее, даже
когда он отображает также содержимое этих адресов. Значение по умолчанию
установлено вon. Например, вот как выглядит отображение кадра
стека с установленнымset print address on:(gdb) f #0 set_quotes (lq=0x34c78 "<<", rq=0x34c88 ">>") at input.c:530 530 if (lquote != def_lquote) set print address off-
Не выводить адреса при отображении их содержимого. Вот, например,
тот же кадр стека, отображенный с установкойset print address:
off(gdb) set print addr off (gdb) f #0 set_quotes (lq="<<", rq=">>") at input.c:530 530 if (lquote != def_lquote)
Вы можете использовать `set print address off’, чтобы удалить
все машинно-зависимые отображения из интерфейса GDB. Например, с
print address off, вы должны получить одинаковый текст для
цепочек вызовов на всех машинах, независимо от того, включают они
указатели в качестве аргументов или нет. show print address- Показать, должны выводиться адреса или нет.
При выводе адреса в символьной форме, GDB обычно выводит ближайший
предшествующий символ плюс смещение. Если этот символ не определяет
адрес однозначно (например, это имя, областью действия которого является
один исходный файл), вам может потребоваться дать пояснения. Один из
способов это сделать—с помощью info line; например,
`info line *0x4537′. Альтернативный способ заключается в том, чтобы
GDB выводил имя исходного файла и номер строки при выводе
символьного адреса:
set print symbol-filename on-
Велит GDB выводить имя исходного файла и номер строки
символа в символьной форме адреса. set print symbol-filename off-
Не выводить имя исходного файла и номер строки символа. Принимается по
умолчанию. show print symbol-filename-
Показать, будет GDB выводить имя исходного файла и номер строки
в символьной форме адреса или нет.
Другая ситуация, в которой полезно показывать имена файлов
и номера строк, возникает при дисассемблировании кода; GDB
показывает вам номер строки и исходный файл, которые соответствуют
каждой инструкции.
Вы также можете захотеть видеть символьную форму только в том
случае, если выводимый адрес достаточно близок к ближайшему
предшествующему символу:
set print max-symbolic-offset макс-смещение-
Велит GDB выводить символьные формы только тех
адресов, для которых смещение между ближайшим предшествующим символом и
адресом меньше, чем макс-смещение. По умолчанию значение
макс-смещение равно 0; в этом случае GDB всегда выводит
адрес в символьной форме, если ему предшествует хоть какой-нибудь символ. show print max-symbolic-offset-
Запрашивает информацию о максимальном смещении, для которого GDB
выводит символьную форму адреса.
Если у вас есть указатель, и вы не знаете, на что он указывает,
попробуйте `set print symbol-filename on’. Затем вы можете определить
название и исходный файл переменной, на которую он указывает, используя
`p/a указатель‘. Это интерпретирует адрес в символьной
форме. Например, здесь GDB показывает, что переменная
ptt указывает на другую переменную t, определенную в файле
`hi2.c':
(gdb) set print symbol-filename on (gdb) p/a ptt $4 = 0xe008 <t in hi2.c>
Предупреждение: Для указателей, указывающих на локальные
переменные, `p/a’ не показывает символьное имя и имя файла,
которому принадлежит объект ссылки, даже если установлен соответствующий
параметрset print.
Другие установки управляют выводом объектов различных типов:
set print arrayset print array on-
Структурный вывод массивов. Этот формат удобенее для чтения, но
занимает больше места. По умолчанию отключено. set print array off- Вернуться к сжатому формату вывода массивов.
show print array-
Показать, какой формат (сжатый или структурный) выбран для отображения
массивов. set print elements число-элементов-
Установить ограничение на количество выводимых GDB элементов
массива. Если GDB выводит большой массив, вывод прерывается
после того, как будет выведено установленное командойset printчисло элементов. Это ограничение также действует при
elements
отображении строк. Когда GDB стартует, этот предел принимается
равным 200. Установка число-элементов в ноль означает, что вывод
не ограничен. show print elements-
Показать количество элементов большого массива, которые будут выведены
GDB. Если это число равно 0, вывод не ограничивается. set print null-stop-
Указывает GDB прекращать вывод символов массива, как только
встретится первый NULL. Это полезно, когда большие массивы
фактически содержат только короткие строки.
По умолчанию отключено. set print pretty on-
Велит GDB выводить структуры в формате с отступами, по одному
элементу в строке, например:$1 = { next = 0x0, flags = { sweet = 1, sour = 1 }, meat = 0x54 "Pork" } set print pretty off-
Указывает GDB выводить структуры в компактном формате, как здесь:
$1 = {next = 0x0, flags = {sweet = 1, sour = 1}, meat = 0x54 "Pork"}Этот формат устанавливается по умолчанию.
show print pretty- Показать, какой формат GDB использует для вывода структур.
set print sevenbit-strings on-
Осуществлять вывод, используя только семибитные символы; если этот
параметр установлен, GDB отображает любые восьмибитные символы (в
строках или символьных значениях), используя записьnnn.
Эта установка очень удобна, если вы работаете на английском (ASCII)
и используете старший бит символов как маркер или «мета»-бит. set print sevenbit-strings off-
Выводить восьмибитные символы полностью. Это позволяет
использовать большее количество международных наборов символов, и
устанавливается по умолчанию. show print sevenbit-strings- Показать, выводит GDB только семибитные литеры или нет.
set print union on-
Велит GDB выводить объединения, содержащиеся в структурах.
Устанавливается по умолчанию. set print union off- Указывает GDB не выводить объединения, содержащиеся в структурах.
show print union-
Запросить GDB, будет ли он выводить объединения, содержащиеся
в структурах.
Например, пусть даны описанияtypedef enum {Tree, Bug} Species; typedef enum {Big_tree, Acorn, Seedling} Tree_forms; typedef enum {Caterpillar, Cocoon, Butterfly} Bug_forms; struct thing { Species it; union { Tree_forms tree; Bug_forms bug; } form; }; struct thing foo = {Tree, {Acorn}};с установленным
set print union on, команда `p foo’ выведет$1 = {it = Tree, form = {tree = Acorn, bug = Cocoon}}а с установленным
set print union off, эта же команда выведет$1 = {it = Tree, form = {...}}
Следующие установки представляют интерес при отладке программ на Си++:
set print demangleset print demangle on-
Печатать идентификаторы Си++ в их изначальной, а не в закодированной
(«искаженной») форме, передаваемой ассемблеру и компоновщику для
сборки с контролем типа. Установлено по умолчанию. show print demangle-
Показать, в искаженной или восстановленной форме выводятся
идентификаторы Си++. set print asm-demangleset print asm-demangle on-
Выводить идентификаторы Си++ в их исходной форме, а не в
искаженной, даже при выводе ассемблерного кода, например при
дисассемблировании инструкций. По умолчанию отключено. show print asm-demangle-
Показать, в закодированной или восстановленной форме выводятся
имена Си++ при выводе кода ассемблера. set demangle-style стиль-
Выбрать одну из нескольких схем кодирования, используемых
различными компиляторами для представления имен Си++. Параметр
стиль может быть следующим:auto-
Позволить GDB выбрать стиль декодирования посредством
изучения вашей программы. gnu-
Декодирование основывается на алгоритме кодирования компилятора
GNU Си++ (g++). Устанавливается по умолчанию. hp-
Декодирование основывается на алгоритме кодирования HP ANSI Си++ (
aCC). lucid-
Декодирование основывается на алгоритме кодирования компилятора
Lucid Си++ (lcc). arm-
Декодировать, используя алгоритм из C++ Annotated Reference
Manual.
Предупреждение: одной этой установки недостаточно, чтобы производить
отладку исполняемых программ, сгенерированныхcfront.
Чтобы реализовать это, GDB требует дальнейших усовершенствований.
Если вы опустите стиль, то увидите список возможных форматов.
show demangle-style-
Отобразить текущий стиль кодирования, используемый для
декодирования символов Си++. set print objectset print object on-
При отображении указателя на объект, идентифицировать фактический
(производный), а не объявленный тип объекта, используя
таблицу виртуальных функций. set print object off-
Отображать только объявленный тип объекта, не ссылаясь на таблицу
виртуальных функций. Устанавливается по умолчанию. show print object- Показать, какой из типов объекта выводится.
set print static-membersset print static-members on-
Выводить статические члены при отображении объекта Си++. Установлено по
умолчанию. set print static-members off- Не выводить статические члены при отображении объекта Си++.
show print static-members- Показать, выводятся статические члены Си++ или нет.
set print vtblset print vtbl on-
Осуществлять структурный вывод таблиц виртуальных функций Си++. По умолчанию
отключено. (Командыvtblне работают для программ,
скомпилированных компилятором HP ANSI Си++ (aCC).) set print vtbl off- Не производить структурного вывода таблиц виртуальных функций Си++.
show print vtbl-
Показать, производится структурный вывод таблиц виртуальных
функций Си++ или нет.
История значений
Значения, выведенные командой print, сохраняются в истории
значений GDB. Это позволяет вам обращаться к ним в других
выражениях. Значения сохраняются, пока таблица символов не будет заново
считана или уничтожена (например, командами file или
symbol-file). При изменении таблицы символов, история значений
уничтожается, так как значения могут содержать указатели на типы,
определенные в таблице символов.
Выведенным значениям присваиваются номера в истории, по которым вы
можете на них ссылаться. Эти номера являются последовательными целыми
числами, начинающимися с единицы. Команда print
показывает номер в истории, присвоенный значению, выводя перед ним
`$номер = ‘, где номер—это номер в истории.
Для обращения к какому-либо предшествующему значению, используйте
`$’, за которым следует номер в истории. Способ, которым
print маркирует вывод продуман так, чтобы напоминать вам об
этом. Просто $ ссылается на самое последнее значение в истории,
а $$—на предпоследнее. $$n ссылается на n-е
с конца значение; $$2—значение, находящееся перед $$,
$$1 эквивалентно $$, а $$0 эквивалентно $.
Предположим, например, вы только что вывели указатель на структуру и
хотите посмотреть ее содержимое. Для этого достаточно ввести
p *$
Если у вас есть цепочка структур, где компонента next указывает на
следующую, вы можете вывести содержимое следующей структуры так:
p *$.next
Вы можете выводить последовательные звенья в цепочке повторяя эту
команду. Это можно сделать простым нажатием RET.
Обратите внимание, что в историю записываются значения, а не
выражения. Если значение x равно 4, и вы наберете:
print x set x=5
то значение, записанное в историю значений командой print, будет
по-прежнему равно 4, хотя значение x изменилось.
show values-
Вывести из истории последние десять значений, с их номерами. Это похоже
на команду `p $$9′, повторенную десять раз, за исключением того,
чтоshow valuesне изменяет историю. show values n-
Вывести десять значений из истории, расположенных вокруг элемента
с номером n. show values +-
Вывести десять значений из истории, следующих сразу после
последнего выведенного значения. Если доступных значений больше
нет,show values +не выводит ничего.
Нажатие RET для повтора show values n действует точно
так же, как `show values +’.
Вспомогательные переменные
GDB предоставляет вспомогательные переменные, которые вы
можете в нем использовать, чтобы сохранить значение и обратиться к
нему позже. Эти переменные существуют только в GDB; они не
являются частью вашей программы и установка вспомогательной переменной
не оказывает непосредственного влияния на ее дальшейшее выполнение.
Поэтому вы можете пользоваться ими совершенно свободно.
Имена вспомогательных переменных начинаются с `$’. Любое имя с приставкой
`$’ может использоваться для вспомогательной переменной, если
только оно не является предопределенным машинно-зависимым именем регистра,
(see section Регистры). (Ссылки на историю значений,
напротив, есть числа, которым предшествует `$’.
See section История значений.)
Вы можете сохранить значение во вспомогательной переменной с помощью
выражения присваивания, как если бы вы устанавливали переменную в
вашей программе. Например:
set $foo = *object_ptr
сохранит в $foo значение объекта, на который указывает
object_ptr.
Первое использование вспомогательной переменной создает ее, но
значением переменной будет void, пока вы не присвоите ей новое.
С помощью другого присваивания вы можете в любое время
изменить значение.
Вспомогательные переменные не имеют фиксированного типа. Вы можете
присваивать вспомогательной переменной значение любого типа, включая
структуры и массивы, даже если у этой переменной уже было значение
другого типа. Будучи использованной в выражении, вспомогательная
переменная имеет тип своего текущего значения.
show convenience-
Вывести список используемых вспомогательных переменных с их значениями.
Сокращается какshow conv.
Один из способов использования вспомогательных переменных—в качестве
увеличивающегося счетчика или продвигающегося указателя. Например,
чтобы напечатать поле из последовательных элементов массива структур:
set $i = 0 print bar[$i++]->contents
Повторяйте эту команду нажатием RET.
Некоторые вспомогательные переменные создаются GDB автоматически,
и им присваиваются значения, которые вероятно могут оказаться полезными.
$_-
Переменная
$_устанавливается автоматически командойxв
последний исследованный адрес (see section Исследование памяти).
Другие команды, которые устанавливают адрес по умолчанию для
исследования командойx, также присваивают$_упомянутый
адрес; эти команды включаютinfo lineиinfo breakpoint.
Переменная$_имеет типvoid *, если только она не
установлена командойx; в этом случае она является указателем на
тип переменной$__. $__-
Переменная
$__устанавливается автоматически командойxв
значение, находящееся по последнему исследованному адресу. Ее тип
выбирается соответствующим формату, в котором это значение было
выведено. $_exitcode-
Переменной
$_exitcodeавтоматически присваивается код завершения,
когда отлаживаемая программа завершается.
В системах HP-UX, если вы ссылаетесь на функцию или переменную, чье имя
начинается со знака доллара, GDB сначала производит поиск
пользовательского или системного имени, перед поиском вспомогательной
переменной.
Регистры
В выражениях, вы можете обращаться к содержимому машинных регистров,
обозначая их как переменные с именами, начинающимся с `$’. Имена
регистров различаются от машины к машине; для вывода имен регистров,
используемых на вашей машине, воспользуйтесь командой info registers.
info registers-
Вывести имена и содержимое всех регистров, кроме
регистров с плавающей точкой (в выбранном кадре стека). info all-registers-
Вывести имена и содержимое всех регистров, включая регистры с плавающей
точкой. info registers имя-рег ...-
Выводит относительное значение каждого из указанных в имя-рег
регистров. Как подробно обсуждается ниже, значения
регистров обычно относятся к выбранному кадру стека. Имя-рег
может быть любым допустимым на вашей машине именем регистра, с `$’
в начале имени или без.
GDB распознает четыре «стандартных» имени регистров, которые
доступны (в выражениях) на большинстве машин—если только они не
конфликтуют с каноническим для архитектуры обозначением регистров.
Названия регистров $pc и $sp используются для регистра
счетчика программы и указателя вершины стека. $fp используется
как имя регистра, содержащего указатель на текущий кадр стека, а
$ps—как имя регистра, содержащего состояние процессора.
Например, вы можете вывести счетчик программы в шестнадцатеричной записи
с помощью
p/x $pc
или вывести следующую исполняемую инструкцию, используя
x/i $pc
или увеличить указатель вершины стека на четыре(12) с помощью
set $sp += 4
Когда возможно, эти четыре стандартных имени регистров доступны на вашей
машине, даже если она имеет другую каноническую мнемонику,
если не возникает конфликта. Команда info registers
показывает канонические имена. В SPARC, например, info registers
отображает регистр состояния процессора как $psr, но вы также можете
называть его $ps; а на машинах, базирующихся на платформе x86,
$ps является синонимом для регистра EFLAGS.
Когда регистр изучается таким образом, GDB всегда рассматривает
содержимое обычного регистра как целое. Некоторые машины имеют
специальные регистры, которые могут содержать только значение с
плавающей точкой; их значения трактуются как величины с плавающей
точкой. Не существует способа сослаться на содержимое обычного
регистра как на величину с плавающей точкой (хотя вы можете распечатать
его значение командой print как величину с плавающей точкой,
используя `print/f $имя-рег‘).
Некоторые регистры имеют различные «необработанные» и «виртуальные»
форматы данных. Это означает, что формат данных, в котором
операционная система сохраняет содержимое регистра, не совпадает с
тем, который обычно воспринимается вашей программой. Например, регистры
сопроцессора с плавающей точкой 68881 всегда сохраняются в
«расширенном» (необработанном) формате, но все программы на Си работают с
«двойным» (виртуальным) форматом. В подобных случаях, GDB обычно
работает только с виртуальным форматом (форматом, имеющим смысл в вашей
программе), но команда info registers выводит данные в обоих
форматах.
Обычно значения регистров относятся к выбранному кадру стека
(see section Выбор кадра). Это значит, что вы получаете
значение, которое содержалось бы в регистре, если бы произошел выход
из всех внутренних кадров стека и их сохраненные регистры были бы
восстановлены. Для того чтобы увидеть истинное содержимое аппаратных
регистров, вы должны выбрать самый внутренний кадр (с помощью
`frame 0′).
Однако, GDB, исходя из машинного кода, сгенерированного вашим
компилятором, должен установить, где сохранены регистры. Если
некоторые регистры не сохранены, или если GDB не в состоянии найти
сохраненные регистры, выбранный кадр стека не имеет значения.
Аппаратные средства поддержки вычислений с плавающей точкой
В зависимости от конфигурации, GDB может выдать вам больше информации
о состоянии аппаратных средств поддержки вычислений с плавающей
точкой.
info float-
Отобразить аппаратно-зависимую информацию о модуле поддержки
вычислений с плавающей точкой. Ее точное содержание и размещение
зависит от микросхемы поддержки вычислений с плавающей точкой. В
настоящее время, `info float’ поддерживается на машинах ARM и x86.
Использование GDB с различными языками программирования
Хотя языки программирования обычно имеют общие аспекты, их выражения редко
выглядят одинаково. Например, в ANSI Си, разыменование указателя
p осуществляется операцией *p, а в Модуле-2 это
выполняется как p^. Представление (и отображение) значений также
может быть различным. Шестнадцатеричные числа в Си отображаются как
`0x1ae’, в то время как в Модуле-2 они отображаются как `1AEH’.
В GDB встроена специальная информация о некоторых языках, которая
позволяет описывать действия, подобные упомянутым, на языке
вашей программы, и позволяет GDB выводить значения в виде,
принятом в языке, на котором написана ваша программа. Язык, которым вы
пользуетесь для построения выражений, называется рабочим языком.
Переход от одного языка к другому
Существует два способа управления рабочим языком: либо GDB
устанавливает его автоматически, либо вы можете сделать это
самостоятельно. Для этих целей вы можете воспользоваться командой set. По умолчанию, при старте GDB устанавливает язык
language
автоматически. Рабочий язык используется чтобы определить, как
интерпретируются вводимые вами выражения, как выводятся значения, и так
далее.
В дополнение к рабочему языку, каждый исходный файл, с
которым работает GDB, имеет свой собственный рабочий язык. Для
некоторых форматов объектных файлов компилятор может указывать, на
каком языке написан конкретный исходный файл. Однако, чаще всего
GDB распознает язык по имени файла. Язык исходного файла
определяет, будут ли восстанавливаться имена Си++; таким образом,
backtrace может показывать каждый кадр в соответствии с
исходным языком. Не существует способа установить язык исходного файла
из GDB, но вы можете установить язык, ассоциированный с
расширением файла. See section Отображение языка программирования.
Наиболее часто эта проблема возникает, когда вы используете программу,
такую как cfront или f2c, которая создает текст на Си, но
написана на другом языке. В этом случае нужно сделать, чтобы программа
использовала директивы #line в выводе текста Си; тогда
GDB будет знать правильный язык исходного текста первоначальной
программы, и выведет этот исходный код, а не сгенерированный код Си.
Соответствие расширений файлов и языков
Если имя исходного файла заканчивается одним из следующих расширений, то
GDB воспринимает это как указание на обозначенный язык.
`.c'- Исходный файл Си
`.C'`.cc'`.cp'`.cpp'`.cxx'`.c++'- Исходный файл Си++
`.f'`.F'- Исходный файл Фортрана
`.ch'`.c186'`.c286'- Исходный файл CHILL
`.mod'- Исходный файл Модулы-2
`.s'`.S'-
Исходный файл Ассемблера. В действительности, восприниматся почти
также, как Си, но GDB не пропускает вводные части функций при
пошаговом выполнении.
В дополнение к этому, вы можете установить язык, ассоциированный с
расширением имени файла. See section Отображение языка программирования.
Установка рабочего языка
Если вы позволяете GDB устанавливать язык автоматически,
выражения в сеансе отладки и в вашей программе интерпретируются одинаково.
По желанию, вы можете установить язык сами. Для этого
воспользуйтесь командой `set language язык‘, где
язык—название языка, например, c или modula-2.
Чтобы получить перечень поддерживаемых языков, наберите `set language’.
Установка языка вручную запрещает GDB автоматически переключать
рабочий язык. Это может привести к неприятным последствиям, если вы
попытаетесь отладить программу, когда рабочий язык не
совпадает с исходным языком, когда выражение допустимо в обоих
языках, но означает разные вещи. Например, если текущий исходный
файл написан на Си, а в GDB выбрана Модула-2, команда
print a = b + c
может не привести к ожидаемому результату. В Си это означает
сложить b и c и поместить результат в a.
Выведенным результатом будет значение a. В Модуле-2 это
означает сравнение a с результатом b+c, выдающее значение
типа BOOLEAN.
Распознавание GDB исходного языка
Для автоматической установки GDB рабочего языка, используйте
`set language local’ или `set language auto’. Тогда
GDB будет определять рабочий язык автоматически. То есть при
остановке вашей программы в кадре стека (обычно, в точке останова),
GDB устанавливает рабочий язык в тот, который записан для
функции в этом кадре. Если язык для кадра неизвестен (то есть, если
функция или блок, соответствующие кадру, были определены в исходном
файле, не имевшем распознаваемого расширения), текущий рабочий язык не
изменяется, а GDB выдает предупреждающее сообщение.
Для большинства программ, которые написаны целиком на одном языке,
автоматическая установка языка может показаться ненужной.
Однако, в основной программе, написанной на одном исходном языке,
могут использоваться программные модули и библиотеки, написанные на
другом исходном языке. Использование в этом случае `set language
auto’ освобождает вас от установки рабочего языка вручную.
Отображение языка программирования
Следующие команды помогают вам определить, какой язык
является рабочим, а также на каком языке были написаны исходные файлы.
show language-
Отобразить текущий рабочий язык. Это тот язык, который вы можете
использовать в командах типаprintдля построения и вычисления
выражений, в которые могут входить переменные вашей программы. info frame-
Отобразить исходный язык для данного кадра стека. Этот язык
становится рабочим, если используется идентификатор из этого кадра.
See section Информация о кадре стека, для дополнительной
информации. info source-
Отобразить исходный язык данного исходного файла.
See section Исследование таблицы символов, для получения
дополнительной информации.
При необычных обстоятельствах, у вас могут быть исходные файлы с
расширениями, не входящими в стандартный список. Вы можете явно
установить расширение, ассоциированное с языком:
set extension-language .расш язык-
Установить соответствие исходных файлов с расширением .расш с
исходным языком язык. info extensions- Перечислить все расширения имен файлов и соответствующие им языки.
Проверка диапазона и принадлежности типу
Предупреждение: В этот выпуск включены команды GDB для
проверки диапазона и соответствия типов, но они пока не оказывают
никакого действия. Этот раздел описывает их предполагаемые возможности.
Некоторые языки обеспечивают защиту от достаточно общих ошибок
с помощью набора проверок времени компиляции и времени выполнения. Это
включает проверку типов аргументов функций и операторов и обеспечивает
проверку математического переполнения во время выполнения. Проверки
такого рода помогают убедиться в корректности программы после ее
компиляции путем устранения несоответствия типов, и предоставляя
активную проверку ошибок выхода за пределы диапазона во время
выполнения.
По вашему желанию, GDB может проводить подобные проверки. Хотя
GDB не проверяет операторы вашей программы, он может, например, проверять
выражения, введенные непосредственно в GDB для вычисления
командой print. Как и в случае рабочего языка,
GDB может также автоматически решить, выполнять проверку или нет,
основываясь на исходном языке вашей программы. See section Поддерживаемые языки, для информации об установках по умолчанию для
поддерживаемых языков.
Краткий обзор проверки соответствия типов
Некоторые языки, такие как Модула-2, должны иметь жесткое соответствие
типов, то есть аргументы операторов и функций должны иметь правильный тип, в
противном случае возникает ошибка. Описанные здесь проверки
предотвращают ошибки несоответствия типов, которые могут вызвать
ошибки времени выполнения. Например,
1 + 2 => 3 но error--> 1 + 2.3
Во втором примере ошибка, потому что CARDINAL 1 не совместим по
типу с REAL 2.3.
Для выражений, используемых вами в командах GDB, вы можете
указать GDB не производить проверку; или же рассматривать любое
несоответствие как ошибку и прекращать обработку выражения; или только
выводить предупреждение в случае возникновения несоответствия, но
вычислять выражение в любом случае. В последнем случае, GDB
вычисляет выражения, подобные второму примеру, но также выводит
предупреждающее сообщение.
Даже если вы отключили проверку типов, GDB может прекратить
обработку выражения по другим причинам, связанным с типами. Например,
GDB не знает, как сложить int и struct foo. Такие
типы ошибок не имеют ничего общего с используемым языком и
обычно возникают из выражений, подобных описанному выше, которые нет смысла
вычислять.
Каждый язык определяет степень строгости контроля типов. Например, как
Модула-2, так и Си требуют, чтобы аргументы арифметических операций были
числами. В Си, перечисляемые типы и указатели могут быть представлены в
виде чисел, так что они допустимы в качестве аргументов математических
операторов. See section Поддерживаемые языки, для более
подробного обсуждения конкретных языков.
GDB предоставляет некоторые дополнительные команды для контроля
проверки типов:
set check type auto-
Включить или отключить контроль типов, в зависимости от
текущего рабочего языка. See section Поддерживаемые языки, для
установок по умолчанию для каждого языка. set check type onset check type off-
Включить или отключить контроль типов, пренебрегая установкой
по умолчанию для текущего рабочего языка. Вывести предупреждающее
сообщение, если установка не соответствует используемой по умолчанию.
Если возникает несоответствие типов во время вычисления
выражения при включенном контроле типов, GDB выводит
сообщение и прерывает вычисление выражения. set check type warn-
При возникновении несоответствия типов вывести предупреждающее
сообщение, но попытаться вычислить выражение. Вычисление выражения все
же может быть невозможным по другим причинам. Например, GDB не
может складывать числа со структурами. show type-
Показать текущую установку проверки типов, а также была ли она установлена
GDB автоматически.
Краткий обзор проверки диапазона
В некоторых языках (например, в Модуле-2), выход за границы диапазона типа
считается ошибкой; эти ошибки отслеживаются с помощью контроля времени
выполнения. Эти проверки диапазона служат для того, чтобы избежать
переполнения при вычислениях и не допустить превышения индексами
элементов массива границ индексации.
В выражениях, используемых вами в командах GDB, вы можете указать
GDB обрабатывать ошибки диапазона одним из трех способов:
игнорировать их, всегда рассматривать как ошибки и прерывать
обработку выражения, или выводить предупреждение и продолжать вычисление
выражения.
Ошибки диапазона могут возникать при числовом переполнении, при
превышении границы индексации массива или при использовании константы, не
принадлежащей ни к одному типу. Однако, некоторые языки не
считают переполнение ошибкой. Во многих реализациях Си,
математическое переполнение вызывает «циклический переход» к меньшему
значению. Например, если m—наибольшее целое значение, а
s—наименьшее, то
m + 1 => s
Это также является специфичным для конкретных языков, а в некоторых
случаях—для отдельного компилятора или машины.
Для дальнейших сведений по отдельным языкам, See section Поддерживаемые языки.
GDB обеспечивает некоторые дополнительные команды для контроля
проверки диапазона:
set check range auto-
Включить или отключить контроль диапазона, в зависимости от
текущего рабочего языка. See section Поддерживаемые языки,
для получения информации об установках по умолчанию для каждого языка. set check range onset check range off-
Включить или отключить контроль типов, пренебрегая установкой
по умолчанию для текущего рабочего языка.
Если установка не соответствует используемой по умолчанию, выводится
предупреждающее сообщение. Если происходит ошибка диапазона и контроль
включен, выводится сообщение и вычисление выражения прерывается. set check range warn-
При выявлении ошибки диапазона, GDB выведет предупреждающее
сообщение, но попытается вычислить выражение. Тем не менее,
вычисление выражения может быть невозможным по другим причинам,
таким как обращение к памяти, которой процесс не владеет (типичный
пример для многих систем Unix). show range-
Показать текущую установку проверки диапазона и была ли она установлена
GDB автоматически.
Поддерживаемые языки
GDB поддерживает Си, Си++, Фортран, Java, Chill, ассемблер и
Модула-2. Некоторые возможности GDB могут быть задействованы в
выражениях независимо от используемого языка: операторы GDB
@ и :: и конструкция `{тип}адрес’
(see section Выражения) могут быть использованы в конструкциях
любого поддерживаемого языка.
Следующие разделы подробно описывают, до какой степени каждый из
исходных языков поддерживается GDB. Эти разделы не задумывались как
учебники или руководства по языкам; они лишь служат справочным
руководством по тому, что допускает анализатор выражений
GDB, и как должны выглядеть входные и выходные форматы в
различных языках. Существует много хороших книг по каждому из этих
языков; пожалуйста, загляните в них, если вам нужен учебник или
справочник по языку.
Си и Си++
Поскольку Си и Си++ тесно связаны, многие возможности GDB
применимы к ним обоим. Когда это имеет место, мы обсуждаем эти языки
вместе.
Средства отладки Си++ обеспечиваются совместно компилятором Си++
и GDB. Следовательно, для эффективной отладки программы на
Си++, вам следует пользоваться одним из поддерживаемых компиляторов,
например GNU g++, или компилятором HP ANSI Си++
(aCC).
При использовании GNU Си++, для получения наилучших результатов
используйте формат отладочной информации stabs. Вы можете выбрать его
явно с помощью ключа командной строки `-gstabs’ или `-gstabs+’. Смотрите
section `Ключи для отладки вашей программы или GNU CC’ in Использование GNU CC, для дополнительной информации.
Операторы Си и Си++
Операторы должны быть определены на значениях определенных типов.
Например, + определен на числах, но не на структурах.
Операторы часто определяются на группах типов.
Для целей Си и Си++, имеют место следующие определения:
-
Целые типы включают
intс любыми спецификаторами
класса памяти;char;enum; и, для Си++,bool. -
Типы с плавающей точкой включают
float,doubleи
long double(если поддерживается целевой платформой). -
Типы указателей включают все типы, определенные как
(тип *). - Скалярные типы включают все вышеперечисленные типы.
Поддерживаются следующие операторы, перечисленные здесь в порядке
возрастания приоритета:
,-
Запятая, или оператор последовательного выполнения. Выражения,
разделенные в списке запятыми, вычисляются слева направо;
результатом всего выражения является результат, полученный последним. =-
Присваивание. Значение выражения приваивания—присвоенное значение.
Определено на скалярных типах. опер=-
Используется в выражениях в форме
a опер= b
и преобразовывается вa = a опер b.
опер=и=имеют одинаковый приоритет.
опер может быть одним из операторов|,^,&,
<<,>>,+,-,*,
/,%. ?:-
Тернарный оператор.
a ? b : cистолковывается
так: если a, то b, иначе c. a
должно быть целого типа. ||- Логическое или. Определено на целых типах.
&&- Логическое и. Определено на целых типах.
|- Побитовое или. Определено на целых типах.
^- Побитовое исключающее или. Определено на целых типах.
&- Побитовое и. Определено на целых типах.
==, !=-
Равенство и неравенство. Определено на скалярных типах. Значение
этих выражений отлично от нуля для истины и 0 для лжи. <, >, <=, >=-
Меньше чем, больше чем, меньше или равно, больше или равно. Определено
на скалярных типах. Значение этих выражений равно 0 для лжи и отлично от нуля
для истины. <<, >>- Левый сдвиг и правый сдвиг. Определено на целых типах.
@-
Оператор GDB создания «искусственного массива»
(see section Выражения). +, --
Сложение и вычитание. Определено на целочисленных типах, типах с
плавающей точкой и указателях. *, /, %-
Умножение, деление и остаток. Умножение и деление определены на
целочисленных типах и типах с плавающей точкой. Остаток определен
на целочисленных типах. ++, ---
Инкремент и декремент. При появлении перед переменной,
операция выполняется прежде, чем переменная используется в
выражении; при появлении после переменной,
значение переменной используется до выполнения операции. *-
Разыменование указателя. Определено для указателей. Имеет тот
же приоритет, что и++. &-
Оператор получения адреса. Определен на переменных. Имеет тот же
приоритет, что и++.
Для отладки Си++, GDB реализует использование `&’
независимо от того, что позволяет сам язык Си++: вы можете использовать
`&(&ссылка)’ (или просто `&&ссылка‘),
чтобы исследовать адрес, по которому хранится
переменная-ссылка Си++ (объявленная с помощью `&ссылка‘). --
Унарный минус. Определен на целочисленных типах и типах с
плавающей точкой. Имеет тот же приоритет, что и++. !-
Логическое отрицание. Определено на целочисленных типах. Имеет тот
же приоритет, что и++. ~-
Оператор побитового дополнения. Определен на целочисленных
типах. Имеет тот же приоритет, что и++. ., ->-
Элемент структуры и указатель на элемент структуры. Для удобства,
GDB считает их эквивалентными, определяя, следует ли
разыменовывать указатель, основываясь на сохраненной информации о типах.
Определен на данных структуры (struct) и объединения (union). .*, ->*- Разыменовывание указателя на элемент.
[]-
Индексация массива.
a[i]определяется как
*(a+i). Имеет тот же приоритет, что и->. ()-
Список параметров функции. Имеет тот же приоритет, что и
->. ::-
Оператор Си++ определения области видимости. Определен на типах
struct,unionиclass. ::-
Двойное двоеточие также представляет оператор GDB области
видимости (see section Выражения). Имеет тот же приоритет, что
и::, описанный выше.
Если оператор переопределен в пользовательском коде, GDB обычно
пытается выполнить переопределенную версию, а не использовать
предопределенное значение оператора.
Константы Си и Си++
GDB позволяет вам выражать константы Си и Си++ следующими способами:
-
Целочисленные константы—это последовательности цифр. Восьмеричные
константы начинаются с `0′ (с нуля), а шестнадцатеричные константы—с
`0x’ или `0X’. Константы также могут заканчиваться буквой
`l’, указывая, что значение константы должно рассматриваться как
длинное (long). -
Константы с плавающей точкой—это последовательность цифр, за которой
следует десятичная точка, другая последовательность цифр, и, возможно,
порядок. Порядок указывается в форме
`e[[+]|-]nnn‘, где nnn—другая
последовательность цифр. Для положительных порядков `+’ является
необязательным. Константа с плавающей точкой может также
заканчиваться буквой `f’ или `F’, это указывает на то, что
константа должна рассматриваться какfloat(в отличие от
doubleпо умолчанию), или буквой `l’ или `L’, что
указывает на константу типаlong double. -
Перечисляемые константы состоят из перечисляемых идентификаторов, или
их целочисленных эквивалентов. -
Символьные константы—это одиночный символ, заключенный в одиночные
кавычки ('), или число—порядковое значение соответствующего
символа (обычно его значение ASCII). Внутри кавычек, одиночный
символ может быть представлен либо буквой, либо экранирующей
последовательностью, которая имеет форму `nnn‘, где
nnn является восьмеричным представлением порядкового значения
символа; или форму `x‘, где `x‘—специальный
предопределенный знак, например, `n’ для знака новой строки. -
Строковые константы—последовательность символьных констант (без
одиночных кавычек), заключенная в двойные кавычки ("). Туда
могут входить любые допустимые символьные константы (как описано выше).
Двойным кавычкам внутри строки должна предшествовать обратная косая
черта, так что `»a»b’c»‘, например, является строкой из пяти
символов. -
Константы-указатели представляют собой целочисленные значения. Вы можете также
записывать указатели на константы, используя оператор Cи `&’. -
Константы-массивы—заключенные в фигурные скобки (`{‘ и
`}’) списки элементов, разделенные запятыми; например,
`{1,2,3}’ является массивом с тремя целочисленными элементами,
`{{1,2}, {3,4}, {5,6}}’ является массивом размерности три
на два, и `{&»hi», &»there», &»fred»}’ является трехэлементным
массивом указателей.
Выражения Си++
Обработчик выражений GDB может интерпретировать большинство
выражений Си++.
Предупреждение: GDB может отлаживать программы на Си++
только если вы используете подходящий компилятор. Обычно,
отладка Си++ зависит от использования дополнительной отладочной информации в
таблице символов, и, таким образом, требует специальной поддержки.
В частности, если ваш компилятор генерирует a.out, MIPS ECOFF,
RS/6000 XCOFF, или ELF с расширениями stabs к таблице
символов, все эти средства доступны. (С GNU CC вы можете
использовать ключ `-gstabs’, чтобы явно запросить расширения
отладки stabs). С другой стороны, если формат объектного
кода—стандартный COFF или DWARF в ELF, значительная часть
поддержки Си++ в GDB не работает.
-
Допускаются вызовы функций-членов; вы можете использовать выражения типа
count = aml->GetOriginal(x, y)
-
Пока функция-член активна (в выбранном кадре стека), вашим выражениям
доступно то же пространство имен, что и функции-члену; то есть
GDB допускает неявные ссылки на указатель
экземпляра классаthisпо тем же правилам, что и Си++. -
Вы можете вызывать перегруженные функции; GDB производит вызов
функции с правильным определением, но с некоторыми ограничениями.
GDB не совершает преобразования, для выполнения которых требуются
преобразования типов, определенные пользователем, вызовы конструкторов
или конкретизации не существующих в программе шаблонов. Он также не
может обрабатывать списки с неопределенным числом аргументов
или аргументы со значениями по умолчанию.
Он производит преобразования и расширения целочисленных типов,
расширения типов с плавающей точкой, арифметические преобразования,
преобразования указателей, преобразования класса объекта в базовые
классы и стандартные преобразования, например функции или массива к
указателю; это требует точного совпадения числа аргументов функции.
Разрешение перегруженных имен производится всегда, если не
указаноset overload-resolution off. See section Возможности GDB для Си++.
Вы должны указатьset overload-resolution off, чтобы задать
функцию явно при вызове перегруженной функции, как в примереp 'foo(char,int)'('x', 13)Возможности GDB для завершения команд могут упростить это;
смотрите section Завершение команд. -
GDB понимает переменные, объявленные как ссылки Си++; вы можете
использовать их в выражениях, точно как вы делаете в исходном тексте
Си++—они автоматически разыменовываются.
В списке параметров, показываемом GDB при отображении кадра
стека, значения переменных-ссылок не отображаются (в отличие от
других переменных); это позволяет избежать неудобств из-за того, что ссылки
часто используются для больших структур. Адрес
переменной-ссылки всегда выводится, если только вы не установили
`set print address off’. -
GDB поддерживает оператор Си++ определения области видимости имени
::—ваши выражения могут использовать его так же, как в вашей
программе. Так как одна область видимости может быть определена
внутри другой, вы можете при необходимости неоднократно использовать
::, например, в выражении типа
`обл1::обл2::имя‘. GDB также
позволяет определить область видимости имени путем ссылки на исходный
файл, при отладке как Си, так и Си++ (see section Переменные программы).
Кроме того, при использовании с компилятором HP Си++, GDB
правильно поддерживает вызов виртуальных функций, вывод виртуальный баз
объектов, вызов функций в базовом подобъекте, приведение объектов и
выполнение операторов, определенных пользвателем.
Значения Си и Си++ по умолчанию
Если вы разрешаете GDB устанавливать проверки диапазона
и принадлежности типу автоматически, обе они по умолчанию
отключены, если рабочий язык изменяется на Си или Си++. Это
происходит независимо от того, выбираете рабочий язык вы или
GDB.
Если вы разрешаете GDB устанавливать язык автоматически, он распознает
исходные файлы, чьи имена заканчиваются расширением `.c',
`.C' или `.cc', и так далее, и когда GDB начинает
обработку кода, скомпилированного из одного из этих файлов, он
устанавливает рабочий язык в Си или Си++.
See section Распознавание GDB исходного языка, для более подробного обсуждения.
Проверки диапазона и принадлежности типу в Си и Си++
Когда GDB производит разбор выражений Си или Си++, по умолчанию
проверки соответствия типов не проводятся. Однако, если вы их включите,
GDB считает типы двух переменных эквивалентными, если:
-
Обе переменные структурированы и имеют один и тот же тег структуры,
объединения или перечисления. -
Имена типов обеих переменных совпадают или были объявлены
эквивалентными черезtypedef.
Проверка диапазона, если она включена, выполняется для
математических операций. Индексы массивов не проверяются, так как они
часто применяются для индексирования указателей, которые
сами по себе массивами не являются.
GDB и Си
Команды set print union и show print union применимы к типу
union. При установке в `on’, любые объединения, находящиеся внутри
структуры или класса, также выводятся. В противном случае, они
отображаются как `{…}’.
Оператор @ помогает при отладке динамических массивов,
сформированных с помощью указателей и функции выделения памяти.
See section Выражения.
Возможности GDB для Си++
Некоторые команды GDB особенно полезны при использовании с
Си++, а некоторые разработаны специально для него. Ниже приведено их
краткое описание:
меню точки останова-
Когда вы хотите установить точку останова в перегруженной
функции, меню точки останова GDB помогает вам указать, какое
определение функции вам нужно. See section Меню точки останова. rbreak рег-выр-
Установка точек останова при помощи регулярных выражений
полезна при использовании перегруженных функций,
не являющихся членами специальных классов. See section Установка точек останова. catch throwcatch catch-
Отлаживайте обработку исключений Си++ с помощью этих команд.
See section Установка точек перехвата. ptype имя-типа-
Вывести отношения наследования вместе с другой информацией для типа
имя-типа. See section Исследование таблицы символов. set print demangleshow print demangleset print asm-demangleshow print asm-demangle-
Управляет отображением символов Си++ в их исходной форме, как при выводе
кода в виде исходного текста Си++, так и при выводе результата
дисассемблирования.
See section Параметры вывода. set print objectshow print object-
Выбрать, выводить производные (реальные) или описанные типы объектов.
See section Параметры вывода. set print vtblshow print vtbl-
Управляет форматом вывода таблиц виртуальных функций.
See section Параметры вывода.
(Командыvtblне работают для программ, скомпилированных
компилятором HP ANSI Си++ (aCC).) set overload-resolution on-
Включить разрешение перегруженных символов при вычислении выражений
Си++. Значение по умолчаниюon. Для перегруженных функций,
GDB вычисляет аргументы и ищет функции, чьи сигнатуры
удовлетворяют типам аргументов, используя стандартные правила
преобразования Си++ (смотрите section Выражения Си++, для
дополнительной информации). Если GDB не может найти такие
функции, он выводит сообщение. set overload-resolution off-
Отключить разрешение перегруженных символов при вычислении выражений
Си++. Для перегруженных функций, не являющихся функциями-членами
класса, GDB выбирает функцию с указанным именем, которую
он первой находит в таблице символов, в не зависимости от того, правильного
типа ее аргументы или нет. Для перегруженных функций, являющихся
функциями-членами класса, GDB ищет функцию, чья сигнатура
точно совпадает с типами аргументов. Перегруженные имена смиволов-
Вы можете указать конкретное определение перегруженного символа,
используя ту же запись, что и для объявления таких символов в
Си++: введитесимвол(типы)вместо просто
символ. Вы также можете воспользоваться средствами завершения
слова командной строки GDB, чтобы вывести список возможных
вариантов, или чтобы завершить набор за вас.
See section Завершение команд, для подробного обсуждения, как это
сделать.
Модула-2
Расширения, сделанные в GDB для поддержки Модулы-2,
поддерживаются только для программ, скомпилированных
GNU компилятором Модулы-2 (который сейчас разрабатывается).
Другие компиляторы Модулы-2 в настоящее время не
поддерживаются, и попытка отладки исполняемых программ, полученных
ими, скорее всего приведет к ошибке при считывании GDB таблицы
символов этой программы.
Операторы Модулы-2
Операторы должны быть определены на значениях определенных типов.
Например, + определен на числах, но не на структурах.
Операторы часто определяются на группах типов. Для целей Модулы-2,
имеют место следующие определения:
-
Целые типы состоят из
INTEGER,CARDINAL
и их поддиапазонов. -
Символьные типы состоят из
CHARи его поддиапазонов. -
Типы с плавающей точкой состоят из
REAL. -
Типы-указатели состоят из всего, объявленного как
POINTER TO.
тип - Скалярные типы включают все вышеперечисленное.
-
Типы-множества состоят из типов
SETиBITSET. -
Булевый тип состоит из
BOOLEAN.
Поддерживаются следующие операторы; они представлены в порядке
возрастания приоритета:
,- Разделитель аргументов функции или индексов массива.
:=-
Присваивание. Значением перем
:=знач является знач. <, >-
Меньше чем, больше чем для целочисленных типов, типов с
плавающей точкой и перечислимых типов. <=, >=-
Меньше или равно, больше или равно. Определено на
целочисленных типах, типах с плавающей точкой и перечислимых типах.
Включение для множеств. Такой же приоритет, как у<. =, <>, #-
Равенство и два способа выражения неравенства; допустимо на
скалярных типах. Такой же приоритет, как у<. В сценариях
GDB, для неравенства допустимо только<>, так как
#конфликтует со знаком комментария. IN-
Установка принадлежности. Определено на множествах и
типах их элементов. Такой же приоритет, как у<. OR- Дизъюнкция (логическое ИЛИ). Определена на булевых типах.
AND, &- Конъюнкция (логическое И). Определена на булевых типах.
@- Оператор «искусственного массива» GDB (see section Выражения).
+, --
Сложение и вычитание на целочисленных типах и типах с плавающей
точкой, или объединение и разность на множественных типах. *-
Умножение на целочисленных типах и типах с плавающей точкой, или
пересечение на типах-множествах. /-
Деление на типах с плавающей точкой. Симметрическая разность
множеств на типах-множествах. Такой же приоритет, как у*. DIV, MOD-
Целочисленное деление и остаток. Определены на целочисленных
типах. Такой же приоритет, как у*. --
Отрицание. Определено на данных типов
INTEGERиREAL. ^- Разыменовывание указателя. Определено на типах-указателях.
NOT-
Булево отрицание. Определено на булевых типах. Такой же приоритет, как
у^. .-
Селектор полей
RECORD. Определен для данных типаRECORD.
Такое же приоритет, как у^. []-
Индексация массива. Определена для данных типа
ARRAY. Такой же
приоритет, как у^. ()-
Список параметров процедуры. Определен на объектах
PROCEDURE.
Такой же приоритет, как у^. ::, .- Операторы GDB и Модулы-2 определения области видимости.
Предупреждение: Множества и операции над ними еще не
поддерживаются, так что GDB трактует использование оператора
INили операторов+,-,*,/,
=, ,<>,#,<=, и>=на
множествах как ошибку.
Встроенные функции и процедуры
Модула-2 также делает доступными несколько встроенных процедур и
функций. При их описании, используются следующие метапеременные:
- a
-
представляет переменную типа
ARRAY. - c
-
представляет константу или переменную типа
CHAR. - i
- представляет переменную или константу целого типа.
- m
-
представляет идентификатор, принадлежащий множеству. Обычно
используется в одной функции с метапеременной s. Тип s
должен бытьSET OF метатип(где метатип—тип m). - n
-
представляет переменную или константу целого типа или
типа с плавающей точкой. - r
- представляет переменную или константу типа с плавающей точкой.
- t
- представляет тип.
- v
- представляет переменную.
- x
-
представляет переменную или константу одного из нескольких типов.
Смотрите пояснение к функции для дополнительной информации.
Ниже описаны все встроенные процедуры Модулы-2, возвращающие результат.
ABS(n)- Возвращает абсолютное значение n.
CAP(c)-
Если c—символ нижнего регистра, процедура возвращает его эквивалент
в верхнем регистре, иначе возвращает сам аргумент. CHR(i)- Возвращает символ, порядковое значение которого есть i.
DEC(v)- Уменьшает значение переменной v на единицу. Возвращает новое значение.
DEC(v,i)- Уменьшает значение переменной v на i. Возвращает новое значение.
EXCL(m,s)- Удаляет элемент m из множества s. Возвращает новое множество.
FLOAT(i)- Возвращает эквивалент целого числа i в формате с плавающей точкой.
HIGH(a)- Возвращает индекс последнего элемента a.
INC(v)-
Увеличивает значение переменной v на единицу. Возвращает новое
значение. INC(v,i)-
Увеличивает значение переменной v на i. Возвращает новое
значение. INCL(m,s)-
Добавляет элемент m в множество s, если его там еще нет.
Возвращает новое множество. MAX(t)- Возвращает максимальное значение типа t.
MIN(t)- Возвращает минимальное значение типа t.
ODD(i)- Возвращает булево значение TRUE, если число i нечетно.
ORD(x)-
Возвращает порядковое значение своего аргумента. Например, порядковое
значение символа—его ASCII-значение (на машинах, поддерживающих
набор символов ASCII). x должна принадлежать упорядоченному
типу, что включает целочисленные, символьный и перечислимый типы. SIZE(x)- Возвращает размер аргумента. x может быть переменной или типом.
TRUNC(r)- Возвращает целую часть r.
VAL(t,i)- Возвращает элемент типа t, порядковое значение которого есть i.
Предупреждение: Множества и операции над ними еще не
поддерживаются, так что GDB рассматривает использование
процедурINCLиEXCLкак ошибку.
Константы
GDB позволяет вам выражать константы Модулы-2 следующими способами:
-
Целые константы являются просто последовательностью цифр.
При использовании в выражении, константа интерпретируется так, чтобы быть
совместимой по типу с остальной частью выражения. Шестнадцатеричные
целые числа определяются окончанием `H’, а восьмеричные—
окончанием `B’. -
Константы с плавающей точкой задаются как последовательность цифр,
за которой следует десятичная точка и другая последовательность цифр.
Необязательный порядок может быть задан в форме
`E[+|-]nnn‘, где
`[+|-]nnn‘ и есть желаемый порядок. Все цифры
константы с плавающей точкой должны быть десятичными (по основанию 10). -
Символьные константы состоят из одиночных символов, заключенных в пару
одинаковых кавычек: либо одиночных ('), либо двойных (").
Они также могут быть заданы своим порядковым значением (обычно
ASCII-значением), за которым следует `C’. -
Строковые константы состоят из последовательности символов, окруженных
парой одинаковых кавычек: либо одиночных ('), либо двойных
("). Также допускаются экранирующие последовательности в
стиле Си. See section Константы Си и Си++, для краткого
объяснения экранирующих последовательностей. - Перечислимые константы состоят из перечислимого идентификатора.
-
Булевы константы состоят из идентификаторов
TRUEиFALSE. - Константы-указатели состоят только из целочисленных значений.
- Константы-множества пока не поддерживаются.
Установки по умолчанию Модулы-2
Если проверка диапазона или принадлежности типу устанавливается
GDB автоматически, то по умолчанию обе они устанавливаются в
on, если рабочим языком становится Модула-2. Это происходит
независимо от того, кто выбрал рабочий язык—вы или GDB.
Если вы разрешаете GDB выбирать язык автоматически, то при анализе
кода, скомпилированного из файла, чье имя оканчивается на `.mod',
GDB установит рабочим языком Модулу-2. See section Распознавание GDB исходного языка, для
дополнительной информации.
Отклонения от стандарта Модулы-2
Для упрощения отладки программ на Модуле-2 было сделано несколько
изменений. В основном, это сделано путем ослабления строгости контроля типов:
-
В отличие от стандарта Модулы-2, константы-указатели могут быть
сформированы целыми числами. Это позволяет вам изменять
переменные-указатели в процессе отладки. (В стандарте Модулы-2,
реальный адрес, содержащийся в переменной-указателе, скрыт от
вас; его можно изменить лишь прямым присваиванием значения другой
переменной-указателя или выражения, возвращающего указатель.) -
Экранирующие последовательности Си могут использоваться в строках и
символах, чтобы представить непечатаемые символы. GDB выводит
строки со встроенными экранирующими последовательностями. Одиночные
непечатаемые символы выводятся с помощью формата `CHR(nnn)’. -
Оператор присваивания (
:=) возвращает значение своего правого аргумента. - Все встроенные процедуры как изменяют, так и возвращают свой аргумент.
Проверки диапазона и принадлежности типу Модулы-2
Предупреждение: в этом выпуске, GDB еще не выполняет проверки
диапазона и принадлежности типу.
GDB считает две переменные Модулы-2 эквивалентными по типу,
если:
-
Их типы были объявлены эквивалентными посредством оператора
TYPE
t1 = t2 -
Они были объявлены на одной и той же строке. (Примечание: Это верно
для компилятора GNU Модула-2, но это может не выполнятся для других
компиляторов.)
Пока проверка соответствия типов включена, любая попытка
скомбинировать переменные не эквивалентных типов является ошибкой.
Проверка диапазона выполняется во всех математических операциях,
присваиваниях, при индексации массивов и во всех встроенных функциях
и процедурах.
Операторы определения области видимости :: и .
Существует несколько тонких различий между операторами области видимости
Модулы-2 (.) и GDB (::). Оба имеют похожий синтаксис:
модуль . идент область :: идент
где область—имя модуля или процедуры, модуль—имя модуля,
а идент—любой идентификатор, описанный в пределах вашей программы,
за исключением другого модуля.
Использование оператора :: заставляет GDB искать
идентификатор идент в области. Если он в ней
не найден, GDB ищет его во всех областях,
содержащих область.
Использование оператора . заставляет GDB искать
идентификатор идент, который был импортирован из модуля определения
модуль, в текущей области видимости. В этом операторе cчитается
ошибкой, если идентификатор идент не был
импортирован из модуля определения модуль, или если идент не
является в нем идентификатором.
GDB и Модула-2
Некоторые команды GDB имеют мало смысла при отладке программ на
Модуле-2. Пять подкоманд из команд set print и show применимы исключительно к Си и Си++: `vtbl’, `demangle’,
print
`asm-demangle’, `object’ и `union’. Первые четыре
применимы к Си++, а последняя к типу Си union, который не имеет
прямого аналога в Модуле-2.
Оператор @ (see section Выражения) хоть и доступен при
использовании любого языка, бесполезен при работе с Модулой-2. Его цель
состоит в том, чтобы помочь при отладке динамических массивов, которые
не могут быть созданы в Модуле-2 в отличие от Си или Си++. Однако,
конструкция `{тип}адр-выр‘ все же полезна, так как
адрес может быть определен целочисленной константой.
В сценариях GDB, оператор неравенства Модулы-2 #
интерпретируется как начало комментария. Используйте вместо него <>.
Chill
Расширения, сделанные в GDB для поддержки Chill, работают
только с программами, созданными компилятором GNU Chill.
Другие компиляторы Chill в настоящее время не поддерживаются, и попытка
отладить программы, полученные с их помощью, скорее всего приведет к
ошибке в тот момент, когда GDB будет считывать таблицу символов
выполняемого файла.
Этот раздел охватывает темы, связанные с Chill, и возможности
GDB для их поддержки.
Как отображаются режимы
Поддержка GDB типов данных (режимов) Chill непосредственно
связана с возможностями компилятора GNU Chill, и, следовательно,
слегка отличается от стандартной спецификации языка. Вот
предоставляемые режимы:
Дискретные режимы:-
-
Целочисленные режимы, которые предопределены как
BYTE,,
UBYTE, INT, UINT, LONG, ULONG -
Булевский режим, который предопределен как
BOOL, -
Символьный режим, который предопределен как
CHAR, -
Режим-множество, который отображается ключевым словом
SET.(gdb) ptype x type = SET (karli = 10, susi = 20, fritzi = 100)
Если тип является ненумерованным множеством, значения элементов
множества опускаются. -
Режим-диапазон, который отображается как
тип = <базовый-режим>(<нижняя граница> : <верхняя граница>)где
<нижняя граница>, <верхняя граница>может быть любым
дискретным буквенным выражением (например, имена элементов множества).
-
Целочисленные режимы, которые предопределены как
Режим powerset:-
Режим Powerset отображается ключевым словом
POWERSET, за
которым следует режим элемента.(gdb) ptype x type = POWERSET SET (egon, hugo, otto)
Режимы-ссылки:-
-
Режим привязанной ссылки, который отображается ключевым словом
REF, за которым следует название режима, к которому ссылка
привязана. -
Режим свободной ссылки, который отображается ключевым словом
PTR.
-
Режим привязанной ссылки, который отображается ключевым словом
Процедурный режим-
Процедурный режим отображается в виде
тип = PROC(<список параметров>).
<возвращаемый режим> EXCEPTIONS (<список исключений>)<списокпредставляет собой список режимов параметров.
параметров>
<возвращаемый режим>указывает режим результата процедуры, если
она возвращает результат.<список исключений>перечисляет все
возможные исключения, которые могут быть возбуждены процедурой. Синхронизационные режимы:-
-
Режим события, который отображается как
EVENT (<длина события>)где
<длина события>является необязательной. -
Буферный режим, который отображается как
BUFFER (<длина буфера>)<режим елементов буфера>где
(<длина буфера>)является необязательной.
-
Режим события, который отображается как
Режимы времени:-
-
Режим длительности, который предопределен как
DURATION -
Режим абсолютного времени, который предопределен как
TIME
-
Режим длительности, который предопределен как
Вещественные режимы:-
Вещественные режимы предопределены как
REALиLONG_REAL. Строковые режимы:-
-
Режим строки символов, который отображается как
CHARS(<длина строки>)за которым следует ключевое слово
VARYING, если строковый режим
является изменяющимся режимом -
Режим строки битов, который отображается как
BOOLS(<длина строки>)
-
Режим строки символов, который отображается как
Режим массива:-
Режим массива отображается ключевым словом
ARRAY(<диапазон>),
за которым следует режим элементов (который, в свою очередь, может быть
режимом массива).(gdb) ptype x type = ARRAY (1:42) ARRAY (1:20) SET (karli = 10, susi = 20, fritzi = 100) Структурный режим-
Структурный режим отображается ключевым словом
STRUCT(<список.
полей>)<список полей>состоит из имен и режимов полей
структуры. Структуры с вариантами имеют ключевое словоCASEв их списке полей. Так как текущая
<поле> OF <варианты поля> ESAC
версия компилятора GNU Chill не реализует обработку тегов (нет
проверок времени выполнения вариантных полей, и, следовательно, нет
отладочной информации), вывод всегда содержит все вариантные поля.(gdb) ptype str type = STRUCT ( as x, bs x, CASE bs OF (karli): cs a (ott): ds x ESAC )
Местоположения и доступ к ним
Местоположением в Chill является объект, который может содержать
значения.
Доступ к значению местоположения обычно производится посредством
(описанного) имени местоположения. Вывод удовлетворяет спецификации
значений в программах на Chill. То, как значения задаются, является темой
следующего раздела, смотрите section Значения и операции с ними.
Псевдо-местоположение RESULT (или result) может
использоваться для отображения или изменения результата процедуры,
активной в настоящий момент:
set result := EXPR
Это делает то же самое, что и действие Chill RESULT EXPR (которое
в GDB недоступно).
Значения местоположений режима ссылок выводятся, в случае режима
свободной ссылки, посредством
PTR(<шестнадцатеричное значение>), и с помощью (REF <режим ссылки>) (<шестнадцатеричное в случае привязанной ссылки.
значение>)<шестнадцатеричное представляет адрес, на который указывает ссылка. Для доступа
значение>
к значению местоположения, указываемого ссылкой, используйте оператор
разыменовывания `->’.
Значения местоположений процедурного режима отображаются как
{ PROC
(<режимы аргументов> ) <возвращаемый режим> } <адрес> <имя
местоположения процедуры>
<режимы аргументов>—это список
режимов, в соответствии со спецификацией параметров процедуры, а
<адрес> указывает адрес точки входа.
Подструктуры значений строковых режимов, режимов массивов или структур
(например, срезы массивов, поля структурных местоположений) доступны при
использовании определенных операторов, которые описаны в следующем
разделе, смотрите section Значения и операции с ними.
Значение местоположения может быть интерпретировано как имеющее другой
режим посредством преобразования местоположений. Это преобразование
режимов записывается как <имя режима>(<местоположение>).
Пользователь должен учесть, что размеры режимов должны быть равными, в
противном случае возникает ошибка. Более того, не производится никаких
проверок диапазона местоположения по сравнению с режимом назначения, и,
следовательно, результат может быть достаточно обескураживающим.
(gdb) print int (s(3 up 4)) XXX TO be filled in !! XXX
Значения и операции с ними
Значения используются для изменения местоположений, для более подробного
изучения сложных структур и для отфильтровывания значимой информации из
большого объема данных. Определено несколько операций
(зависящих от режима), которые позволяют проводить подобные изучения.
Эти операции применимы не только к значениям-константам, но также и к
местоположениям, что может оказаться достаточно полезным при отладке
сложных структур. Во время разбора командной строки (например, вычисляя
выражение), GDB рассматривает имена местоположений как значения
этих местоположений.
Этот раздел описывает, как должны задаваться значения и какие операции
допустимо использовать с этими значениями.
Буквенные значения-
Буквенные значения определяются также, как в программах
GNU Chill. Для подробной спецификации, смотрите главу 1.5
Руководства по реализации GNU Chill. Значения-наборы-
Набор может быть задан как
<имя режима>[<набор>], где<имяможет быть опущено, если режим набора определяется однозначно.
режима>
Эта однозначность определяется из контекста вычисляемого выражения.
<набор>может быть одним из:- Набор powerset
- Набор массивов
- Набор структур
Наборы-powerset, наборы массивов и наборы структур определяются также,
как в программах на Chill. Значение элемента строки-
Значение элемента строки задается как
<строковое значение>(<индекс>)где
<индекс>является целочисленным
выражением. Это дает символьное значение, которое экивалентно символу,
указываемому в строке индексом<индекс>. Значение среза строки-
Значение среза строки задается как
<значение строки>(<спецификация, где
среза>)<спецификация среза>может быть либо диапазоном
целых выражений, либо задаваться в виде<начальное выражение> up.
<размер><размер>обозначает число элементов, которое содержит
срез. Полученная величина является строкой, которая является частью
указанной строки. Значения элементов массива-
Значение элемента массива указывается как
<величинаи дает величину элемента массива с режимом как у
массива>(<выр>)
указанного массива. Значение среза массива-
Срез массива задается как
<значение массива>(<спецификация, где
среза>)<спецификация среза>может быть диапазоном,
определенным либо выражениями, либо как<начальное выр> up.
<размер><размер>обозначает число элементов массива, которое
содержит срез. Получаемое значение есть массив, который является
частью указанного. Значение поля структуры-
Значение поля структуры получается как
<значение структуры>.<имя, где
поля><имя поля>указывает имя поля, заданное в определении
режима структуры. Режим полученного значения соответствует этому
определению режима в определении структуры. Значения вызова процедуры-
Значение вызова процедуры получается из значения, возвращенного
процедурой(13).
Значения местоположений режима длительности представляются буквами
ULONG.
Значения местоположений режима-времени выводятся какTIME(<сек>:<нсек>). Значение безаргументного оператора-
Значение безаргументного оператора получается из значения экземпляра для
текущего активного процесса. Значения выражений-
Значение, доставляемое выражением, является результатом вычисления
указанного выражения. В случае ошибки (несовместимость режимов, и так
далее), вычисление выражения прерывается с соответствующим сообщением об
ошибке. Выражение может быть заключено в скобки, что приводит к
вычислению этого выражения до любого другого, использующего результат
выражения в скобках. GDB поддерживаются следующие операторы:OR, ORIF, XORAND, ANDIFNOT- Логические операторы, определенные на операндах булевого режима.
=, /=- Операторы равенства и неравенства, определенные на всех режимах.
>, >=<, <=- Операторы отношения, заданные на предопределенных режимах.
+, -*, /, MOD, REM- Арифметические операторы, заданные на предопределенных режимах.
-- Оператор изменения знака.
//- Оператор соединения строк.
()- Оператор повторения строки.
->-
Оператор ссылки местоположения, который может быть использован
либо для получения адреса местоположения (->loc), или для
разыменовывания ссылки местоположения (loc->). OR, XORANDNOT- Операторы режимов powerset и строки битов.
>, >=<, <=- Операторы включения режима powerset.
IN- Оператор принадлежности.
Проверка диапазона и типов в Chill
GDB считает два режима переменных Chill эквивалентными, если их
размеры равны. Это правило применяется рекурсивно для
более сложных типов данных. Это означает, что сложные режимы
считаются эквивалентными, если режимы всех элементов (которые тоже могут
быть сложными, например, массивами, структурами, и так далее) имеют
одинаковый размер.
Проверка диапазона производится для всех математических операций,
присваиваний, границ индексов массива и всех встроенных процедур.
Строгие проверки типов включаются с помощью команды GDB
set check strong. Это навязывает строгую проверку диапазона и
принадлежности типу для всех действий, где используются конструкции
Chill (выражения, встроенные функции, и так далее), в соответствии с
семантикой, определенной в спецификации языка z.200.
Все проверки могут быть отключены командой GDB set check.
off
Установки по умолчанию Chill
Если проверки типа и диапазона установлены GDB автоматически,
обе они по умолчанию включены, когда рабочий язык переключается на
Chill. Это происходит независимо от того, вы выбрали рабочий язык или
GDB.
Если вы разрешите GDB устанавливать рабочий язык автоматически,
то при попадании в код, скомпилированный из файла, чье имя заканчивается
на `.ch', он переключает рабочий язык на Chill. See section Распознавание GDB исходного языка, для
дополнительной информации.
Исследование таблицы символов
Команды, описанные в этой главе, позволяют вам получить информацию
о символах (именах переменных, функций и типов), определенных в вашей
программе. Эта информация присуща тексту вашей программы и не изменяется при
ее выполнении. GDB находит эту информацию в таблице символов
вашей программы, в файле, определенном при его вызове (see section Выбор файлов), или посредством одной из команд управления
файлами (see section Команды для задания файлов).
Иногда вам может потребоваться сослаться на символы, содержащие
необычные знаки, которые GDB обычно трактует как разделители
слов. Наиболее часто это встречается при ссылках на статические
переменные в других исходных файлах (see section Переменные программы). Имена файлов записаны в объектных файлах как отладочные
символы, но GDB обычно производит разбор типичного имени файла, например
`foo.c', как три слова: `foo’ . c. Чтобы GDB
идентифицировал `foo.c’ как одно слово, заключите его в одинарные
кавычки; например,
p 'foo.c'::x
ищет значение x в области видимости файла `foo.c'.
info address символ-
Описывает, где хранятся данные для символа. Для регистровой
переменной сообщается, в каком регистре она содержится. Для
нерегистровой локальной переменной печатается смещение в
кадре стека, по которому переменная всегда хранится.
Заметьте отличие от команды `print &символ‘, которая вообще
не работает для регистровых переменных, а для локальной
переменной из стека печатает точный адрес текущего экземпляра переменной. whatis выраж-
Напечатать тип данных выражения выраж. На самом деле выраж не
вычисляется, а присутствующие в нем побочные операции (такие как присваивания
или вызовы функций) не выполняются. See section Выражения. whatis-
Вывести тип данных
$, последней записи в истории значений. ptype имя-типа-
Вывести описание типа данных имя-типа. Имя-типа может быть именем
типа или, для кода Си, может иметь форму `class имя-класса‘,
`struct тег-структуры‘, `union тег-объединения‘
или `enum тег-перечисления‘. ptype выражptype-
Вывести описание типа выражения выраж.
ptypeотличается от
whatisтем, что выводится детальное описание, а не только имя
типа.
Например, для такого описания переменной:struct complex {double real; double imag;} v;эти две команды выведут следущее:
(gdb) whatis v type = struct complex (gdb) ptype v type = struct complex { double real; double imag; }Как и
whatis, использованиеptypeбез параметра относится
к типу$, последней записи в истории значений. info types рег-вырinfo types-
Вывести краткое описание всех типов, имена которых соответствуют
регулярному выражению
рег-выр (или всех типов вашей программы, если вы используете эту
команду без параметра). Каждое полное имя типа сопоставляется так, как
если бы оно было полной строкой; таким образом, `i type value’
выдает информацию обо всех типах в вашей программе, чьи имена
включают стpокуvalue, а `i type ^value$’ выдает инфоpмацию
только о типах с полным именемvalue.
Эта команда отличается отptypeследующим: во-пеpвых, как и
whatis, она не выводит детального описания; во-вторых, она
перечисляет все исходные файлы, где определен тип. info source-
Показать имя текущего исходного файла—то есть исходного файла для функции,
содержащей текущую точку выполнения, и язык, на котоpом она написана. info sources-
Вывести имена всех исходных файлов вашей программы, для которых
имеется отладочная инфоpмация, организуя их в два списка: файлы с
уже прочитанными символами, и файлы, символы которых будут
пpочитаны, когда потребуется. info functions- Вывести имена и типы данных всех опpеделенных функций.
info functions рег-выр-
Вывести имена и типы данных всех опpеделенных функций, чьи имена
удовлетворяют регулярному выражению рег-выр. Так, `info
fun step’ находит все функции, имена которых содержатstep;
`info fun ^step’ находит функции с именами, начинающимися соstep. info variables-
Напечатать имена и типы данных всех пеpеменных, объявленных вне функций
(то есть исключая локальные пеpеменные). info variables рег-выр-
Вывести имена и типы данных всех пеpеменных (кpоме локальных), имена
которых удовлетворяют регулярному выражению рег-выр.Некоторые системы допускают замещение отдельных объектных файлов,
составляющих вашу программу, без ее остановки и перезапуска.
Например, в VxWorks вы можете пpосто перекомпилировать дефектный
объектный файл и продолжить выполнение. Если вы работаете в одной из
таких систем, вы можете позволить GDB перезагрузить символы для
автоматически пересобранных модулей:set symbol-reloading on-
Заменить опеделения символов для соответствующего исходного
файла, когда объектный файл с определенным именем снова доступен. set symbol-reloading off-
Не заменять опpеделения символов при встрече объектного файла с таким же
именем более одного раза. Это состояние по умолчанию; если вы не
работаете в системе, допускающей автоматическое пересобирание модулей,
вы должны оставитьsymbol-reloadingв состоянииoff, так как
иначе GDB может уничтожить символы пpи сборке больших программ,
которые могут содеpжать несколько модулей с одинаковым именем (из разных
каталогов или библиотек). show symbol-reloading-
Показать текущую установку
onилиoff.
set opaque-type-resolution on-
Велит GDB производить разрешение неоднозначных типов. Неоднозначным
является тип, описанный как указатель наstruct,class
илиunion—например,struct MyType *—то есть,
используется в одном исходном файле, хотя полное описаниеstructнаходится в другом исходном файле. По умолчаний установлено в
MyType
on.
Изменения в установке этой подкомандой не вступят в силу, пока символы
для этого файла не будут снова загружены. set opaque-type-resolution off-
Указывает GDB не производить разрешение неоднозначных типов. В
этом случае, тип выводится следующим образом:{<no data fields>} show opaque-type-resolution- Показать, производится разрешение неоднозначных типов или нет.
maint print symbols имя-файлаmaint print psymbols имя-файлаmaint print msymbols имя-файла-
Записать дамп данных отладочных символов в файл имя-файла. Эти
команды используются для отладки кода GDB, осуществляющего
чтение символов. Включаются только символы с отладочными данными. Если вы
используете `maint print symbols’, GDB включает все символы, для
которых уже собрана полная информация: то есть имя-файла отражает
символы только для тех файлов, символы которых GDB уже
прочитал. Вы можете использовать командуinfo sources, чтобы
определить, какие это файлы. Если же вы используете `maint print
psymbols’, дамп показывает информацию о тех символах, о которых
GDB имеет лишь частичную информацию, то есть символы определены
в файлах, которые GDB только просмотрел, но не прочитал
полностью. Наконец, `maint print msymbols’, выводит только
минимальную информацию о символах, требуемую для каждого
объектного файла, из которых GDB пpочитал какие-либо символы.
See section Команды для задания файлов, для обсуждения как
GDB считывает символы (в описанииsymbol-file).
Изменение выполнения
Если вы думаете, что нашли ошибку в своей программе, вы можете захотеть
выяснить наверняка, приведет ли исправление кажущейся ошибки к
правильным результатам в остальной части программы. Вы можете получить
ответ экспериментируя, используя средства GDB для изменения
выполнения программы.
Например, вы можете сохранить новые значения в переменных или
ячейках памяти, подать своей программе сигнал, перезапустить ее
с другого адреса или даже преждевременно вернуться из функции.
Присваивание значений пеpеменным
Для изменения значения переменной, вычислите выражение присваивания.
See section Выражения. Например,
print x=4
сохраняет значение 4 в переменной x и затем выводит значение данного
выражения (которое равно 4). See section Использование GDB с различными языками программирования, для получения большей инфоpмации
об операторах в поддерживаемых языках.
Если вы не хотите видеть значение присваивания, используйте команду
set вместо print. Команда set аналогична команде
print за исключением того, что значение выражения не выводится и не
заносится в историю значений (see section История значений). Выражение вычисляется только ради его действия.
Если начало строки параметров команды set выглядит идентично
подкоманде set, используйте вместо нее команду set. Эта команда аналогична
variableset, но не имеет подкоманд.
Например, если в вашей программе есть переменная width, то вы получите
ошибку, если попытаетесь установить новое значение просто с помощью
`set width=13′, потому что GDB имеет команду
set width:
(gdb) whatis width type = double (gdb) p width $4 = 13 (gdb) set width=47 Invalid syntax in expression.
Недопустимое выражение, это, конечно, `=47′. Для того чтобы
действительно установить переменную программы width, используйте
(gdb) set var width=47
Так как команда set имеет много подкоманд, которые могут
конфликтовать с именами переменных в программе, то хорошей практикой
является использование команды set variable вместо просто
set. Например, если ваша программа имеет переменную g, у
вас возникнут проблемы, если вы попытаетесь установить новое значение
с помощью `set g=4′, потому что GDB имеет команду
set gnutarget, которая сокращается как set g:
(gdb) whatis g
type = double
(gdb) p g
$1 = 1
(gdb) set g=4
(gdb) p g
$2 = 1
(gdb) r
The program being debugged has been started already.
Start it from the beginning? (y or n) y
Starting program: /home/smith/cc_progs/a.out
"/home/smith/cc_progs/a.out": can't open to read symbols:
Invalid bfd target.
(gdb) show g
The current BFD target is "=4".
Переменная программы g не изменилась, и вы незаметно установили
gnutarget в неверное значение. Для установки значения переменной
g, используйте
(gdb) set var g=4
GDB допускает больше неявных преобразований в присваиваниях,
чем Си; вы можете свободно сохранить целое значение в
переменной-указателе и наоборот, преобразовать любую структуру к любой
другой, которая имеет ту же длину или короче.
Для сохранения значений в произвольных местах
памяти, используйте конструкцию `{…}’ для создания
значения определенного типа по определенному адресу памяти
(see section Выражения). Например, {int}0x83040
ссылается на ячейку памяти 0x83040 как на целое (что
предполагает соответствующий размер и представление в памяти), и
set {int}0x83040 = 4
записывает в эту ячейку памяти значение 4.
Продолжение исполнения с другого адреса
Обычно, когда вы продолжаете выполнение программы, вы делаете это
с того места, где она остановилась, командой continue. Вместо
этого, вы можете продолжить выполнение с любого выбранного адреса
при помощи следующих команд:
jump указ-стр-
Возобновить выполнение со строки указ-стр. Если там есть точка
останова, выполнение немедленно прекращается. See section Вывод строк исходного текста, для описания различных форм указ-стр.
Использование командыtbreakвместе сjumpявляется
обычной практикой. See section Установка точек останова.
Командаjumpне изменяет ни текущий кадр стека, ни
указатель стека, ни содержимое каких-либо ячеек памяти или регистров, кроме
счетчика программы. Если строка указ-стр находится вне
выполняющейся в настоящее время функции,
результаты могут быть странными, если эти
функции используют аргументы или локальные переменные разных типов. По
этой причине, командаjumpзапрашивает подтверждение, если
указанная строка не находится в функции, выполняющейся в настоящее
время. Однако, даже странные результаты предсказуемы, если вы хорошо
знакомы с машинным кодом вашей программы. jump *адрес- Возобновить выполнение с инструкции, находящейся по адресу адрес.
На многих системах, вы можете достичь такого же результата, как и с командой
jump, сохранением нового значения в регистр $pc. Отличие в
заключается том, что это не начинает выполнение вашей программы, а лишь
изменяет адрес, с которого будет выполняться программа,
когда вы продолжите выполнение. Например,
set $pc = 0x485
выполняет следующую команду continue или команду пошагового
выполнения с адреса 0x485, а не с того адреса, где ваша программа
остановилась. See section Продолжение и выполнение по шагам.
Наиболее общий случай использования команды jump состоит в
возврате к выполнению части программы, возможно с большим количеством
установленных точек останова, которая уже выполнилась, для того чтобы
исследовать выполнение более детально.
Подача сигнала вашей программе
signal сигнал-
Возобновить выполнение с места остановки вашей программы, но немедленно
подать ей сигнал сигнал. Сигнал может быть именем или номером
сигнала. Например, во многих системахsignal 2иsignal—два способа подать сигнал прерывания.
SIGINT
Наоборот, если сигнал является нулем, выполнение продолжается без
подачи сигнала. Это полезно, если ваша программа остановилась из-за
сигнала и в обычном случае увидит его при возобновлении выполнения командой
continue; `signal 0′ продолжит выполнение без сигнала.
signalне повторяется, когда вы нажимаете RET второй раз
после выполнения команды.
Вызов команды signal отличается от вызова утилиты kill из
оболочки. Подача сигнала посредством kill заставляет
GDB решать, что делать с сигналом, в зависимости от таблиц
обработки сигналов (see section Сигналы). Команда signal передает
сигнал непосредственно вашей программе.
Возврат из функции
returnreturn выражение-
Вы можете отменить выполнение вызова функции с помощью команды
return.
Если вы задаете параметр выражение, его значение используется
в качестве возвращаемого значения.
Когда вы используете return, GDB уничтожает выбранный
кадр стека (и все кадры внутри него). Вы можете считать это
преждевременным возвратом из уничтоженного кадра. Если вы хотите
указать возвращаемое значение, задайте его в качестве аргумента к
return.
Это выталкивает выбранный кадр стека (see section Выбор кадра)
и все другие кадры внутри него, оставляя самым внутренним кадр, из
которого произошел вызов. Этот кадр становится выбранным. Указанное
значение сохраняется в регистрах, используемых для возвращаемых функцией
значений.
Команда return не возобновляет выполнение; она оставляет
программу остановленной в том состоянии, в котором бы она была сразу
после возврата из функции. Напротив, команда finish
(see section Продолжение и выполнение по шагам) возобновляет выполнение до естественного возврата из
выбранного кадра стека.
Вызов функций программы
call выраж-
Вычислить выражение выраж без отображения пустых (
void)
возвращенных значений.
Вы можете использовать этот вариант команды print, если хотите
выполнить функцию из вашей программы, не засоряя вывод пустыми возвращенными
значениями. Если результат не пустой, он выводится и
сохраняется в истории значений.
Для A29K, устанавливаемая пользователем переменная
call_scratch_address задает положение рабочей области, которая
будет использоваться, когда GDB вызывает функцию на целевой машине.
Это необходимо, так как обычный метод размещения рабочей области в стеке
не работает в системах с раздельными областями команд и данных.
Внесение изменений в программу
По умолчанию, GDB открывает файл, содержащий исполняемый код вашей
программы (или файл дампа памяти), в режиме только для чтения. Это
предотвращает случайные изменения машинного кода; но это также предотвращает
и преднамеренное исправление двоичного файла вашей программы.
Если вы хотите иметь возможность исправлять двоичный код, вы можете
указать это явно с помощью команды set write. Например, вы
можете захотеть установить внутренние флаги отладки или даже сделать
аварийные исправления.
set write onset write off-
Если вы установите `set write on’, GDB открывает исполняемые
файлы и файлы дампов памяти в режиме для чтения и записи; если вы
укажете `set write off’ (устанавливается по умолчанию), GDB
открывает их в режиме только для чтения.
Если вы уже загрузили файл, то после установкиset writeвам
необходимо загрузить его снова (используя командыexec-fileили
core-file), чтобы новые установки вступили в силу. show write-
Показать, открыты исполняемые файлы и файлы дампов памяти для
записи или нет.
Файлы GDB
GDB должен знать имя файла программы, которая будет
отлаживаться, чтобы прочитать его таблицу символов и чтобы запустить его.
Для отладки дампа памяти от предыдущего выполнения, вы также
должны сообщить GDB имя этого файла.
Команды для задания файлов
Вы можете указать имена исполняемого файла и файла дампа памяти.
Обычно это делается во время вызова GDB, используя
параметры с командами запуска GDB (see section Вход и выход из GDB).
Иногда во время сеанса GDB необходимо перейти к другому файлу.
Или вы можете запустить GDB и забыть указать файл, который
хотите использовать. В этих ситуациях полезны команды GDB для
задания новых файлов.
file имя-файла-
Использовать имя-файла в качестве программы для отладки. Из нее
читаются символы и содержание неизменяемой памяти.
Также она является программой, которая выполняется при
использовании командыrun. Если вы не укажете каталог, и файл
не будет найден в рабочем катологе GDB, он использует переменную
средыPATHв качестве списка каталогов для поиска, точно так
же, как это делает оболочка, когда ищет программу для выполнения.
Используя командуpath, вы можете изменить значение этой
переменной как для GDB, так и для вашей программы.
В системах с отображаемыми в память файлами, информация из таблицы
символов для имя-файла может храниться во вспомогательном файле
`имя-файла.syms'. Если это так, GDB осуществляет
отображение таблицы символов из`имя-файла.syms', запускаясь
намного быстрее. Смотрите описания ключей файлов `-mapped’ и
`-readnow’ (доступных с командной строки и в командах
file,symbol-fileилиadd-symbol-file, описанных
ниже), для получения большей информации. file-
fileбез параметров велит GDB уничтожить любую имеющуюся
информацию как об исполняемом файле, так и о таблице символов. exec-file [ имя-файла ]-
Указывает, что программа, которая должна быть выполнена (но не
таблица символов), находится в имя-файла. Если необходимо,
GDB ищет вашу программу с помощью переменной среды
PATH. Отсутствие имя-файла означает, что необходимо
уничтожить информацию о выполняемом файле. symbol-file [ имя-файла ]-
Читать информацию таблицы символов из файла имя-файла. При
необходимости производится поиск с помощью переменной среды
PATH. Для получения таблицы символов и исполняемой программы из
одного и того же файла, используйте командуfile.
symbol-fileбез параметров сбрасывает информацию GDB о
таблице символов вашей программы.
Командаsymbol-fileвелит GDB забыть содержимое своих
вспомогательных переменных, историю значений и все точки останова и выражения
автоматического отображения, так как они могут содержать указатели
на внутренние данные, хранящие символы и типы данных, которые
являются частью данных старой таблицы символов, уничтоженной внутри
GDB.
symbol-fileне повторяется, если вы снова нажимаете RET
после первого выполнения.
Когда GDB сконфигурирован для определенной среды, он распознает
отладочную информацию в том формате, который обычно генерируется
для этой среды; вы можете использовать или компилятор GNU, или другие
компиляторы, которые придерживаются местных соглашений. Наилучшие
результаты обычно достигаются с помощью компилятора GNU;
например, используяgcc, вы можете создавать отладочную
информацию для оптимизированного кода.
Для большинства типов объектных файлов, за исключением старых систем
SVR3, использующих COFF, командаsymbol-fileобычно не считывает
таблицу символов сразу целиком. Вместо этого, она быстро сканирует
ее для определения, какие исходные файлы и символы в ней
присутствуют. Детали читаются позже, по одному исходному файлу за раз,
по мере необходимости.
Такая стратегия чтения в две стадии используется для того, чтобы
GDB вызывался быстрее. За исключением редких пауз, чтение
деталей таблицы символов для конкретного исходного файла в большинстве
случаев практически незаметно. (Командаset verbose
позволяет при желании превратить эти паузы в сообщения.
See section Необязательные предупреждения и сообщения.)
Мы еще не реализовали двухступенчатую стратегию чтения для COFF. Когда
таблица символов сохранена в формате COFF,symbol-fileсчитывает данные
таблицы символов сразу полностью. Заметьте, что «stabs-in-COFF» все
же реализует двухступенчатую стратегию, так как отладочная информация
реально хранится в формате stabs. symbol-file имя-файла [ -readnow ] [ -mapped ]file имя-файла [ -readnow ] [ -mapped ]-
Если вы хотите быть уверены, что у GDB есть вся таблица
символов целиком, вы можете отменить двухступенчатую стратегию чтения
таблицы символов, используя параметр `-readnow’ с любой
командой, загружающей информацию таблицы символов.
Если отображаемые в память файлы доступны в вашей системе через
системный вызовmmap, вы можете использовать другой параметр,
`-mapped’, чтобы GDB записывал символы для вашей программы
в файл многократного использования. Последующие сеансы отладки
GDB отображают информацию о символах из этого вспомогательного
файла (если программа не изменилась), вместо того, чтобы
тратить время на чтение таблицы символов из исполняемой программы.
Использование параметра `-mapped’ производит такой же эффект, как
вызов GDB с ключем командной строки `-mapped’.
Вы можете использовать оба параметра вместе, чтобы быть уверенным,
что вспомогательный файл символов содержит всю информацию о символах
вашей программы.
Вспомогательный файл символов для программы myprog называется
`myprog.syms’. Если этот файл существует (и создан позже,
чем соответствующая исполняемая программа), GDB всегда пытается
использовать его при отладке myprog; не требуется никаких
специальных ключей или команд.
Файл`.syms'является специфичным для рабочей машины, на которой вы
вызываете GDB. Он содержит точный образ внутренней таблицы
символов GDB. Он не может быть использован одновременно на
разных рабочих платформах. core-file [ имя-файла ]-
Определяет местонахождение файла дампа памяти, который будет использован
как «содержимое памяти». Обычно файлы дампов памяти содержат только
некоторые части адресного пространства процесса, создавшего их;
GDB может обращаться к исполняемому файлу за другими частями.
core-fileбез параметра указывает, что файл дампа памяти
использоваться не должен.
Обратите внимание, что файл дампа памяти игнорируется, если в данное
время ваша программа выполняется под управлением GDB. Так что
если вы выполняли программу, и желаете вместо этого отладить файл
дампа, вы должны убить подпроцесс, в котором выполняется ваша программа.
Для этого используйте командуkill(see section Уничтожение дочернего процесса). add-symbol-file имя-файла адресadd-symbol-file имя-файла адрес [ -readnow ] [ -mapped ]add-symbol-file имя-файла -sраздел адрес-
Команда
add-symbol-fileсчитывает дополнительную информацию
таблицы символов из файла имя-файла. Вы должны использовать эту
команду, если файл имя-файла был динамически загружен (другими
средствами) в выполняющуюся программу. Адрес должен быть адресом
памяти, по которому был загружен файл; GDB сам его определить
не может. Вы можете указать дополнительно произвольное количество пар
`-s раздел адрес‘, чтобы явно указать имя раздела и
базовый адрес для него. Вы можете указать произвольный адрес как
выражение.
Таблица символов из файла имя-файла добавляется к таблице,
изначально считанной по командеsymbol-file. Вы можете
использовать командуadd-symbol-fileпроизвольное число раз;
прочитанные таким образом символьные данные добавляются к старым. Чтобы
уничтожить все старые данные, используйте командуsymbol-fileбез
аргументов.
Командаadd-symbol-fileне повторяется, если вы нажимаете
RET после ее использования.
Чтобы изменить способ обработки GDB таблицы символов для
имя-файла, вы можете использовать параметры `-mapped’ и
`-readnow’ так же, как и с командойsymbol-file. add-shared-symbol-file-
Команда
add-shared-symbol-fileможет быть использована только для
Motorola 88k в операционной системе Harris CXUX. GDB
ищет разделяемые библиотеки автоматически, однако, если он не находит
ваших, вы можете выполнитьadd-shared-symbol-file. Эта команда
не имеет аргументов. section-
Команда
sectionизменяет базовый адрес раздела раздел
выполняемого файла в адрес. Это может быть использовано, если
выполняемый файл не содержит адресов разделов, (что имеет место для
формата a.out), или когда адреса, указанные в самом файле, неверны.
Каждый раздел должен изменяться отдельно. Командаinfo files,
описанная ниже, перечисляет все разделы и их адреса. info filesinfo target-
Команды
info filesиinfo targetявляются синонимами; они обе
выводят текущую цель (see section Определение отладочной цели), включая имена выполняемого файла и файла дампа памяти, используемых
GDB, и файлов, из которых были загружены символы. Команда
help targetвыводит все возможные цели, а не только текущую.
Все команды для задания файлов допускают в качестве аргументов как
абсолютные, так и относительные имена файлов. GDB всегда
преобразовывает имя файла к абсолютному и запоминает его в таком виде.
GDB поддерживает разделяемые библиотеки на HP-UX, SunOS, SVr4,
Irix 5 и IBM RS/6000.
Когда вы даете команду run, или когда исследуете
файл дампа памяти, GDB автоматически загружает определения
символов из разделяемых библиотек. (Однако, если вы не отлаживаете файл дампа,
GDB не понимает ссылки на функции из разделяемой библиотеки до
того, как вы выполните команду run.)
На HP-UX, если программа загружает разделяемую библиотеку явно,
GDB автоматически загружает символы в момент вызова
shl_load.
info shareinfo sharedlibrary- Вывести имена разделяемых библиотек, загруженных в данный момент.
sharedlibrary рег-вырshare рег-выр-
Загрузить символы разделяемых библиотек объектов для файлов,
удовлетворяющих регулярному выражению Unix. Также как и для
автоматически загруженных файлов, это загружает только разделяемые
библиотеки, требуемые вашей программой для файла дампа памяти или после
вводаrun. Если рег-выр опущено, загружаются все разделяемые
библиотеки, требуемые вашей программой.
В системах HP-UX, GDB сам определяет загрузку разделяемой
библиотеки и автоматически считывает символы из нее, до некоторого
изначально установленного порогового значения, которое вы можете при
желании изменить.
После этого порогового значения, символы из разделяемых библиотек должны
загружаться явно. Для загрузки этих символов, используйте команду
sharedlibrary имя-файла. Базовый адрес разделяемой
библиотеки определяется GDB автоматически и вы не
должны его задавать.
Для отображения или установки порогового значения, используйте следующие
команды:
set auto-solib-add порог-
Устанавливает размер порога автоматической загрузки в мегабайтах. Если
порог ненулевой, символы из всех библиотек разделяемых объектов
будут загружаться автоматически, когда программа начинает выполнение или
когда динамический компоновщик информирует GDB о том, что
была загружена новая библиотека, до тех пор, пока таблица символов программы и
библиотек не превысит этот порог. В противном случае, символы должны
загружаться вручную, при помощи командыsharedlibrary. По
умолчанию, порог равен 100 мегабайтам. show auto-solib-add- Отобразить величину текущего порога автоматической загрузки в мегабайтах.
Ошибки чтения файлов с символами
При чтении файла символов, GDB иногда сталкивается с такими
проблемами, как типы символов, которые он не распознает, или известные
ошибки вывода компилятора. По умолчанию, GDB не сообщает вам о таких
проблемах, так как они сравнительно общие и прежде всего представляют
интерес для людей, занимающихся отладкой компиляторов. Если вам интересна
информация о плохо созданных таблицах символов, вы можете запросить
GDB печатать только одно сообщение по каждому типу проблем,
независимо от того, сколько раз проблема появляется; или вы можете
попросить GDB напечатать больше сообщений, чтобы увидеть, сколько раз
проблема встречалась, командой set complaints
(see section Необязательные предупреждения и сообщения).
Печатаемые сообщения и их значения, включают:
inner block not inside outer block in символ-
Информация о символах показывает, где области символов начинаются и
заканчиваются (например, в начале функции или блока операторов). Эта
ошибка указывает на то, что внутренний блок видимости не содержится
целиком во внешнем.
GDB обходит проблему, рассматривая внутренний блок так, как если
бы он имел такую же область видимости, что и внешний. Если внешний блок
не является функцией, в данном сообщении символ может быть
показан как «(don't known)«. block at адрес out of order-
Символьная информация для блоков символьных областей должна
появляться в порядке увеличения адресов. Данная ошибка указывает, что это
не так.
GDB не решает этой проблемы, и у него возникают трудности при
определении местоположения символов в исходном файле, символы которого
он считывает. (Вы часто можете определить имя поврежденного исходного
файла, указавset verbose on. See section Необязательные предупреждения и сообщения.) bad block start address patched-
Символьная информация для блоков символьных областей имеет меньший
начальный адрес, чем у предшествующей строки исходного текста.
Известно, что это происходит в компиляторе Си SunOS 4.1.1 (и более
ранних версиях).
GDB обходит проблему, обрабатывая блок символьной области как
начинающийся с предыдущей исходной строки. bad string table offset in symbol n-
Символ с номером n содержит указатель на таблицу строк, который
превосходит размер таблицы.
GDB обходит проблему, считая, что символ имеет имяfoo,
что может вызвать другие проблемы, если много символов
заканчиваются этим именем. unknown symbol type 0xnn-
Символьная информация содержит новые типы данных, которые GDB еще
не знает, как считывать.0xnn—это тип символа неверно
истолкованной информации, в шестнадцатеричном виде.
GDB обходит ошибку, игнорируя эту символьную информацию. Это
обычно позволяет вам отладживать программу, хотя некоторые
символы и недоступны. Если вы столкнетесь с такой проблемой и
желаете ее отладить, вы можете отладитьgdbс помощью
него же, установив точку останова наcomplain, затем дойти до
функцииread_dbx_symtabи исследовать*bufp, чтобы
увидеть символ. stub type has NULL name- GDB не может найти полное определение для структуры или класса.
const/volatile indicator missing (ok if using g++ v1.x), got...-
В символьной информации для функции-члена Си++ пропущена
некоторая информация, которую последние версии компилятора должны
для нее выводить. info mismatch between compiler and debugger- GDB не может разобрать спецификации типа, выведенной компилятором.
Определение отладочной цели
Цель—это среда выполнения, занятая вашей программой.
Часто GDB выполняется в той же рабочей среде, что и ваша
программа; в этом случае, отладочная цель задается неявно в момент
использования команд file или core. Когда вам нужна
большая гибкость—например, выполнение GDB на другой машине, или
управление автономной системой через последовательный порт или системой
реального времени через соединение TCP/IP—вы можете использовать
команду target для определения цели одного из типов,
сконфигурированных для GDB (see section Команды для управления целями).
Активные цели
Существует три класса целей: процессы, файлы дампов памяти и
выполняемые файлы. GDB может обрабатывать одновременно до трех
активных целей, по одной в каждом классе. Это позволяет вам (например)
запустить процесс и проверять его действия, не прерывая вашу работу над
файлом дампа.
Например, если вы выполняете `gdb a.out’, то исполняемый файл
a.out является единственной активной целью. Если вы назначите также
файл дампа—возможно от предыдущего выполнения, завершившегося ошибкой
и создавшего дамп—
тогда GDB имеет две активные цели и использует их вместе,
просматривая сначала файл дампа, а затем исполняемый файл, для выполнения
запросов к адресам памяти. (Обычно эти два класса целей дополняют друг
друга, так как файлы дампа памяти содержит только память программы,
доступную для чтения и записи
(переменные и тому подобное), и машинное состояние, в то время как исполняемый
файлы содержат только текст программы и инициализированные данные.)
Когда вы вводите run, ваш исполняемый файл становится также активным
целевым процессом. Когда целевой процесс активен, все команды GDB,
запрашивающие адреса памяти, относятся к этой цели; адреса в активной
цели файла дампа или выполняемого файла неизвестны, пока активен
целевой процесс.
Используйте команды core-file и exec-file для выбора новой
цели файла дампа памяти или выполняемого файла (see section Команды для задания файлов). Для определения в качестве цели
процесса, который уже выполняется, используйте команду attach
(see section Отладка запущенного ранее процесса).
Команды для управления целями
target тип параметры-
Соединяет рабочую среду GDB с целевой машиной или процессом.
Целью обычно является протокол для взаимодействия со средствами отладки.
Параметр тип используется, чтобы определить тип или протокол
целевой машины.
Дальнейшие параметры интерпретируются целевым
протоколом, но обычно включают такие вещи, как имена
устройств или имена рабочих машин, с которыми осуществляется
связь, номера процессов и скорости в бодах.
Командаtargetне повторяется при повторном нажатии RET после
ее выполнения. help target-
Отображает имена всех доступных целей. Чтобы отобразить выбранные в
данный момент цели, используйте либоinfo target, либоinfo(see section Команды для задания файлов).
files help target имя-
Описывает определенную цель, включая любые параметры, необходимые для ее
выбора. set gnutarget арг-
GDB использует свою собственную библиотеку BFD(14) для чтения ваших
файлов. GDB знает, читает ли он выполняемый файл,
файл дампа памяти или объектный (.o) файл; однако вы можете
определить формат файла командойset gnutarget. В отличие от
большинства командtarget, сgnutarget, командаtarget
относится к программе, а не к машине.Предупреждение: Для определения формата файла посредством
set, вы должны знать фактическое имя BFD.
gnutargetSee section Команды для задания файлов.
show gnutarget-
Используйте команду
show gnutargetдля отображения, какого
формата файлыgnutargetустановлен считывать. Если вы не
установилиgnutarget, GDB определит формат для каждого файла
автоматически, иshow gnutargetвыведет `The current BFD target
is «auto»‘.
Ниже приведены некоторые наиболее распространенные цели (доступные или нет, в
зависимоси от конфигурации GDB):
target exec программа-
Выполняемый файл. `target exec программа‘ то же самое, что и
`exec-file программа‘. target core имя-файла-
Файл дампа памяти. `target core имя-файла‘ то же самое, что и
`core-file имя-файла‘. target remote устр-
Удаленная последовательная цель является уникальным для GDB
протоколом. Параметр устр определяет, какое последовательное
устройство использовать для соединения (например,`/dev/ttya').
See section Удаленная отладка.target remote
поддерживает командуload. Это полезно, только если вы можете
получить заглушку для целевой системы каким-нибудь другим
способом и можете разместить ее в памяти, где она не будет
затерта загрузкой. target sim-
Встроенный эмулятор ЦП. GDB включает эмуляторы для большинства
архитектур. Вообще,target sim load runработает; однако, вы не можете предположить, что доступны определенное
отображение памяти, драйверы устройств, или даже основные функции
ввода-вывода, хотя некоторые эмуляторы действительно предоставляют это. Для
информации о деталях эмуляторов для конкретного процессора, смотрите
соответствующий section Встроенные процессоры.
Некоторые конфигурации могут также включать такие цели:
target nrom устр-
Эмулятор NetROM ROM. Эта цель поддерживает только загрузку.
Для различных конфигураций GDB доступны различные цели; ваша
конфигурация может иметь больше или меньше целей.
Многие удаленные цели требуют, чтобы вы загрузили код выполняемого
файла, после того как вы успешно установили соединение.
load имя-файла-
В зависимости от того, какие возможности удаленной отладки
сконфигурированы в GDB, может быть доступна команда
load. Если она существует, ее задачей является сделать
имя-файла (выполняемый файл) доступным для отладки на удаленной
системе—например, путем загрузки или динамической сборки.
loadтакже записывает таблицу символов имя-файла в
GDB, как командаadd-symbol-file.
Если ваш GDB не имеет командыload, попытка выполнить ее
выдает сообщение об ошибке «You can't do that when your«.
target is ...
Файл загружается по адресу, указанному в выполняемом файле. Для
некоторых форматов объектных файлов, вы можете задать адрес загрузки при
сборке программы; для других форматов, таких как a.out, формат
объектного файла задает фиксированный адрес.
loadне повторяется, если вы нажимаете RET снова после ее
использования.
Выбор целевого порядка байтов
Некоторые типы процессоров, такие как MIPS, PowerPC и Hitachi SH,
предоставляют возможность выполнения либо с порядком байтов от старшего,
либо с порядком байтов от младшего. Обычно, выполняемый файл или
символы содержат информацию для определения используемого порядка
байтов, и вам не нужно об этом заботиться. Однако, иногда вам все же
может пригодиться вручную изменить порядок байтов процессора,
определенный GDB.
set endian big-
Велит GDB считать, что целевой порядок байтов от старшего.
set endian little- Велит GDB считать, что целевой порядок байтов от младшего.
set endian auto-
Велит GDB использовать порядок байтов, указанный в выполняемом
файле. show endian- Отображает текущую установку GDB для целевого порядка байтов.
Заметьте, что эти команды управляют только интерпретацией символьных
данных в рабочей системе, и они совершенно не оказывают действия на
целевую систему.
Удаленная отладка
Если вы пытаетесь отлаживать программу, выполняющуюся на машине,
которая не может запустить GDB обычным способом, часто бывает полезна
удаленная отладка. Например, вы можете использовать удаленную
отладку для ядра операционной системы или для малой системы, которая не
имеет достаточно мощной операционной системы общего назначения для
вызова отладчика со всеми возможностями.
Некоторые конфигурации GDB имеют специальный последовательный или
TCP/IP интерфейсы для того, чтобы это работало с конкретными отладочными
целями. Кроме того, GDB распространяется с общим
последовательным протоколом (уникальным для GDB, но не для
конкретной целевой системы), который вы можете использовать, если пишете
удаленные заглушки—код, выполняемый в удаленной системе для связи с
GDB.
В вашей конфигурации GDB могут быть доступны другие удаленные
цели; используете help target, чтобы их перечислить.
Удаленный последовательный протокол GDB
Для отладки программы, выполняемой на другой машине (отладочной
целевой машине), вы сперва должны создать все обычные
предпосылки для самостоятельного выполнения программы. Например, для
программы на Си вам нужны:
-
Процедура запуска для установки среды выполнения Си; она обычно
имеет имя типа`crt0'. Процедура запуска может быть
обеспечена вашими аппаратными средствами, или вы должны
написать свою собственную. -
Библиотека подпрограмм Си для поддержки вызовов подпрограмм вашей
программы, особенно для управления вводом и выводом. -
Способ установки вашей программы на другую машину—например,
программа загрузки. Такие программы часто предоставляются поставщиками
аппаратных средств, но вам может потребоваться написать вашу
собственную, пользуясь документацией к аппаратному обеспечению.
Следующим шагом будет принятие мер по использованию вашей
программой последовательного порта для связи с машиной, где
выполняется GDB (рабочей машиной). В общих чертах, схема
выглядит следующим образом:
- На рабочей машине
-
GDB уже понимает, как использовать этот протокол; после установки
всего остального, вы можете просто использовать
команду `target remote’ (see section Определение отладочной цели). - На целевой машине
-
вы должны скомпоновать вместе с вашей программой несколько подпрограмм
специального назначения, которые реализуют удаленный последовательный
протокол GDB. Файл, содержащий эти подпрограммы, называется
отладочной заглушкой.
На некоторых удаленных целях, вы можете использовать вспомогательную
программуgdbserverвместо компоновки заглушки вместе с вашей
программой. See section Использование программыgdbserver,
для детального изучения.
Отладочная заглушка специфична для архитектуры удаленной машины;
например, используйте `sparc-stub.c' для отладки программ на
машинах SPARC.
Следующие работающие удаленные заглушки распространяются вместе с GDB:
i386-stub.c-
Для Intel 386 и совместимых архитектур.
m68k-stub.c-
Для архитектур Motorola 680×0.
sh-stub.c-
Для архитектур Hitachi SH.
sparc-stub.c-
Для архитектур SPARC.
sparcl-stub.c-
Для архитектур Fujitsu SPACRLITE.
Файл `README' в поставке GDB может содержать другие
недавно добавленные заглушки.
Что заглушка может сделать для вас
Отладочная заглушка для вашей архитектуры содержит следующие
три подпрограммы:
set_debug_traps-
Когда ваша программа останавливается, эта подпрограмма организует
выполнениеhandle_exception. Вы должны явно вызвать эту
подпрограмму в начале вашей программы. handle_exception-
Это главная рабочая лошадка, но ваша программа никогда не вызывает ее
явно—установочный код организует запускhandle_exception, когда
вызывается ловушка.
handle_exceptionполучает управление, когда ваша программа
останавливается во время выполнения (например, в точке останова), и
организует связь с GDB на рабочей машине. Именно здесь
реализуется протокол связи;handle_exceptionдействует как
представитель GDB на целевой машине. Сперва она посылает
суммарную информацию о состоянии вашей программы, затем продолжает
выполняться, извлекая и передавая любую информацию, требующуюся
GDB, пока вы не выполните команду GDB, возобновляющую
выполнение вашей программы; в этом местеhandle_exception
возвращает управление вашему коду на целевой машине. breakpoint-
Используйте эту вспомогательную подпрограмму для установки в вашей
программе точек останова. В зависимости от конкретной ситуации, это
может быть единственным способом для GDB получить управление.
Например, если ваша целевая машина имеет некую клавишу прерывания, вам
не нужно вызывать эту подпрограмму; нажатие клавиши прерывания передаст
управлениеhandle_exception—в действительности, GDB.
На некоторых машинах простое получение символов на последовательный порт
может также вызвать ловушку; опять, в этой ситуации вам не нужно вызывать
breakpointиз вашей программы—простое выполнение `target
remote’ из рабочего сеанса GDB передаст управление.
Вызывайтеbreakpoint, если ни одно из этих предположений не верно,
или вы просто хотите быть уверенным, что ваша программа остановится в
предопределенной точке от начала вашего сеанса отладки.
Что вы должны сделать для заглушки
Отладочные заглушки, поставляемые с GDB, ориентированы на
микропроцессоры определенной архитектуры, но они не имеют информации
об остальной части вашей целевой отладочной машины.
В первую очередь, вам нужно сообщить заглушке, как связаться с
последовательным портом.
int getDebugChar()-
Напишите эту подпрограмму для чтения одного символа из
последовательного порта. Она может быть идентичнаgetcharдля
вашей целевой системы; разные имена используются, чтобы позволить
вам их различать, если вы этого хотите. void putDebugChar(int)-
Напишите эту подпрограмму для записи одного символа в
последовательный порт. Она может быть идентичнаputcharдля
вашей целевой системы; разные имена используются, чтобы позволить
вам их различать, если вы этого хотите.
Если вы хотите, чтобы GDB мог остановить вашу программу во
время ее выполнения, вам нужно использовать управляемый прерываниями
последовательный драйвер и настроить его для остановки при получении
^C (`03′, символ control-C). Это тот символ, который
GDB использует для указания удаленной системе остановиться.
Указание отладочной цели вернуть GDB правильный статус,
вероятно, требует изменений стандартной заглушки; один быстрый и
неаккуратный способ состоит в выполнении лишь инструкции точки останова
(«неаккуратность» состоит в том, что GDB выдает
SIGTRAP вместо SIGINT).
Вот другие процедуры, которые вы должны обеспечить:
void exceptionHandler (int номер-исключения, void *адрес-исключения)-
Напишите эту функцию для установки адреса-исключения в таблицы
обработки исключительных ситуаций. Вам нужно сделать это, потому
что у заглушки нет способа узнать, как устроены таблицы обработки
исключений в вашей целевой системе (например, процессорная
таблица может быть в пзу, и содержать элементы, указывающие на
таблицу в озу). Номер-исключения—это номер исключительной
ситуации, которая должна быть изменена; его значение зависит от
архитектуры (например, различные номера могут представлять
деление на ноль, доступ с нарушением выравнивания, и так далее). Когда
это исключение возникает, управление должно быть передано
непосредственно адресу-исключения, и процессорное
состояние (стек, регистры и так далее) должно быть таким же, как
во время возникновения процессорного исключения. Так что если вы хотите
использовать инструкцию перехода для достижения адреса-исключения,
это должен быть простой переход, не переход к подпрограмме.
Для 386, адрес-исключения должен быть установлен как обработчик
затвора вызова
прерывания, чтобы во время его выполнения остальные прерывания маскировались.
Он должен иметь уровень полномочий 0 (наибольшие полномочия). Заглушки
SPARC и 68k могут маскировать прерывания самостоятельно без помощи
exceptionHandler. void flush_i_cache()-
Только для SPARC и SPARCLITE. Напишите эту попрограмму для
очистки кеша инструкций, если он есть, на вашей целевой машине.
Если кеша инструкций нет, эта подпрограмма может ничего не делать.
На целевых машинах, имеющих кеш инструкций, GDB требует эту
функцию, чтобы удостовериться, что состояние вашей программы
стабильное.
Вы должны также удостовериться, что эта библиотечная процедура доступна:
void *memset(void *, int, int)-
Это стандартная библиотечная функция
memset, которая
устанавливает область памяти в заданное значение. Если вы имеете
одну из свободных версийlibc.a,memsetможет быть найдена
там; иначе вы должны или получить ее от изготовителя аппаратного
обеспечения, или написать свою собственную.
Если вы не используете компилятор GNU Си, вам также могут
понадобиться другие стандартные библиотечные подпрограммы; это
меняется от одной заглушки к другой, но в общем, заглушки
часто используют различные общие библиотечные подпрограммы, которые
gcc генерирует как встроенный код.
Собираем все вместе
Вкратце, когда ваша программа готова к отладке, вы должны проделать
следующие шаги.
-
Убедитесь, что вы определили поддерживающие процедуры низкого уровня
(see section Что вы должны сделать для заглушки):getDebugChar,putDebugChar,flush_i_cache,memset,exceptionHandler. -
Вставьте следующие строки в начале вашей программы:
set_debug_traps(); breakpoint();
-
Для заглушки 680×0, вы должны предоставить переменную
exceptionHook. Обычно вы используете просто:void (*exceptionHook)() = 0;
если до вызова
set_debug_trapsвы установили ее для
указания на функцию в вашей программе. Эта функция вызывается, когда
GDB продолжает выполнение после останова на ловушке (например,
ошибка шины).
Функция, указаннаяexceptionHook, вызывается с одним
параметром типаint, который является номером исключения. -
Откомпилируйте и скомпонуйте вместе: вашу программу, отладочную
заглушку GDB для вашей целевой архитектуры и
подпрограммы поддержки. -
Убедитесь, что у вас есть последовательное соединение между вашей целевой
и рабочей машинами, и идентифицируйте последовательный порт на
рабочей машине. -
Загрузите вашу программу на целевую машину (или поместите ее туда
любыми средствами, предоставляемыми производителем) и запустите ее. -
Для начала удаленной отладки, запустите GDB на рабочей машине
и укажите в качестве выполняемого файла программу, которая выполняется
на удаленной машине. Это сообщает GDB, как найти символы и
содержание неизменяемых областей вашей программы. -
Установите связь, используя команду
target remote. Ее
аргументы определяют, как взаимодействовать с целевой машиной—
либо через устройство, подключенное к последовательной линии,
либо через порт TCP (обычно подключенный к терминальному серверу, который,
в свою очередь, имеет последовательную линию до цели). Например,
чтобы использовать последовательную линию, присоединенную к устройству
`/dev/ttyb', выполните:target remote /dev/ttyb
Чтобы использовать TCP-соединение, используйте аргумент в форме
машина:порт. Например, для соединения с портом 2828 на
терминальном сервереmanyfarms:target remote manyfarms:2828
Теперь вы можете использовать все обычные команды для исследования и изменения
данных, пошагового выполнения и продолжения исполнения удаленной
программы.
Для возобновления выполнения удаленной программы и прекращения ее
отладки, используйте команду detach.
Всякий раз, когда GDB ожидает удаленную программу, если вы вводите
символ прерывания (часто C-C), GDB пытается остановить
программу. Это может привести или не привести к успеху, частично в
зависимости от аппаратных средств и последовательных драйверов, которые
использует удаленная система. Если вы снова введете символ прерывания,
GDB выведет такое приглашение:
Interrupted while waiting for the program. Give up (and stop debugging it)? (y or n)
Если вы введете y, GDB прекратит сеанс удаленной отладки.
(Если вы решите позже, что хотите попытаться снова, вы можете вновь
использовать target remote, чтобы соединиться еще раз.) Если вы
введете n, GDB вернется к ожиданию.
Коммуникационный протокол
Файлы заглушек, поставляемые с GDB, реализуют коммуникационный
протокол со стороны целевой машины, а со стороны GDB он
реализуется в исходном файле GDB `remote.c'. Обычно вы
можете просто позволить этим программам взаимодействовать, и
не вдаваться в детали. (Если вы разрабатываете свой собственный файл
заглушки, вы также можете игнорировать детали: начните с одного из
существующих файлов заглушки. `sparc-stub.c' организован наилучшим
образом, и потому его легче всего читать.)
Однако, бывают случаи, когда вам необходимо что-нибудь знать о
протоколе—например, если существует только один последовательный порт
на вашей целевой машине, вы можете захотеть, чтобы ваша программа делала
что-нибудь особенное, если она распознает предназначенный для GDB
пакет.
В следующих примерах, `<-‘ и `->’ используются для обозначения
переданных и полученных данных соответственно.
Все команды и ответы GDB (не подтверждения),
посылаются в виде пакета. Пакет представлен символом `$’,
реальными данными-пакета завершающим символом `#’, за которым
следуют две цифры контрольной-суммы:
$данные-пакета#контрольная-сумма
Двухциферная контрольная-сумма вычисляется как сумма по модулю 256
всех символов между начальным `$’ и конечным `#’ (восьмибитная
беззнаковая контрольная сумма).
Разработчикам следует учесть, что до GDB версии 5.0
спецификация протокола также включала необязательный двухциферный
ид-последов:
$ид-последов:данные-пакета#контрольная-сумма
Этот ид-последов добавлялся к подтверждению.
GDB никогда не генерировал ид-последов.
Заглушки, занимающиеся обработкой пакетов, добавленные в GDB
начиная с версии 5.0, не должны принимать пакеты с
ид-последов.
Когда или рабочая, или целевая машина получает пакет, первым ожидаемым
ответом является подтверждение: или `+’ (для указания, что пакет
получен корректно), или `-‘ (чтобы запросить повторную передачу):
<-$данные-пакета#контрольная-сумма ->+
Рабочая машина (GDB) посылает команды, а целевая (отладочная
заглушка, включенная в вашу программу) посылает ответ. В случае
команд пошагового выполнения и продолжения, ответ посылается
только тогда, когда операция закончена (цель снова остановлена).
Данные-пакета состоят из последовательности знаков, за исключением
`#’ и `$’ (для дополнительных исключений, смотрите пакет
`X’).
Поля внутри пакета должны разделяться при помощи `,’, `;’ или
`:’. Если не оговорено противное, все числа представлены в
шестнадцатеричном виде без начальных нулей.
Разработчикам следует учесть, что до GDB версии 5.0, символ
`:’ не мог появляться третим символом в пакете (так как
потенциально это могло привести к конфликту с
ид-последов).
Ответ данные может быть закодированным с помощью кодирования
методом длины серий, чтобы
сохранить место. `*’ означает, что следующий символ является
ASCII-кодом, который означает количество повторений символа,
предшествующего `*’. Кодировкой является n+29, что дает печатный
знак для n >=3 (когда кодировка переменной длины дает
преимущества). Печатные знаки `$’, `#’, `+’, `-‘,
или с номерами, большими 126, использоваться не должны.
Некоторые удаленные системы использовали другой механизм кодировки с
переменной длиной, иногда называемый cisco-кодировкой. За `*’
следуют две шестнадцатеричные цифры, обозначающие размер пакета.
Итак:
"0* "
означает то же, что и «0000».
При ошибке, ответ, возвращаемый для некоторых пакетов, включает
двухсимвольный номер ошибки. Этот номер определен смутно.
Для любой команды, не поддерживаемой заглушкой, должен быть
возвращен пустой ответ (`$#00′). Таким образом, протокол можно
расширять. Новые версии GDB могут определить, поддерживается
ли пакет, основываясь на ответе.
От заглушки требуется поддержка команд `g’, `G’,
`m’, `M’, `c’ и `s’. Все остальные команды
являются необязательными.
Вот полный список всех определенных на данный момент команд, и
соответствующих им ответов данные:
| Пакет | Запрос | Описание |
| расширенные операции | !
|
Использовать расширенный удаленный протокол. Имеет постоянное действие—требует установки только один раз. Расширенный удаленный протокол поддерживает пакеты `R’. |
| ответ `’ |
Заглушки, поддерживающие расширенный удаленный протокол, возвращают `’, что, к сожалению, совпадает с ответом, возвращаемым заглушками, которые не поддерживают расширения протокола. |
|
| последний сигнал | ?
|
Указывает причину, по которой цель остановилась. Ответ такой же, как для пошагового выполнения и продолжения. |
| ответ | смотрите ниже | |
| зарезервировано | a
|
Зарезервировано для использования в будущем |
| установить аргументы программы (зарезервировано) | Aдлина-арг,число-арг,арг,...
|
|
|
В программу передается инициализированный массив `argv[]’. Длина-арг задает число байт в закодированном в шестнадцатеричный вид потоке байт арг. Смотрите `gdbserver' длядополнительной информации. |
||
ответ OK
|
||
ответ ENN
|
||
| установить скорость (не рекомендовано) | bбод
|
Установить скорость последовательной линии в бод. |
| установить точку останова (не рекомендовано) | Bадрес,режим
|
Установить (режим `S’) или удалить (режим `C’) точку останова по адресу адрес. Это было замещено пакетами `Z’ и `z’. |
| продолжить | cадрес
|
Адрес—это адрес для возобновления выполнения. Если он опущен, возобновить с текущего адреса. |
| ответ | смотрите ниже | |
| продолжить с сигналом | Cсиг;адрес
|
Продолжить с сигналом сиг (шестнадцатеричный номер сигнала). Если ` ;адрес‘ опущено, выполнение возобновляется с прежнегоадреса. |
| ответ | смотрите ниже | |
| переключить режим отладки (не рекомендовано) | d
|
переключить флаг отладки. |
| отсоединиться | D
|
Отсоединить GDB от удаленной системы. Посылается удаленной системе перед тем, как GDB отсоединится. |
| ответ нет ответа | GDB не ждет никакого ответа после посылки этого пакета. | |
| зарезервировано | e
|
Зарезервировано для использования в будущем |
| зарезервировано | E
|
Зарезервировано для использования в будущем |
| зарезервировано | f
|
Зарезервировано для использования в будущем |
| зарезервировано | F
|
Зарезервировано для использования в будущем |
| чтение регистров | g
|
Чтение регистров общего назначения. |
| ответ XX… |
Каждый байт данных регистра описывается двумя шестнадцатеричными цифрами. Они передаются с целевым порядком байтов. Размер каждого регистра и его позиция внутри пакета `g’ определяются внутренними макросами GDB REGISTER_RAW_SIZE и REGISTER_NAME. Спецификация нескольких стандартных пакетов `g’ приведена ниже. |
|
ENN
|
в случае ошибки. | |
| запись в регистры | GXX…
|
Смотрите `g’ для описания данных XX… . |
ответ OK
|
в случае успеха | |
ответ ENN
|
в случае ошибки | |
| зарезервировано | h
|
Зарезервировано для использования в будущем |
| выбрать нить | Hct…
|
Установить нить для последующих операций (`m’, `M’, `g’, `G’, и другие). c = `c’ для нитей, используемых при пошаговом выполнении и продолжении; t… может быть -1 для всех нитей. c = `g’ для нитей, используемых в других операциях. Если ноль—выбрать любую нить. |
ответ OK
|
в случае успеха | |
ответ ENN
|
в случае ошибки | |
| пошаговое выполнение по тактовому циклу (черновик) | iадрес,nnn
|
Выполнить один тактовый цикл на удаленной машине. Если ` ,nnn‘ указано, выполнить nnn циклов. Еслиуказан адрес, пошаговое выполнение по одному тактовому циклу начинается этого адреса. |
| сигнал, затем выполнение по тактовым циклам (зарезервировано) | I
|
Смотрите `i’ и `S’, там аналогичный синтаксис и семантика. |
| зарезервировано | j
|
Зарезервировано для использования в будущем |
| зарезервировано | J
|
Зарезервировано для использования в будущем |
| убить | k
|
FIXME: Нет описания, как действовать в случае, если был выбран контекст определенной нити (то есть `k’ убивает только эту нить?). |
| зарезервировано | l
|
Зарезервировано для использования в будущем |
| зарезервировано | L
|
Зарезервировано для использования в будущем |
| чтение памяти | mадрес,длина
|
Прочитать длину байт памяти, начиная с адреса адрес. Ни GDB, ни заглушка не предполагают, что передача области памяти происходит по адресам, выровненным по границе слова. FIXME: Нужен механизм передачи области памяти, выровненной по границе слова. |
| ответ XX… |
XX… представляет собой содержимое памяти. Может содержать меньше запрошенного числа байт, если удалось прочитать только часть данных. Ни GDB, ни заглушка не предполагают, что передача области памяти происходит по адресам, выровненным по границе слова. FIXME: Нужен механизм передачи области памяти, выровненной по границе слова. |
|
ответ ENN
|
NN представляет номер ошибки | |
| запись в память | Mадрес,длина:XX…
|
Записать длину байт памяти, начиная с адреса адрес. XX…—это данные. |
ответ OK
|
при успехе | |
ответ ENN
|
при ошибке (это включает случай, когда была записана только часть данных). |
|
| зарезервировано | n
|
Зарезервировано для использования в будущем |
| зарезервировано | N
|
Зарезервировано для использования в будущем |
| зарезервировано | o
|
Зарезервировано для использования в будущем |
| зарезервировано | O
|
Зарезервировано для использования в будущем |
| чтение регистров (зарезервировано) | pn…
|
Смотрите запись регистров. |
| возврат r…. | Значение регистра в целевом порядке байт, закодированное в шестнадцатеричном виде. |
|
| запись регистров | Pn…=r…
|
Записать в регистр n… значение r…, которое содержит две шестнадцатеричные цифры для каждого байта в регистре (целевой порядок байтов). |
ответ OK
|
в случае успеха | |
ответ ENN
|
при ошибке | |
| общий запрос | qзапрос
|
Запросить информацию о запросе. Вообще, запросы GDB имеют первую заглавную букву. Специальные запросы от производителей должны использовать приставку компании (из маленьких букв). Например: `qfsf.var’. За запросом может следовать необязательный список, разделенный `,’ или `;’. Заглушки должны проверять, что они производят сравнение с полным именем запроса. |
ответ XX...
|
Данные от запроса, закодированные шестнадцатеричными цифрами. Ответ не может быть пустым. |
|
ответ ENN
|
ответ при ошибке | |
| ответ `’ | Указывает на нераспознанный запрос. | |
| общая установка | Qперем=знач
|
Установить значение перем в знач. Смотрите `q’ для обсуждения соглашений, касающихся имен. |
| сброс (не рекомендовано) | r
|
Установка всей системы в исходное состояние. |
| удаленная перезагрузка | RXX
|
Перезапустить удаленный сервер. XX, где оно требуется, не имеет ясного определения. FIXME: Нужен пример взаимодействия, объясняющий как эти пакеты используются в расширенном удаленном режиме. |
| пошагавое выполнение | sадрес
|
Адрес—это адрес для возобновления выполнения. Если адрес опущен, возобновить выполнение с того же адреса. |
| ответ | смотрите ниже | |
| пошаговое выполнение с сигналом | Sсиг;адрес
|
Как C, но разница такая же, как между step иcontinue.
|
| ответ | смотрите ниже | |
| поиск | tадрес:PP,MM
|
Поиск в обратном направлении, начиная с адреса адрес, до совпадения с шаблоном PP и маской MM. PP и MM—4 байта. Адрес должен быть не менее трех цифр. |
| жива ли нить | TXX
|
Определить, жива ли нить XX. |
ответ OK
|
нить все еще жива | |
ответ ENN
|
нить мертва | |
| зарезервировано | u
|
Зарезервировано для использования в будущем |
| зарезервировано | U
|
Зарезервировано для использования в будущем |
| зарезервировано | v
|
Зарезервировано для использования в будущем |
| зарезервировано | V
|
Зарезервировано для использования в будущем |
| зарезервировано | w
|
Зарезервировано для использования в будущем |
| зарезервировано | W
|
Зарезервировано для использования в будущем |
| зарезервировано | x
|
Зарезервировано для использования в будущем |
| запись в память (двоичная) | Xадрес,длина:XX…
|
Адрес это адрес, длина это число байт, XX… это двоичные данные. Символы $, # и 0x7d экранируютсяс помощью 0x7d.
|
ответ OK
|
в случае успеха | |
ответ ENN
|
в случае ошибки | |
| зарезервировано | y
|
Зарезервировано для использования в будущем |
| зарезервировано | Y
|
Зарезервировано для использования в будущем |
| удалить точку останова или наблюдения (черновик) | zt,адрес,длина
|
Смотрите `Z’. |
| поместить точку останова или наблюдения (черновик) | Zt,адрес,длина
|
t представляет тип: `0′ в случае программной точки останова, `1′—аппаратная точка останова, `2′—точка наблюдения за записью, `3′—точка наблюдения за чтением, `4′—точка наблюдения за доступом; адрес—это адрес; длина задается в байтах. Для программной точки останова, длина задает размер инструкции, на которую надо поместить заплату. Для аппаратных точек останова и наблюдения, длина указывает размер области памяти для наблюдения. Чтобы избежать потенциальных проблем с повторными пакетами, операции должны быть идемпотентным образом. |
ответ ENN
|
в случае ошибки | |
ответ OK
|
в случае успеха | |
| `’ | Если не поддерживается. | |
| зарезервировано | <другое> | Зарезервировано для использования в будущем |
Пакеты `C’, `c’, `S’, `s’ и `?’ могут получить
в качестве ответа все нижеперечисленное. В случае пакетов `C’,
`c’, `S’ и `s’, этот ответ возвращается только тогда,
когда цель останавливается. Ниже, точное значение `номера сигнала’
определено нечетко. Вообще, используется одно из соглашений
UNIX о номерах сигналов.
SAA |
AA—это номер сигнала |
TAAn…:r…;n…:r…;n…:r…; |
AA = две шестнадцатеричные цифры номера сигнала; n… = (шестнадцатеричный) номер регистра, r… = содержимое регистра в целевом порядке байт, размер определяется REGISTER_RAW_SIZE;n… = `thread’, r… = идентификатор процесса нити, это шестнадцатеричное целое; n… = другая строка, не начинающаяся с шестнадцатеричной цифры. GDB должен игнорировать эту пару n…, r… и переходить к следующей. Таким образом мы можем расширять протокол. |
WAA |
Процесс завершается с кодом выхода AA. Это применимо только к определенным типам целей. |
XAA |
Процесс завершается с сигналом AA. |
NAA;t…;d…;b… (устарело) |
AA = номер сигнала; t… = адрес символа «_start»; d… = база раздела данных; b… = база раздела bss. Примечание: используется только целями Cisco Systems. Разница между этим ответом и запросом «qOffsets» заключается в том, что пакет ‘N’ может прибыть самопроизвольно, тогда как запрос ‘qOffsets’ инициируется рабочим отладчиком. |
OXX… |
XX…—шестнадцатеричное представление ASCII-данных. Это может произойти в любой момент, пока программа выполняется и отладчик должен продолжать ждать ‘W’, ‘T’, и т.п. |
Следующие пакеты для установок и запросов уже были определены.
| текущая нить | qC
|
Возвратить идентификатор текущей нити. |
ответ QCидент-проц
|
Где идент-проц—16-битный идентификатор процесса, представленный шестнадцатеричнами цифрами. |
|
| ответ * | Любой другой ответ подразумевает старый идентификатор процесса. | |
| идентификаторы всех нитей | qfThreadInfo
|
|
qsThreadInfo
|
Получить список идентификаторов активных нитей от целевой ОС. Так как число активных нитей может оказаться слишком большим и не поместиться в пакет ответа, этот запрос работает итерациями: он может требовать более одной последовательности запрос/ответ, для получения полного списка нитей. Первым запросом последовательности будет qfThreadInfo; последующими запросами последовательностибудут запросы qsThreadInfo.
|
|
Замечание: замещает запрос qL (смотрите ниже).
|
||
ответ m<ид>
|
Идентификатор одной нити | |
ответ m<ид>,<ид>…
|
список идентификаторов нитей, разделенных запятыми | |
ответ l
|
(буква ‘l’ в нижнем регистре) обозначает конец списка. | |
|
В ответ на каждый запрос, цель будет отвечать списком из разделенных запятыми идентификаторов нитей, в шестнадцатеричном представлении, с порядком байт от старшего. GDB будет отвечать на каждый ответ запросом других идентификаторов (используя форму qs запроса),пока цель не ответит l (буква ‘l’ в нижнем регистре, отанглийского слова 'last').
|
||
| дополнительная информация о нити | qThreadExtraInfo,ид
|
|
|
Здесь ид является идентификатором нити в шестнадцатеричном представлении, в порядке байт от старшего. Получает печатаемое описание строки атрибутов нити от целевой ОС. Эта строка может содержать все что угодно, что целевая ОС сочтет интересным для GDB сообщить пользователю о нити. Эта строка выводится в отображении GDB `info threads’. Примерами возможной дополнительной информации являются «Runnable» или «Blocked on Mutex». |
||
| ответ XX… |
Где XX…—ASCII-данные в шестнадцатеричном представлении, содержащие печатную строку с дополнительной информацией об атрибутах нити. |
|
| запрос список или список-нитей (не рекомендовано) | qLнач-флагчисло-нитейслед-нить
|
|
|
Получить информацию о нити от операционной системы, где происходит выполнение. Здесь: нач-флаг (одна шестнадцатеричная цифра) есть единица, что указывает на первый запрос, или ноль, что определяет последующий запрос; число-нитей (две шестнадцатеричные цифры)—максимальное число нитей, которое может содержать пакет ответа; и след-нить (восемь шестнадцатеричных цифр), для последующих запросов (нач-флаг равен нулю), возвращается в ответ как арг-нить. |
||
Замечание: этот запрос был замещен запросомqfThreadInfo (смотрите выше).
|
||
ответ qMчислоконецарг-нитьнить…
|
||
|
Здесь: число (две шестнадцатеричные цифры)—число возвращаемых нитей; конец (одна шестнадцатеричная цифра), есть ноль, который определяет, что есть еще нити, и единица, определяющая, что больше нитей нет; арг-нить (восемь шестнадцатеричных цифр) представляет собой след-нить из пакета запроса; нить…—это последовательность идентификаторов нитей от цели. Идент-нити (восемь шестнадцатеричных цифр). Смотрите remote.c:parse_threadlist_response().
|
||
| вычислить CRC блока памяти | qCRC:адрес,длина
|
|
ответ ENN
|
Ошибка (например, ошибка доступа к памяти) | |
ответ CCRC32
|
Лишняя 32-битная циклическая проверка указанной области памяти. | |
| запросить смещения разделов | qOffsets
|
Получить смещения разделов, которые целевая машина использовала при повторном размещении загруженного образа. Замечание: если смещение Bss включено в ответ, GDB это игнорирует ивместо этого применяет к разделу Bss смещение Data.
|
ответ Text=xxx;Data=yyy;Bss=zzz
|
||
| запросить информацию о нити | qPрежимидент-нити
|
|
|
Возвращает информацию об идент-нити. Здесь: режим является 32-битным режимом в шестнадцатеричном представлении; идент-нити—64-битный идентификатор нити в шестнадцатеричном представлении. |
||
| ответ * |
Смотрите remote.c:remote_unpack_thread_info_response().
|
|
| удаленная команда | qRcmd,КОМАНДА
|
|
|
КОМАНДА (в шестнадцатеричном представлении) передается для выполнения локальному интерпретатору. Неверные команды должны сообщаться при помощи выходной строки. Перед конечным результирующим пакетом, целевая машина может также ответить некоторым количеством промежуточных OВЫВОД пакетов вывода на консоль.Разработчики должны учесть, что предоставление доступа к интерпретатору заглушки может иметь последствия для безопасности. |
||
ответ OK
|
Ответ на команду без вывода. | |
| ответ ВЫВОД |
Ответ на команду со строкой вывода ВЫВОД, в шестнадцатеричном представлении. |
|
ответ ENN
|
Указывает на неправильно сформированный запрос. | |
| reply `’ | Когда `q’`Rcmd’ не распознана. |
Следующие пакеты `g’/`G’ были определены раньше. Ниже,
некоторые 32-битные регистры передаются в виде 64 бит. Эти регистры
должны быть расширены нулем/знаком (как?), чтобы заполнять выделенное
место. Байты регистра передаются в целевом порядке байтов. Две части в
байте регистра передаются от более значимого к менее значимому.
| MIPS32 |
Все регистры передаются как 32-битные величины в таком порядке: 32 общего назначения; sr; lo; hi; bad; cause; pc; 32 регистра с плавающей точкой; fsr; fir; fp. |
| MIPS64 |
Все регистры передаются как 64-битные величины (включая такие 32-битные регистры, как sr). Порядок такой же, как для MIPS32.
|
Вот пример последовательности для перезапускаемой цели. Заметьте, что
перезапуск не получает никакого непосредственного вывода:
<-R00->+target restarts <-?->+->T001:1234123412341234<-+
Пример последовательности при при пошаговом выполнении цели по одной
инструкции:
<-G1445...->+<-s->+time passes ->T001:1234123412341234<-+<-g->+->1455...<-+
Использование программы gdbserver
gdbserver является управляющей программой для Unix-подобных
систем, которая позволяет вам установить соединение вашей программы с
удаленным GDB посредством target remote, но без
компоновки с обычной отладочной заглушкой.
gdbserver не является полной заменой отладочных заглушек, потому что
требует по существу тех же средств операционной системы, что и сам
GDB. Фактически, система, на которой может выполняться
gdbserver для соединения с удаленным GDB, может также
выполнять GDB локально! Тем не менее, gdbserver иногда
полезен, так как по размеру эта программа гораздо меньше, чем
GDB. gdbserver также легче переносить, чем
весь GDB, так что вы сможете быстрее начать работать в новой системе,
используя его. Наконец, если вы разрабатываете программы для
систем реального времени, вы можете обнаружить, что накладные расходы,
связанные с операциями реального времени, делают более удобным
проведение всей возможной разработки на другой системе, например, с помощью
кросс-компиляции. Вы можете использовать gdbserver, чтобы
реализовать аналогичный выбор для отладки.
GDB и gdbserver общаются или через последовательную
линию, или через соединение TCP, используя стандартный удаленный
последовательный протокол GDB.
- На целевой машине
-
вам необходимо иметь копию программы, которую вы хотите отладить.
gdbserverне нуждается в таблице символов вашей программы, так
что вы можете ее исключить, если необходимо сохранить
пространство. Всю обработку символов осуществляет GDB на
рабочей машине.
Чтобы использовать сервер, вы должны сообщить ему, как взаимодействовать с
GDB, имя вашей программы и ее аргументы. Синтаксис следующий:target> gdbserver comm программа [ арг ... ]
comm—это или имя устройства (для использования последовательной линии),
или имя рабочей машины и номер порта TCP. Например, для
отладки Emacs с параметром `foo.txt’ и взаимодействия с
GDB через последовательный порт`/dev/com1':target> gdbserver /dev/com1 emacs foo.txt
gdbserverпассивно ждет рабочего GDB для связи с ним.
При использовании TCP-соединения вместо последовательной линии:target> gdbserver host:2345 emacs foo.txt
Единственное отличие от предыдущего примера состоит в первом параметре,
определяющем, что вы связываетесь с рабочим GDB через TCP.
Параметр `host:2345′ означает, чтоgdbserverдолжен ожидать
TCP-соединение от машины `host’ к локальному порту TCP 2345. (В
настояшее время часть `host’ игнорируется.) Вы можете выбрать
любой номер порта, какой захотите, если при этом он не конфликтует с
какими-либо портами TCP, уже использующимися на целевой системе
(например,23зарезервирован дляtelnet).(15) Вы
должны использовать тот же номер порта с командой рабочего GDB
target remote. - На рабочей машине GDB
-
вам нужна копия вашей программы с символьными данными, так как
GDB нужна информация о символах и отладочная информация.
Запустите GDB как обычно, используя имя локальной копии вашей
программы в качестве первого аргумента. (Вам также может понадобиться
ключ `—baud’, если последовательная линия работает на скорости,
отличной от 9600бит/сек.) После этого, используйтеtarget remote,
чтобы установить связь сgdbserver. Ее параметры—либо
имя устройства (обычно последовательного устройства, такого как
`/dev/ttyb'), либо дескриптор порта TCP в форме
машина:порт. Например:(gdb) target remote /dev/ttyb
взаимодействует с сервером через последовательную линию
`/dev/ttyb', а(gdb) target remote the-target:2345
взаимодействует через TCP-соединение с портом 2345 на рабочей машине
`the-target'. Для TCP-соединения, вы должны запустить
gdbserverдо использования командыtarget remote. Иначе
вы можете получить ошибку, текст которой зависит от рабочей системы, но
обычно он выглядит примерно так: `Connection refused’.
Использование программы gdbserve.nlm
gdbserve.nlm—это управляющая программа для систем NetWare,
которая позволяет вам установить соединение вашей программы с
удаленным GDB посредством target remote.
GDB и gdbserve.nlm общаются через последовательную линию,
используя стандартный удаленный последовательный протокол GDB.
- На целевой машине
-
вам необходимо иметь копию программы, которую вы хотите отладить.
gdbserve.nlmне нуждается в таблице символов вашей программы,
так что вы можете ее исключить, если необходимо сохранить пространство.
GDB осуществляет всю обработку символов на рабочей машине.
Чтобы использовать сервер, вы должны сообщить ему как взаимодействовать с
GDB, имя вашей программы и ее аргументы. Синтаксис следующий:load gdbserve [ BOARD=плата ] [ PORT=порт ] [ BAUD=бод ] программа [ арг ... ]Плата и порт определяют последовательную линию; бод
определяет скорость в бодах, используемую соединением. Значения
порт и node по умолчанию равны 0, бод по умолчанию
9600бит/сек.
Например, для отладки Emacs с параметром `foo.txt’ и взаимодействия
с GDB через последовательный порт номер 2 на плате 1, используя
соединение 19200бит/сек:load gdbserve BOARD=1 PORT=2 BAUD=19200 emacs foo.txt
- На рабочей машине GDB
-
вам нужна копия вашей программы с символьными данными, так как
GDB требуется символьная и отладочная информация. Запустите
GDB как обычно, используя имя локальной копии вашей программы в
качестве первого параметра. (Вам также может понадобиться ключ
`—baud’, если последовательная линия работает на скорости,
отличной от 9600бит/сек.) После этого, используйтеtargetдля установки связи с
remotegdbserve.nlm. Ее
аргумент—имя устройства (обычно последовательного устройства,
такого как`/dev/ttyb'). Например:(gdb) target remote /dev/ttyb
соединение с сервером через последовательную линию
`/dev/ttyb'.
Отображение объектов ядра
Некоторые цели поддерживают отображение объектов ядра. При помощи этих
возможностей, GDB взаимодействует непосредственно с
операционной системой и может выводить информацию об объектах уровня
операционной системы, например, о блокировках
и других объектах синхронизации. Какие именно объекты могут быть
отображены, определяется в зависимости от конкретной ОС.
Используйте команду set os, чтобы установить тип операционной
системы. Это говорит GDB, какой модуль отображения объектов
ядра инициализировать:
(gdb) set os cisco
Если команда set os выполнится успешно, GDB выведет
некоторую информацию об операционной системе, и создаст новую команду
info, которая может быть использована для посылки запросов на
целевую машину. Название команды info выбирается в зависимости
от операционной системы:
(gdb) info cisco List of Cisco Kernel Objects Object Description any Any and all objects
Дальнейшие подкоманды могут использоваться для запросов о конкретных
объектах, информация о которых есть в ядре.
В настоящее время не существует другого способа определить,
поддерживается та или иная операционная система, кроме как попробовать.
Информация о конфигурации
В то время как почти все команды GDB доступны для всех чистых
и кросс-версий отладчика, существуют некоторые исключения. Эта глава
описывает вещи, доступные только в определенных конфигурациях.
Существует три основные категории конфигураций: чистые конфигурации, где
рабочая и целевая машины совпадают, конфигурации для встроенных
операционных систем, которые обычно совпадают для нескольких различных
архитектур процессоров, и отдельные встроенные процессоры, которые
сильно отличаются друг от друга.
Чистая конфигурация
Этот раздел описывает детали, специфичные для определенных чистых
конфигураций.
HP-UX
В системах HP-UX, если вы ссылаетесь на функцию или переменную, имя которой
начинается со знака доллара, GDB сперва ищет имя пользователя
или системы, до поиска вспомогательной переменной.
Информация о процессах SVR4
Многие версии SVR4 предоставляют возможность, называемую
`/proc’, которая может быть использована для исследования образа
выполняемого процесса, используя подпрограммы файловой системы. Если
GDB сконфигурирован для операционной системы, поддерживающей
эту возможность, команда info proc доступна для получения отчета
по некоторым видам информации о процессе, выполняющем вашу программу.
info proc работает только на системах SVR4, которые включают код
procfs. Среди этих систем: OSF/1 (Digital Unix), Solaris,
Irix и Unixware, но не HP-UX или Linux, к примеру.
info proc-
Выдает доступную суммарную информацию о процессе.
info proc mappings-
Сообщает диапазоны адресов, доступных в программе, с информацией, может ли
ваша программа читать, записывать, или исполнять каждый из диапазонов. info proc times-
Время запуска, время пользовательского и системного ЦП для вашей
программы и ее потомков. info proc id-
Сообщает информацию об идентификаторах процессов, относящихся к вашей
программе: ее собственный идентификатор, идентификатор ее родителя,
группы процесса и сеанса. info proc status-
Общая информация о состоянии процесса. Если процесс остановлен, то этот
отчет включает причину останова и любые полученные сигналы. info proc all- Показывает всю вышеперечисленную информацию о процессе.
Встроенные операционные системы
Этот раздел описывает конфигурации, задействующие отладку встроенных
операционных систем, которые доступны для нескольких различных архитектур.
GDB включает возможность отлаживать программы, выполняющиеся в
различных операционных системах реального времени.
Использование GDB с VxWorks
target vxworks имя-машины-
Система VxWorks, присоединенная посредством TCP/IP. Аргумент
имя-машины есть имя или IP-адрес машины целевой системы.
На VxWorks, load компонует имя-файла динамически на текущей
целевой системе, и добавляет ее символьную информацию в GDB.
GDB позволяет разработчикам запускать и отлаживать с Unix-машин
задачи, выполняющиеся на сетевых целях VxWorks. Уже выполняющиеся
задачи, запущенные из оболочки VxWorks, также могут быть отлажены.
GDB использует код, который может выполняться как на машине
Unix, так и на целевой машине VxWorks. Программа gdb
устанавливается и выполняется на Unix-машине. (Она может быть
установлена под именем vxgdb, чтобы отличать ее от GDB
для отладки программ на рабочей машине.)
VxWorks-timeout арг-
Сейчас все цели, базирующиеся на VxWorks, поддерживают параметр
vxworks-timeout. Этот параметр устанавливается пользователем, и
арг представляют число секунд, в течение которых GDB
ожидает ответы
на вызовы удаленных процедур. Вы можете использовать это, если ваша
целевая машина VxWorks является медленным программным эмулятором, или
находится далеко на другом конце медленного сетевого соединения.
Следующая информация о соединении к VxWorks была свежей, когда
это руководство было написано; более новые выпуски VxWorks могут
использовать обновленные процедуры.
Для использования GDB с VxWorks, вы должны пересобрать ваше
ядро VxWorks, чтобы включить подпрограммы интерфейса удаленной отладки в
библиотеку VxWorks `rdb.a'. Чтобы это сделать, определите
INCLUDE_RDB в конфигурационном файле VxWorks `configAll.h' и
пересоберите ядро VxWorks. Получившееся ядро содержит `rdb.a', и
порождает задачу отладки исходного кода tRdbTask, когда VxWorks
загружается. Для большей информации по конфигурированию и сборке
VxWorks, смотрите руководство изготовителя.
Когда вы включили `rdb.a' в образ вашей системы VxWorks и так
установили ваши пути поиска выполняемых файлов, чтобы можно было найти
GDB, вы готовы к вызову отладчика. Из вашей рабочей
Unix-машины, выполните gdb (или vxgdb, в
зависимости от вашей установки).
GDB появляется и показывает приглашение:
(vxgdb)
Соединение к VxWorks
Команда GDB target позволяет вам соединяться с целевой
машиной VxWorks в сети. Для соединения с целью, имя которой есть
«tt«, введите:
(vxgdb) target vxworks tt
GDB покажет сообщения, аналогичные этим:
Attaching remote machine across net... Connected to tt.
Затем GDB пытается считать таблицы символов всех объектных
модулей, загруженных на целевой машине VxWorks с того момента, как она
была включена. GDB находит эти файлы путем поиска в
каталогах, перечисленных в путях поиска команд (see section Рабочая среда вашей программы); если ему не удается найти объектный файл, он
выводит подобное сообщение:
prog.o: No such file or directory.
Когда это происходит, добавьте соответствующий каталог к путям поиска с
помощью команды GDB path, и выполните команду
target снова.
Загрузка на VxWorks
Если вы соединились с целевой машиной VxWorks и хотите отладить объект,
который еще не был загружен, вы можете использовать команду GDB
load, чтобы загрузить файл из Unix в VxWorks. Объектный файл,
заданный в качестве аргумента к load, в действительности
открывается дважды: сначала целевой машиной VxWorks, чтобы загрузить код,
а затем GDB, чтобы считать таблицу символов. Это может
привести к проблемам, если текущие рабочие каталоги в этих системах
различаются. Если обе системы монтируют по NFS одинаковые
файловые системы, вы можете избежать этих проблем, используя абсолютные
пути. В противном случае, проще всего установить рабочий каталог на
обеих системах в тот, в котором расположен объектный файл, и затем
ссылаться на него по имени, без пути. Например, программа
`prog.o' может находиться в `vxpath/vw/demo/rdb' на
VxWorks и в `hostpath/vw/demo/rdb' на рабочей машине. Для
загрузки этой программы, введите в VxWorks следующее:
-> cd "vxpath/vw/demo/rdb"
Затем, в GDB, введите:
(vxgdb) cd hostpath/vw/demo/rdb (vxgdb) load prog.o
GDB отобразит ответ, аналогичный этому:
Reading symbol data from wherever/vw/demo/rdb/prog.o... done.
Вы также можете использовать команду load, чтобы заново загрузить
объектный модуль, после редактирования и повторной компиляции соответствующего
исходного файла. Заметьте, что при этом GDB удаляет все
определенные точки останова, автоматические отображения, вспомогательные
переменные, и очищает историю значений. (Это необходимо для того, чтобы
сохранить целостность структур данных отладчика, которые ссылаются
на таблицу символов целевой системы.)
Запуск задач
Вы также можете присоединиться к существующей задаче, используя команду
attach следующим образом:
(vxgdb) attach задача
где задача является шестнадцатеричным идентификатором задачи
VxWorks. Когда вы присоединяетесь к задаче, она может выполняться либо
быть приостановленной. Выполняющаяся задача приостанавливается в момент
присоединения.
Встроенные процессоры
Этот раздел описывает детали, специфичные для определенных встроенных
конфигураций.
Встроенный AMD A29K
target adapt устр-
Монитор Adapt для A29K.
target amd-eb устр скорость прог-
Удаленная PC-резидентная плата AMD EB29K, присоединенная по
последовательным линиям. Устр является последовательным
устройством, также как дляtarget remote; скорость
позволяет вам указать скорость линии; а прог является именем
программы, которая будет отлаживаться, так, как оно появляется в ДОС на ПК.
See section Протокол EBMON для AMD29K.
A29K UDI
Для отладки процессоров семейства a29k, GDB поддерживает
протокол AMD UDI («Universal Debugger
Interface»(16)). Для использования
этой конфигурации с целями AMD, на которых выполняется монитор MiniMON,
вам нужна программа MONTIP, доступная бесплатно у AMD. Вы можете
также использовать GDB с программой ISSTIP,
UDI-совместимым эмулятором a29k, также доступным у AMD.
target udi кл-слово-
Выбрать интерфейс UDI к удаленной плате a29k или эмулятору. Здесь
кл-слово является элементом в конфигурационном файле AMD
`udi_soc'. Этот файл содержит в качестве элементов ключевые слова,
которые определяют параметры, используемые при соединении к целям a29k.
Если файл`udi_soc'не находится в вашем рабочем каталоге, вы
должны установить путь к нему в переменной среды `UDICONF’.
Протокол EBMON для AMD29K
AMD распространяет плату разработки 29K, предназначенную для помещения в
ПК, вместе с программой монитора EBMON, работающей в ДОС. Коротко эта
система разработки называется «EB29K». Чтобы использовать
GDB из Unix-системы для выполнения программ на плате EB29K, вы
должны сперва соединить последовательным кабелем ПК (в котором
установлена плата EB29K) и последовательный порт на Unix-системе. Далее
мы предполагаем, что вы соединили кабелем порт ПК `COM1' и
`/dev/ttya' на Unix-системе.
Установка связи
Следующим шагом нужно установить параметры порта ПК, сделав в ДОС что-то
вроде этого:
C:> MODE com1:9600,n,8,1,none
Этот пример, выполненный в системе MS DOS 4.0, устанавливает порт ПК в
9600бит/сек, без проверки четности, восьмибитные данные, один
стоп-бит и отсутствие действия для «повтора»; вы должны использовать
те же параметры связи при установке соединения со стороны Unix.
Чтобы передать управление с ПК стороне Unix, введите следующее в консоли
ДОС:
C:> CTTY com1
(Позже, если вы хотите вернуть управление консоли ДОС, вы можете
использовать команду CTTY con—но вы должны послать ее через
устройство, имевшее управление, в нашем примере через последовательную
линию `COM1'.)
На Unix-машине, для связи с ПК используйте коммуникационную программу,
такую как tip или cu. Например
cu -s 9600 -l /dev/ttya
Показанные ключи для cu определяют, соответственно, скорость
линии и последовательный порт. Если вместо этого вы используете
tip, ваша командная строка может выглядеть следующим образом:
tip -9600 /dev/ttya
Ваша система может требовать другого имени в том месте, где мы
показываем `/dev/ttya' в качестве аргумента к tip.
Параметры связи, включая используемый порт, ассоциированы с аргументом к
tip в файле описаний «remote»—обычно это `/etc/remote'.
Используя соединение tip или cu, измените рабочий каталог
ДОС в тот, который содержит копию вашей программы 29K, затем запустите
на ПК программу EBMON (управляющая программа EB29K, поставляемая
AMD с вашей платой). Вы должны увидеть начальный вывод EBMON,
аналогичный следующему, заканчивающийся приглашением EBMON
`#’:
C:> G: G:> CD usrjoework29k G:USRJOEWORK29K> EBMON Am29000 PC Coprocessor Board Monitor, version 3.0-18 Copyright 1990 Advanced Micro Devices, Inc. Written by Gibbons and Associates, Inc. Enter '?' or 'H' for help PC Coprocessor Type = EB29K I/O Base = 0x208 Memory Base = 0xd0000 Data Memory Size = 2048KB Available I-RAM Range = 0x8000 to 0x1fffff Available D-RAM Range = 0x80002000 to 0x801fffff PageSize = 0x400 Register Stack Size = 0x800 Memory Stack Size = 0x1800 CPU PRL = 0x3 Am29027 Available = No Byte Write Available = Yes # ~.
Затем выйдите из программы cu или tip (в этом примере это
сделано при помощи ввода ~. в приглашении EBMON).
EBMON продолжает работать, готовый к тому, что GDB
перехватит управление.
Для этого примера, мы предположили, что существует соединение PC/NFS,
которое устанавливает файловую систему Unix-машины как «диск
`G:'» на ПК. Это является, вероятно, самым удобным способом
удостовериться, что одна и та же программа 29K находится и на ПК, и в
Unix-системе. Если у вас нет PC/NFS или чего-нибудь аналогичного,
соединяющего две системы, вы должны прибегнуть к другому
способу передачи программы 29K из Unix на ПК—возможно переписать ее на
дискету. GDB не загружает программы по последовательной
линии.
Кросс-отладка EB29K
Наконец, перейдите в каталог, содержащий образ вашей программы 29K в
Unix-системе, и запустите GDB, указав имя программы в качестве
аргумента:
cd /usr/joe/work29k gdb myfoo
Теперь вы можете использовать команду target:
target amd-eb /dev/ttya 9600 MYFOO
В этом примере мы предполагали, что ваша программа находится в файле
`myfoo'. Заметьте, что имя файла, заданное в качестве последнего
аргумента к target amd-eb, должно быть таким, каким его видит
ДОС. В нашем примере, это просто MYFOO, но вообще оно может
включать путь ДОС, и, в зависимости от механизма передачи, может быть
не похоже на имя на Unix-машине.
В этом месте вы можете установить желаемые точки останова; когда вы
будете готовы увидеть вашу программы выполняющейся на плате 29K,
используйте команду GDB run.
Чтобы остановить отладку удаленной программы, используйте команду
GDB detach.
Чтобы возвратить управление консоли ПК, используйте tip или
cu снова, после завершения вашего сеанса GDB, чтобы
присоединиться к EBMON. Затем вы можете ввести команду q,
чтобы завершить работу EBMON, возвращая управление командному
интерпретатору ДОС. Введите CTTY con, чтобы возвратить командный
ввод основной консоли ДОС, и введите ~., чтобы покинуть tip
или cu.
Удаленный журнал
Команда target amd-eb создает в текущем рабочем каталоге файл
`eb.log', чтобы помочь отладить проблемы с соединением.
`eb.log' записывает весь вывод `EBMON', включая эхо
посланных ему команд. Выполнение `tail -f’ для этого файла в другом
окне часто помогает понять проблемы с EBMON, или неожиданные
события на стороне ПК.
ARM
target rdi устр-
Монитор ARM Angel, через интерфейс библиотеки RDI к протоколу ADP. Вы
можете использовать эту цель для взаимодействия как с платами, на
которых выполняется монитор Angel, так и с устройством отладки
EmbeddedICE JTAG. target rdp устр- Монитор ARM Demon.
Hitachi H8/300
target hms устр-
Плата Hitachi SH, H8/300 или H8/500, присоединенная через
последовательную линию к вашей машине. Используйте специальные команды
deviceиspeedдля управления последовательной линией и
используемой скоростью связи. target e7000 устр- Эмулятор E7000 для Hitachi H8 и SH.
target sh3 устрtarget sh3e устр- Целевые системы Hitachi SH-3 и SH-3E.
Когда вы выбираете удаленную отладку для платы Hitachi SH, H8/300 или
H8/500, команда load загружает вашу программу на плату Hitachi, и
также открывает ее как текущую выполняемую цель для GDB на
вашей машине (как команда file).
Для общения с вашим Hitachi SH, H8/300 или H8/500, GDB
необходимо знать следующие вещи:
-
что вы хотите использовать: `target hms’, удаленный отладочный
интерфейс для микропроцессоров Hitachi, или `target e7000′,
встроенный эмулятор для Hitachi SH и Hitachi 300H. (`target hms’
используется по умолчанию, если GDB сконфигурирован специально
для Hitachi SH, H8/300 или H8/500.) -
какое последовательное устройство соединяет вашу машину с платой Hitachi
(по умолчанию используется первое последовательное устройство, доступное
на вашей машине). - какую скорость использовать для этого последовательного устройства.
Соединение с платами Hitachi
Используйте специальную команду GDB `device порт‘,
если вам нужно явно установить последовательное устройство. По
умолчанию используется первый порт, доступный на вашей машине.
Это необходимо только на Unix-машинах, где это обычно что-то типа
`/dev/ttya'.
GDB имеет другую специальную команду для установки скорости
связи: `speed bps‘. Эта команда также используется только на
Unix-машинах; в ДОС, устанавливайте скорость линии как обычно извне
GDB командой mode (например,
mode com2:9600,n,8,1,p для соединения 9600бит/сек.
Команды `device’ и `speed’ доступны для отладки программ
микропроцессора Hitachi, только если вы используете рабочую среду Unix.
Если вы используете ДОС, для взаимодействия с платой разработки через
последовательный порт ПК GDB полагается на вспомогательную
резидентную программу asynctsr. Вы также должны использовать
команду ДОС mode, чтобы подготовить порт со стороны ДОС.
Следующий пример сеанса иллюстрирует шаги, необходимые для запуска
программы на H8/300 под управлением GDB. В нем используется
программа H8/300 под названием `t.x'. Для Hitachi SH и H8/500
процедура та же самая.
Сперва подсоедините вашу плату разработки. В этом примере, мы
используем плату, присоединенную к порту COM2. Если вы
используете другой последовательный порт, подставьте его имя в агрументе
команды mode. Когда вы вызываете asynctsr,
вспомогательную программу связи, используемую отладчиком, вы передаете
ей только числовую часть имени последовательного порта; например, ниже
`asynctsr 2′ запускает asynctsr для COM2.
C:H8300TEST> asynctsr 2 C:H8300TEST> mode com2:9600,n,8,1,p Resident portion of MODE loaded COM2: 9600, n, 8, 1, p
Предупреждение: Мы обнаружили ошибку в PC-NFS, которая
конфликтует сasynctsr. Если вы также используете PC-NFS на
вашей ДОС-машине, вам может потребоваться отключить его, или даже
загрузить машину без него, чтобы использоватьasynctsrдля
управления отладочной платой.
Теперь, когда связь установлена и плата разработки присоединена, вы
можете запустить GDB. Вызовите gdb с именем
вашей программы в качестве аргумента. GDB выводит
обычное приглашение: `(gdb)’. Используйте две специальные
команды для начала сеанса отладки: `target hms’ для задания
кросс-отладки для платы Hitachi, и команду load для загрузки вашей
программы на нее. load выводит имена разделов программы, и
`*’ для каждых двух килобайт загруженных данных. (Если вы хотите
обновить данные GDB для символов или для выполняемого файла без
загрузки, используйте команды GDB file или
symbol-file. Для описания этих команд, равно как и самой команды
load, см. section Команды для задания файлов.)
(eg-C:H8300TEST) gdb t.x GDB is free software and you are welcome to distribute copies of it under certain conditions; type "show copying" to see the conditions. There is absolutely no warranty for GDB; type "show warranty" for details. GDB 5.0, Copyright 1992 Free Software Foundation, Inc... (gdb) target hms Connected to remote H8/300 HMS system. (gdb) load t.x .text : 0x8000 .. 0xabde *********** .data : 0xabde .. 0xad30 * .stack : 0xf000 .. 0xf014 *
Теперь вы готовы выполнять или отлаживать вашу программу. С этого
момента, вы можете использовать все обычные команды GDB. Команда
break устанавливает точки останова; run запускает вашу
программу; print или x отображает данные; команда
continue возобновляет выполнение после остановки в точке
останова. Вы можете использовать команду help в любой момент,
чтобы узнать больше о командах GDB.
Помните, однако, что возможности операционной системы не доступны
на вашей плате разработки; например, если ваша программа зависает, вы
не можете послать сигнал прерывания—но можете нажать кнопку RESET!
Используйте кнопку RESET на вашей плате разработки
-
чтобы прервать вашу программу (не используйте ctl-C на машине с
ДОС—у нее нет способа передать сигнал прерывания на плату разработки); и -
для возврата к приглашению GDB после того, как ваша программа
нормально завершается. Протокол связи не предусматривает другого способа
для GDB определить, что ваша программа завершилась.
В любом случае, GDB видит результат нажатия RESET на плате
разработки как «нормальное завершение» вашей программы.
Использование встроенного эмулятора E7000
Вы можете использовать встроенный эмулятор E7000 для разработки кода либо
для Hitachi SH, либо для H8/300H. Используйте одну из этих форм команды
`target e7000′ для соединения GDB с вашей E7000:
target e7000 порт скорость-
Используйте эту форму, если ваша E7000 присоединена к последовательному
порту. Аргумент порт идентифицирует, какой последовательный порт
использовать (например, `com2′). Третий аргумент является
скоростью линии в битах в секунду (например, `9600′). target e7000 имя-узла-
Если ваша E7000 установлена как узел сети TCP/IP, вы можете просто
указать его имя; GDB использует для соединенияtelnet.
Специальные команды GDB для Hitachi
Некоторые команды GDB доступны только для H8/300:
set machine h8300set machine h8300h-
Настраивайте GDB на один из двух вариантов архитектур H8/300 с
помощью `set machine’. Вы можете использовать `show machine’,
чтобы проверить, какой из вариантов действует в данный момент.
H8/500
set memory модshow memory-
Укажите, какую модель памяти H8/500 (мод) вы используете с помощью
`set memory’; проверяйте, какая модель используется при помощи
`show memory’. Допустимыми значениями для мод являются
small,big,mediumиcompact.
Intel i960
target mon960 устр-
Монитор MON960 для Intel i960.
target nindy имя-устр-
Плата Intel 960, управляемая Nindy Monitor. Имя-устр является
именем последовательного устройства, которое должно использоваться для
соединения, например`/dev/ttya'.
Nindy—это программа ROM Monitor для целевых систем Intel 960.
Когда GDB сконфигурирован для управления удаленным Intel 960 с
использованием Nindy, вы можете указать ему, как присоединиться к 960
несколькими способами:
-
Указав последовательный порт, версию протокола Nindy и скорость связи
через ключи командной строки; - Ответив на запрос при старте;
-
Используя команду
targetв любом месте вашего сеанса
GDB. See section Команды для управления целями.
С интерфейсом Nindy к плате Intel 960, команда load загружает
имя-файла на 960, а также добавляет его символьные данные в
GDB.
Вызов Nindy
Если вы просто запустите gdb без использования ключей
командной строки, у вас запросят, какой последовательный порт
использовать, до того, как вы получите обычное приглашение
GDB:
Attach /dev/ttyNN -- specify NN, or "quit" to quit:
Ответьте на запрос с любым суффиксом (после `/dev/tty’),
определяющим последовательный порт, который вы хотите использовать. Вы
можете, по своему выбору, просто начать работу без соединения с
Nindy, ответив на приглашение пустой строкой. Если вы сделаете это и позже
захотите присоединиться к Nindy, используйте target
(see section Команды для управления целями).
Параметры для Nindy
Вот параметры вызова для начала вашего сеанса GDB с подключенной
платой Nindy-960:
-r порт-
Задайте имя порта последовательного интерфейса, который должен
использоваться для соединения с целевой системой. Этот ключ доступен
только когда GDB сконфигурирован для целевой архитектуры Intel
960. Вы можете определить порт любым из следующих способов:
полный путь (например, `-r /dev/ttya’), имя устройства в
`/dev'(например, `-r ttya’) или просто уникальный суффикс для
определенногоtty(например, `-r a’). -O-
(Заглавная буква «O», не ноль.) Определяет, что GDB
должен использовать «старый» протокол монитора Nindy для
соединения с целевой системой. Этот ключ доступен только когда
GDB сконфигурирован для целевой архитектуры Intel 960.Предупреждение: если вы определите `-O’, но в
действительности попытаетесь связаться с системой, которая
ожидает более нового протокола, соединение не будет установлено, как
будто не соответствуют скорости. GDB неоднократно пытается
соединиться снова на нескольких различных скоростях линии. Вы можете
остановить этот процесс посредством прерывания. -brk-
Определяет, что GDB должен сперва послать целевой системе
сигналBREAK, пытаясь сбросить ее, перед соединением с целью
Nindy.Предупреждение: Многие целевые системы не имеют требуемых
для этого аппаратных средств; это работает только на немногих платах.
Стандартный ключ `-b’ управляет скоростью линии, используемой на
последовательном порту.
Команда сброса Nindy
reset-
Для целей Nindy, эта команда посылает «break» удаленной целевой
системе; она полезна, только если целевая система была оборудована
схемой для выполнения аппаратного сброса (или других действий,
представляющих интерес) при обнаружении прерывания.
Mitsubishi M32R/D
target m32r устр-
Монитор ROM Mitsubishi M32R/D.
M68k
Конфигурация Motorola m68k включает поддержку ColdFire, и команду
target для следующих мониторов ROM.
target abug устр-
Монитор ABug ROM для M68K.
target cpu32bug устр- Монитор CPU32BUG, выполняющийся на плате CPU32 (M68K).
target dbug устр- Монитор dBUG ROM для Motorola ColdFire.
target est устр- Монитор EST-300 ICE, выполняющийся на плате CPU32 (M68K).
target rom68k устр- Монитор ROM 68K, выполняющийся на плате M68K IDP.
Если GDB сконфигурирован с m68*-ericsson-*, то вместо
этого у него будет только одна специальная команда target:
target es1800 устр-
Эмулятор ES-1800 для M68K.
target rombug устр-
Монитор ROMBUG ROM для OS/9000.
M88K
target bug устр-
Монитор BUG, выполняющийся на плате MVME187 (m88k).
Встроенный MIPS
GDB может использовать удаленный отладочный протокол MIPS для
взаимодействия с платой MIPS, присоединенной к последовательной линии.
Эта возможность доступна, если вы сконфигурировали GDB с
`—target=mips-idt-ecoff’.
Используйте эти команды GDB для определения соединения с вашей
целевой платой:
target mips порт-
Для выполнения программы на плате, выполните
gdb, задав
имя программы в качестве аргумента. Для соединения с платой,
используйте команду `target mips порт‘, где порт—имя
последовательного порта, присоединенного к плате. Если программа еще не
была загружена на плату, вы можете использовать командуload,
чтобы это сделать. Затем вы можете использовать все обычные команды
GDB.
Например, эта последовательность команд устанавливает соединение к
целевой плате через последовательный порт, загружает и начинает
выполнение из отладчика программы с именем prog:host$ gdb prog GDB is free software and ... (gdb) target mips /dev/ttyb (gdb) load prog (gdb) run
target mips имя-машины:номер-порта-
В некоторых рабочих конфигурациях GDB, вы можете задать
TCP-соединение (например, к последовательной линии, управляемой
терминальным концентратором) вместо последовательного порта, используя
синтаксис `имя-машины:номер-порта‘. target pmon порт-
Монитор ROM PMON.
target ddb порт-
NEC DDB-разновидность PMON для Vr4300.
target lsi порт-
LSI-разновидность PMON.
target r3900 устр- Densan DVE-R3900 монитор ROM для Toshiba R3900 Mips.
target array устр- Плата контроллера RAID Array Tech LSI33K.
GDB также поддерживает следующие специальные команды для целей
MIPS:
set processor аргshow processor-
Используйте команду
set processorдля установки типа процессора
MIPS, когда вы хотите обратиться к регистрам, уникальным для данного
типа процессора. Например,set processor r3041велит
GDB использовать регистры CPO, соответствующие микросхеме
3041. Используйте командуshow processor, чтобы узнать, какой
процессор MIPS используется GDB. Используйте команду
info regчтобы узнать, какие регистры использует GDB. set mipsfpu doubleset mipsfpu singleset mipsfpu noneshow mipsfpu-
Если ваша целевая плата не поддерживает сопроцессор MIPS для вычислений
с плавающей точкой, вы должны использовать команду `set mipsfpu
none’ (если вам это нужно, вы можете поместить эту команду в ваш
файл инициализации GDB).
Это говорит GDB, как найти значения
функций, которые возвращают величины с плавающей точкой. Это также
позволяет GDB избежать сохранения регистров с плавающей точкой
при вызове функций на плате. Если вы используете сопроцессор поддержки
вычислений с плавающей точкой с поддержкой только одинарной точности,
как на процессоре R4650, используйте команду `set mipsfpu
single’. По умолчанию используется сопроцессор поддержки вычислений с
плавающей точкой двойной точности; этот режим может быть выбран с
помощью `set mipsfpu double’.
В предыдущих версиях, единственным выбором была двойная точность или
отсутствие поддержки вычислений с плавающей точкой, так что `set
mipsfpu on’ выберет режим двойной точности, а `set mipsfpu off’
отключит эту поддержку.
Как обычно, вы можете запросить значение переменнойmipsfpuпри
помощи `show mipsfpu’. set remotedebug nshow remotedebug-
Вы можете увидеть некоторую отладочную информацию о связи с
платой, установив переменнуюremotedebug. Если вы установите ее
в1при помощи `set remotedebug 1′, будет отображаться
каждый пакет. Если вы установите ее в2, то будет отображаться
каждый символ. В любой момент вы можете проверить текущее значение
переменной командой `show remotedebug’. set timeout секундыset retransmit-timeout секундыshow timeoutshow retransmit-timeout-
Вы можете управлять временем ожидания пакета, используемом в удаленном
протоколе MIPS, при помощи командыset timeout секунды.
Значение по умолчанию—5 секунд. Аналогично, вы можете управлять
временем ожидания, используемом при ожидании подтверждения пакета с
помощью командыset retransmit-timeout секунды. По
умолчанию 3 секунды. Вы можете узнать обе эти величины с помощью
show timeoutиshow retransmit-timeout. (Эти команды
доступны только если GDB сконфигурирован для цели
`—target=mips-idt-ecoff’.)
Время ожидания, установленное при помощиset timeout, не имеет
значения, когда GDB ожидает остановки вашей программы. В этом
случае, GDB ждет бесконечно, потому что у него нет способа
узнать, сколько программа будет выполняться, пока не остановится.
PowerPC
target dink32 устр-
Монитор ROM DINK32.
target ppcbug устрtarget ppcbug1 устр- Монитор ROM PPCBUG для PowerPC.
target sds устр- Монитор SDS, выполняющийся на плате PowerPC (такой как Motorola ADS).
Встроенный HP PA
target op50n устр-
Монитор OP50N, выполняющийся на плате OKI HPPA.
target w89k устр- Монитор W89K, выполняющийся на плате Winbond HPPA.
Hitachi SH
target hms устр-
Плата Hitachi SH, присоединенная через последовательную линию к вашей
рабочей машине. Используйте специальные командыdeviceи
speedдля управления последовательной линией и используемой
скоростью связи. target e7000 устр- Эмулятор E7000 для Hitachi SH.
target sh3 устрtarget sh3e устр- Целевые системы Hitachi SH-3 и SH-3E.
Tsqware Sparclet
GDB позволяет разработчикам отлаживать с Unix-машины задачи,
выполняющиеся на целевых системах Sparclet. GDB использует код,
который выполняется как Unix-машине, так и на цели Sparclet. Программа
gdb устанавливается и работает на Unix-машине.
remotetimeout арг-
GDB поддерживает параметр
remotetimeout. Он
устанавливатся пользователем, а арг представляет число секунд, в
течение которых GDB ожидает ответы.
При компиляции для отладки, используйте ключи `-g’ для получения
отладочной информации, и `-Ttext’ для того, чтобы разместить
программу в том месте, в каком вы хотите загрузить ее на целевую
машину. Вы также можете добавить ключ `-n’ или `-N’,
чтобы уменьшить размеры разделов. Например:
sparclet-aout-gcc prog.c -Ttext 0x12010000 -g -o prog -N
Для проверки, что адреса в действительности являются теми, которые вы
подразумевали, можно использовать objdump:
sparclet-aout-objdump --headers --syms prog
После того, как вы установили путь поиска выполняемых файлов, в котором
присутствует GDB, вы готовы запустить отладчик. С вашей
рабочей машины Unix, выполните gdb (или
sparclet-aout-gdb, в зависимости от вашей установки).
GDB запустится и покажет приглашение:
(gdbslet)
Установка файла для отладки
Команда GDB file позволяет вам выбрать программу для
отладки.
(gdbslet) file prog
Затем GDB пытается прочитать таблицу символов программы
`prog'. Он находит файл путем поиска в каталогах, перечисленных в
пути поиска команд. Если файл был скомпилирован с отладочной
информацией (ключ `-g’), то также будет произведен поиск исходных
файлов. GDB находит исходные файлы, производя поиск в
каталогах, перечисленных в пути поиска каталогов (see section Рабочая среда вашей программы). Если ему не удается найти файл, он выводит
сообщение, подобное этому:
prog: No such file or directory.
Когда это случается, добавьте соответствующие каталоги в пути поиска с
помощью команд GDB path и dir, и выполните
команду target снова.
Соединение к Sparclet
Команда GDB target позволяет вам установить
соединение с целевой машиной Sparclet. Для соединения с
последовательным портом «ttya«, введите:
(gdbslet) target sparclet /dev/ttya Remote target sparclet connected to /dev/ttya main () at ../prog.c:3
GDB выведет сообщение, подобное этому:
Connected to ttya.
Загрузка на Sparclet
Когда вы установили соединение к цели Sparclet, вы можете использовать
команду GDB load для загрузки файла с рабочей машины на
целевую. Имя файла и смещение загрузки должно быть задано команде
load в качестве аргумента. Так как формат файла aout, программа
должна быть загружена по начальному адресу. Чтобы определить, чему
равна эта величина, вы можете использовать objdump. Смещение
загрузки—это смещение, которое добавляется к VMA (Virtual Memory
Address(17))
каждого раздела файла.
Например, если программа `prog' была скомпонована с адресом текста
0x1201000, сегментом данных по адресу 0x12010160 и сегментом стека по
адресу 0x12010170, введите в GDB:
(gdbslet) load prog 0x12010000 Loading section .text, size 0xdb0 vma 0x12010000
Если код загружается по адресу, отличному от того, по которому программа
была скомпонована, вам может потребоваться использовать команды
section и add-symbol-file, чтобы сообщить GDB,
куда отобразить таблицу символов.
Выполнение и отладка
Теперь вы можете начать отлаживать задачу, используя команды
GDB для управления выполнением, b, step,
run, и так далее. Все такие команды перечислены в этом
руководстве.
(gdbslet) b main Breakpoint 1 at 0x12010000: file prog.c, line 3. (gdbslet) run Starting program: prog Breakpoint 1, main (argc=1, argv=0xeffff21c) at prog.c:3 3 char *symarg = 0; (gdbslet) step 4 char *execarg = "hello!"; (gdbslet)
Fujitsu Sparclite
target sparclite устр-
Платы Fujitsu sparclite, используемые только с целью загрузки. Чтобы
отлаживать программу, вы должны использовать дополнительную команду.
Например, target remote устр, используя стандартный удаленный
протокол GDB.
Tandem ST2000
GDB может быть использован с телефонным коммутатором Tandem
ST2000, поддерживающим протокол Tandem STDBUG.
Для соединения вашего ST2000 с рабочей машиной, смотрите руководство
производителя. После того, как ST2000 физически подключен, вы можете
выполнить:
target st2000 устр скорость
чтобы установить его как вашу отладочную среду. Устр—это обычно
имя последовательного устройства, такое как `/dev/ttya',
соединенного с ST2000 через последовательную линию. Вместо этого, вы
можете указать устр как TCP-соединение (например, к
последовательной линии, присоединенной через терминальный концентратор),
используя синтаксис имя-машины:номер-порта.
Команды load и attach не определены для этой цели;
вы должны загрузить вашу программу на ST2000 также, как вы это обычно
делаете для автономных действий. GDB читает отладочную
информацию (например, символы) из отдельной, отладочной версии
программы, которая доступна на вашем рабочем компьютере.
Следующие вспомогательные команды GDB доступны для облегчения
работы в среде ST2000:
st2000 команда-
Послать команду монитору STDBUG. Доступные команды описаны в
руководстве производителя. connect-
Соединяет управляющий терминал с командным монитором STDBUG. Когда вы
закончили взаимодействие с STDBUG, ввод одной из двух
последовательностей символов возвратит вас назад к приглашению
GDB: RET~. (Return, за которым следует тильда и
точка) или RET~C-d (Return, за которым следует тильда
и control-D).
Zilog Z8000
Будучи сконфигурированным для отладки целей Zilog Z8000, GDB
включает имитатор Z8000.
Для семейства Z8000, `target sim’ имитирует либо Z8002 (не
сегментированный вариант архитектуры Z8000), либо Z8001
(сегментированный вариант). Имитатор распознает подходящую архитектуру
изучая объектный код.
target sim арг-
Отладка программ на имитируемом ЦП. Если имитатор поддерживает
параметры установки, укажите их в арг.
После определения этой цели, вы можете отлаживать программы для
имитированного ЦП таким же образом, как программы для вашего рабочего
компьютера; используйте команду file для загрузки образа новой
программы, команду run для запуска вашей программы, и так далее.
Помимо того, что доступны все обычные машинные регистры
(see section Регистры), имитатор Z8000 предоставляет три
специально названных регистра с дополнительной информацией:
cycles- Считает тактовые импульсы с имитаторе.
insts- Считает инструкции, выполненные в имитаторе.
time- Время выполнения в шестидесятых долях секунды.
Вы можете ссылаться на эти значения в выражениях GDB с помощью
обычных соглашений; например, `b fputc if $cycles>5000′
устанавливает условную точку останова, которая срабатывает только после
как минимум 5000 имитированных тактовых импульсов.
Архитектуры
Этот раздел описывает свойства архитектур, которые воздействуют на все
применения GDB с данной архитектурой, как при чистой отладке,
так и при кросс-отладке.
A29K
set rstack_high_address адрес-
В процессорах семейства AMD 29000, регистры сохраняются в отдельном
стеке регистров. Для отладчика не существует способа
определить размер этого стека. Обычно, GDB просто
подразумевает, что стек «достаточно большой». Это может привести к
тому, что GDB попытается обратиться несуществующей области
памяти. В случае необходимости, вы можете решить эту проблему, указав
конечный адрес стека регистров с помощью командыset. Аргумент должен быть адресом, который вы,
rstack_high_address
вероятно, захотите начать с `0x’, чтобы задать его в
шестнадцатеричном виде. show rstack_high_address-
Отобразить текущее ограничение на стек регистров для процессоров
семейства AMD 29000.
Alpha
Смотрите следующий раздел.
MIPS
Компьютеры, базирующиеся на архитектурах Alpha и MIPS, используют
необычный кадр стека, который иногда требует от GDB поиска в
объектном коде в обратном направлении, чтобы найти начало функции.
Чтобы сократить время ответа (особенно для встроенных приложений, где
GDB может быть ограничен медленной последовательной линией для
этого поиска), вы можете захотеть ограничить область поиска, используя
одну из этих команд:
set heuristic-fence-post предел-
Ограничить GDB для исследования не более предела байт при
поиске начала функции. Значение 0 (по умолчанию) означает
неограниченный поиск. Однако, исключая 0, чем больше предел, тем
больше байтheuristic-fence-postдолжен просмотреть, и,
следовательно, тем дольше он будет выполняться. show heuristic-fence-post- Отобразить текущее значение данного предела.
Эти команды доступны только когда GDB сконфигурирован
для отладки программ на процессорах Alpha или MIPS.
Управление GDB
Вы можете изменять способы взаимодействия GDB с вами, используя
команду set. Для команд, управляющих способами отображения
данных GDB, смотрите section Параметры вывода.
Другие установки описаны здесь.
Приглашение
GDB демонстрирует свою готовность считать команду, выводя строку,
называемую приглашением. Обычно это `(gdb)’. Вы
можете изменить строку приглашения командой set prompt.
Например, при отладке GDB с помощью GDB, полезно
изменить приглашение в одном из сеансов так, чтобы вы всегда могли
понять, с каким из них вы общаетесь.
Замечание: set prompt не добавляет пробелы после установленного
вами приглашения. Это позволяет устанавливать приглашение,
заканчивающееся пробелом или нет.
set prompt новое-пригл-
Указывает GDB, что с этого момента надо использовать в качестве
стpоки приглашения новое-пригл. show prompt- Печатает строку в форме: `Gdb’s prompt is: ваше-пригл‘
Редактирование команд
GDB читает входные команды через интерфейс readline. Эта
библиотека GNU обеспечивает согласованное поведение для программ,
которые предоставляют пользователю интерфейс командной строки.
Преимуществами являются стили редактирования командной строки GNU
Emacs или vi, csh-подобная подстановка истории
и сохранение и повторное использование истории команд между сеансами отладки.
Вы можете управлять поведением редактирования командной строки в
GDB командой set.
set editingset editing on- Включает редактирование командной строки (включено по умолчанию).
set editing off- Отключает редактирование командной строки.
show editing- Показывает, включено редактирование командной строки или нет.
История команд
GDB может отслеживать команды, которые вы вводите во время сеансов
отладки, чтобы вы могли точно знать, что происходило. Используйте
следующие команды для управления возможностями истории команд GDB.
set history filename имя-файла-
Устанавливает имя файла истории команд GDB в имя-файла.
Это файл, откуда GDB читает исходный список истории команд и куда он
записывает историю команд при выходе из данного сеанса. Вы можете
обращаться к этому списку через раскрывание истории или с помощью
символов редактирования истории команд, перечисленных ниже. По
умолчанию, этот файл есть значение переменной среды
GDBHISTFILE, или, если эта переменная не установлена,
`./.gdb_history'(`./_gdb_history'в MS-DOS). set history saveset history save on-
Записать историю команд в файл, имя которого может быть определено
командойset history filename. По умолчанию, эта возможность
отключена. set history save off- Прекратить запись истории команд в файл.
set history size размер-
Установить число команд, которые GDB хранит в своем списке
истории. Значение по умолчанию берется из переменной среды
HISTSIZE, или приравнивается 256, если эта переменная не установлена.
Раскрывание истории назначает специальное значение знаку !.
Так как ! является также оператором логического отрицания в Си,
раскрывание истории по умолчанию отключено. Если вы решите включить
раскрывание истории командой set history expansion on, вы должны
будете снабдить ! (когда он используется как логическое отрицание в
выражении) последующим пробелом или символом табуляции, чтобы предохранить
его от раскрывания. Средства истории Readline не делают попытки подстановки
на строках != и !(, даже когда раскрывание истории включено.
Вот команды управления раскрыванием истории:
set history expansion onset history expansion- Включить раскрывание истории. Раскрывание по умолчанию отключено.
set history expansion off-
Отключить раскрывание истории.
Библиотека Readline поставляется вместе с более полной
документацией по возможностям редактирования и раскрывания истории.
Пользователи, незнакомые с GNU Emacs илиvi, могут почитать ее. show historyshow history filenameshow history saveshow history sizeshow history expansion-
Эти команды отображают состояние параметров истории GDB.
Простоshow historyпоказывает все четыре состояния.
show commands-
Отобразить последние десять команд в истории.
show commands n- Вывести десять команд, расположенных вокруг команды с номером n.
show commands +- Вывести десять команд, расположенных сразу после последних выведенных.
Размер экрана
Определенные команды GDB могут выводить большое количество информации
на экран. Чтобы помочь вам всю ее прочитать, GDB приостанавливает вывод и
запрашивает ввод в конце каждой страницы вывода. Нажмите RET, когда вы
хотите продолжить вывод, или q для уничтожения оставшегося вывода.
Также, установка ширины экрана определяет, когда переносить строки
вывода. В зависимости от того, что выводится, GDB пытается
разбить стpоку в удобочитаемом месте, вместо того чтобы просто
продолжить ее на следующую строчку.
Обычно GDB узнает размер экрана из программы драйвера
терминала. Например, в Unix GDB использует базу данных
termcap, вместе со значением переменной среды TERM и
установками stty rows и stty cols. Если это неправильно,
вы можете заменить эти установки командами set height и
set width:
set height lppshow heightset width cplshow width-
Эти команды
setопределяют высоту экрана в lpp строк и ширину
в cpl знаков. Соответствующие командыshowотображают
текущие установки.
Если вы определите высоту в ноль строк, GDB не будет
останавливаться при выводе, независимо от того, насколько он длинный.
Это полезно, если вывод осуществляется в файл или буфер редактора.
Аналогично, вы можете определить `set width 0′, чтобы запретить
GDB переносить строки вывода.
Числа
Вы всегда можете вводить в GDB числа в восьмеричной,
десятичной, или шестнадцатеричной системе в соответствии c обычными
соглашениями: восьмеричные числа начинаются с `0′, десятичные числа
оканчиваются на `.’ и шестнадцатеричные числа начинаются с
`0x’. Числа, которые не начинаются ни c одного из этих знаков, по
умолчанию считаются десятичными; аналогично, отображение чисел по
умолчанию—если не определен никакой конкретный формат—осуществляется
по основанию 10. Командой set radix вы можете изменять
основание, устанавливаемое по умолчанию для ввода и вывода.
set input-radix основание-
Установить основание по умолчанию для числового ввода.
Поддерживаемые варианты для основания—8, 10 или 16. Само
основание должно быть определено либо недвусмысленно, либо с
использованием текущего основания системы счисления по умолчанию;
например, любая из командset radix 012 set radix 10. set radix 0xa
устанавливает десятичное основание. С другой стороны, `set radix
10′ оставляет основание системы счисления без изменений независимо от
того, каким оно было. set output-radix основание-
Установить основание по умолчанию для числового вывода.
Поддерживаемые варианты для основания—8, 10 или 16. Само
основание должно быть определено либо недвусмысленно, либо с
использованием текущего основания системы счисления по умолчанию. show input-radix- Отобразить текущее основание по умолчанию для числового ввода.
show output-radix- Отобразить текущее основание по умолчанию для числового вывода.
Необязательные предупреждения и сообщения
По умолчанию, GDB ничего не сообщает о своей внутренней
деятельности. Если вы работаете на медленной машине, то вы можете захотеть
использовать команду set verbose. Она велит GDB
сообщать вам, когда он выполняет длинную внутреннюю операцию, чтобы вы
не думали, что он завис.
В настоящее время, set verbose управляет только
сообщениями о чтении таблиц символов исходного файла; смотрите
section Команды для задания файлов, описание symbol-file.
set verbose on-
Разрешает GDB выводить опpеделенные информационные сообщения.
set verbose off- Отключает вывод GDB опpеделенных информационных сообщений.
show verbose-
Сообщает, установлено
set verboseвonилиoff.
По умолчанию, если GDB сталкивается с ошибками в таблице символов
объектного файла, он не сообщает об этом; но если вы отлаживаете
компилятор, эта информация может вам пригодиться (see section Ошибки чтения файлов с символами).
set complaints предел-
Позволяет GDB выводить предел сообщений о каждом типе
необычных символов прежде, чем пеpестать сообщать о проблеме. Установите
предел в ноль для подавления всех сообщений, или очень большим,
чтобы предотвратить подавление сообщений. show complaints- Выводит ограничение GDB на вывод сообщений о символах.
По умолчанию GDB осмотрителен, и задает, как иногда кажется,
множество глупых вопросов, чтобы подтвердить определенные команды.
Например, если вы пытаетесь выполнить программу, которая уже
выполняется:
(gdb) run The program being debugged has been started already. Start it from the beginning? (y or n)
Если вы неуклонно желаете сами разбираться с последствиями ваших собственных
команд, вы можете отключить эту «возможность»:
set confirm off-
Отключает запросы подтверждений.
set confirm on- Включает запросы подтверждений (по умолчанию).
show confirm- Показывает, выводятся ли запросы подтверждений.
Необязательные сообщения о внутренних событиях
set debug arch-
Включает и отключает вывод отладочной информации gdbarch. По умолчанию
отключено. show debug arch- Отображает текущее состояние вывода отладочной информации gdbarch.
set debug event-
Включает и отключает вывод отладочной информации о событиях
GDB. По умолчанию отключено. show debug event-
Отображает текущее состояние вывода отладочной информации о событиях
GDB. set debug expression-
Включает и отключает вывод отладочной информации о выражениях
GDB. По умолчанию отключено. show debug expression-
Отображает текущее состояние вывода отладочной информации о выражениях
GDB. set debug overload-
Включает и выключает вывод GDB отладочной информации о
перегруженных символах Си++. Это включает такую информацию, как
упорядочивание функций, и так далее. По умолчанию отключено. show debug overload-
Отображает текущее состояние вывода GDB отладочной информации о
перегруженных символах Си++. set debug remote-
Включает и выключает вывод отчета о всех пакетах, посланных вперед и
назад по последовательной линии удаленной машине. Информация печатается
в стандартный выходной поток GDB. По умолчанию отключено. show debug remote- Выводит состояние вывода удаленных пакетов.
set debug serial-
Включает и выключает вывод GDB отладочной информации о
последовательном соединении. По умолчанию отключено. show debug serial-
Отображает текущее состояние вывода GDB отладочной информации о
последовательном соединении. set debug target-
Включает и выключает вывод GDB отладочной информации о цели.
Эта включает информацию о том, что происходит на уровне цели
GDB. По умолчанию отключено. show debug target-
Отображает текущее состояние вывода GDB отладочной информации о
цели. set debug varobj-
Включает и отключает вывод GDB отладочной информации о
переменных объектах. По умолчанию отключено. show debug varobj-
Отображает текущее состояние вывода GDB отладочной информации о
переменных объектах.
Фиксированные последовательности команд
Кроме команд точки останова (see section Команды точки останова), GDB предоставляет два способа сохранить
последовательности команд для выполнения целиком:
определяемые пользователем команды и командные файлы.
Команды, определяемые пользователем
Команда, определяемая пользователем—это последовательность команд
GDB, которой вы назначаете имя, как новой команде. Это
осуществляется командой define. Пользовательские команды могут иметь
до 10 параметров, разделенных пробелами. Внутри команды пользователя,
доступ к параметрам производится посредством $arg0…$arg9.
Вот простой пример:
define adder print $arg0 + $arg1 + $arg2
Для выполнения команды используйте:
adder 1 2 3
Этот пример определяет команду adder, которая печатает сумму трех
своих параметров. Обратите внимание, что параметры являются текстовыми
подстановками, так что они могут ссылаться на переменные, использовать
сложные выражения или даже выполнять вызовы подчиненных функций.
define имя-команды-
Определить команду с именем имя-команды. Если команда
с таким именем уже имеется, у вас запрашивается подтверждение на ее
переопределение.
Определение команды состоит из других командных строк GDB,
которые задаются после командыdefine. Конец этих команд
отмечается стpокой, содержащейend. if-
Имеет один аргумент—вычисляемое выражение. Команда сопровождается
последовательностью команд, которые выполняются, если выражение истинно
(отлично от нуля). Затем может следовать необязательная стpока
else, сопровождаемая последовательностью команд, которые
выполняются только при ложном значении данного выражения. Конец списка
отмечается стpокой, содержащейend. while-
Синтаксис подобен
if: команда имеет один параметр, который
является вычисляемым выражением и должен сопровождаться командами,
по одной в стpоке, которые завершаютсяend. Выполнение команд
повторяется, пока выражение истинно. document имя-команды-
Описывает определенную пользователем команду имя-команды, так,
чтобы к ней можно было обращаться посредствомhelp. Команда
имя-команды должна быть определена ранее. Эта команда
считывает стpоки документации точно так же, какdefine
считывает стpоки определения команды, до строкиend. После
завершения командыdocument, написанная вами документация будет
отображаться командойhelpдля команды имя-команды.
Вы можете использовать командуdocumentнеоднократно, чтобы
изменить документацию команды. Переопределение команды посредством
defineне изменяет документации. help user-defined-
Перечислить все определенные пользователем команды, вместе с первой
строкой документации (если она есть). show usershow user имя-команды-
Вывести команды GDB, использовавшиеся для определения
имя-команды (но не ее документацию). Если имя-команды не
задано, вывести содержимое всех определенных пользователем команд.
При выполнении команд, определенных пользователем, команды
определения не печатаются. Ошибка в любой из них останавливает
выполнение всей определенной пользователем команды.
При использовании в интерактивном режиме, команды, обычно запрашивающие
подтверждение, выполняются без запроса, если они используется внутри
определенной пользователем команды. Многие команды GDB,
которые обычно печатают сообщения о своих действиях, опускают
их при использовании в команде, определенной пользователем.
Определяемые пользователем команды-ловушки
Вы можете определять ловушки, которые являются специальным
видом определяемых пользователем команд. Всякий раз, когда вы выполняете
команду `foo’, перед ней выполняется определенная пользователем команда
`hook-foo’ (без параметров), если она существует.
Кроме того, существует псевдокоманда `stop’. Определение
(`hook-stop’) велит выполняться связанным с ней командам при каждом
останове вашей программы: перед выполнением команд точек останова, перед
выводом на экран сообщений или кадров стека.
Например, чтобы игнорировать сигналы SIGALRM во время выполнения
в пошаговом режиме, но обрабатывать их при нормальном выполнении, вы
можете определить:
define hook-stop handle SIGALRM nopass end define hook-run handle SIGALRM pass end define hook-continue handle SIGLARM pass end
Вы можете определить ловушку для любой однословной команды
GDB, но не для синонимов команды; вам следует определить
ловушку для базового имени команды, например, backtrace, но не
bt. Если во время выполнения вашей ловушки возникает ошибка,
выполнение команд GDB останавливается, и
он выдает приглашение (до того, как введенная вами
команда начнет выполняться).
Если вы попытаетесь определить ловушку, не соответствующую никакой
известной команде, вы получите предупреждение от команды define.
Командные файлы
Командный файл для GDB—это файл, состоящий из строк с
командами GDB. Такие файлы могут также включать комментарии
(строки, начинающиеся с #). Пустая строка в командном файле
ничего не делает; она не означает повторение последней команды, как это
было бы при вводе с терминала.
Когда вы вызываете GDB, он автоматически выполняет команды из
своих файлов инициализации. Это файлы, называющиеся
`.gdbinit' в Unix и `gdb.ini' в DOS/Windows. Во время старта,
GDB делает следующее:
-
считывает файл инициализации (если он существует) в вашем
домашнем каталоге(18). - Обрабатывает ключи и операнды командной строки.
-
Считывает файл инициализации (если он существует) в текущем рабочем
каталоге. - Считывает командные файлы, заданные с помощью ключа `-x’.
Файл инициализации в вашем домашнем каталоге может
устанавливать параметры (такие как `set complaints’), которые влияют на
последующую обработку ключей и операндов командной строки. Файлы
инициализации не выполняются, если вы используете ключ `-nx’
see section Выбор режимов.
В некоторых конфигурациях GDB, файлу инициализации присваивается
другое имя (обычно это среды, где специализированная форма GDB должна
сосуществовать с другими формами, следовательно должно быть отличное
имя для файла инициализации специализированной версии). Следующие
среды используют специальные имена файлов инициализации:
-
VxWorks (ОС реального времени Wind River Systems):
`.vxgdbinit' -
OS68K (ОС реального времени Enea Data Systems):
`.os68gdbinit' -
ES-1800 (эмулятор Ericsson Telecom AB M68000):
`.esgdbinit'
Вы также можете запросить выполнение командного файла с помощью команды
source:
source имя-файла-
Выполнить командный файл имя-файла.
Строки командного файла выполняются последовательно, при этом они
не выводятся. Ошибка в любой команде завершает выполнение всего
командного файла.
Команды, запрашивающие подтверждение в интерактивном режиме, при
выполнении в командном файле выполняются без запросов. Многие
команды GDB, обычно выводящие сообщения о своих действиях,
опускают эти сообщения при вызове из командных файлов.
Команды для управляемого вывода
Во время выполнения командного файла или определенной пользователем
команды, нормальный вывод GDB подавляется; единственый появляющийся
вывод—тот, который производится явно командами из определения. В этом
разделе описываются три команды, полезные для получения именно такого
вывода, который вы хотите.
echo текст-
Напечатать текст. Непечатные знаки могут быть включены в
текст при помощи экранирующих последовательностей Си, таких как
`n’ для перехода на новую строку. Переход на новую строку
не печатается, если вы его не укажете. В дополнение к стандартным
экранирующим последовательностям Си, обратная косая черта, за
которой следует пробел, обозначает пробел. Это полезно для
отображения строки с пробелами в начале или конце, поскольку в противном
случае начальные и конечные пробелы удаляются из всех аргументов. Чтобы
напечатать ` and foo = ‘, используйте команду
`echo and foo = ‘.
Обратная косая черта в конце текста может использоваться, как и в
Си, для продолжения команды на последующие строки. Например,echo Вот пример текста,n который занимаетn несколько строк.n
производит такой же вывод как
echo Вот пример текста,n echo который занимаетn echo несколько строк.n
output выражение-
Напечатать значение выражения и ничего кроме него: никаких новых
строк, никаких `$nn = ‘. Значение также не заносится в
историю значений. See section Выражения, для дополнительной
информации о выражениях. output/формат выражение-
Вывести значение выражения в формате формат. Вы можете
использовать те же форматы, что и дляprint. See section Форматы вывода, для получения большей информации. printf строка, выражения...-
Напечатать значения выражений, причем формат вывода задает строка.
Выражения разделяются запятыми и могут быть либо числами, либо
указателями. Их значения печатаются так, как определяет строка,
в точности, как если бы ваша программа выполняла подпрограмму Сиprintf (строка, выражения...);
Например, вы можете напечатать два шестнадцатеричных значения:
printf "foo, bar-foo = 0x%x, 0x%xn", foo, bar-foo
Единственые экранирующие последовательности с обратной косой чертой,
которые вы можете использовать в строке формата—простые
последовательности, состоящие из обратной косой черты, за которой
следует буква.
Использование GDB под управлением GNU Emacs
Специальный интерфейс позволяет вам использовать GNU Emacs для
просмотра (и редактирования) исходных файлов программы, которую вы
отлаживаете с помощью GDB.
Чтобы использовать этот интерфейс, используйте команду M-x gdb в
Emacs. В качестве аргумента задайте выполняемый файл, который вы хотите
отладить. Эта команда вызывает GDB как подпроцесс Emacs с
вводом и выводом через заново созданный буфер.
Под управлением Emacs, GDB используется точно так же, как обычно,
за исключением двух моментов:
- Весь «терминальный» ввод и вывод происходит через буфер Emacs.
Это относится как к командам GDB и их выводу, так и к вводу и
выводу, производимыми отлаживаемой программой.
Это полезно, потому что вы можете копировать текст предыдущих команд и
вводить их снова; вы даже можете использовать таким образом части
вывода.
Все средства режима оболочки Emacs доступны для взаимодействия с
вашей программой. В частности, вы можете посылать сигналы обычным путем—
например, C-c C-c для прерывания, C-c C-z для остановки.
- GDB отображает исходный код через Emacs.
Каждый раз, когда GDB отображает кадр стека, Emacs
автоматически находит исходный файл для него и помещает стрелку
(`=>’) на левом крае текущей строки. Emacs использует отдельный
буфер для отображения исходного текста, и разделяет экран, чтобы
отобразить как сеанс GDB, так и исходный текст.
Тем не менее, явные команды GDB list и search
производят вывод как обычно, но у вас вероятно не будет причин
использовать их из Emacs.
Предупреждение: Если каталог, в котором находится ваша программа, не
является текущим, Emacs легко может ошибиться при определении
местонахождения исходных файлов; в этом случае вспомогательный буфер с
исходным текстом не появляется. GDB может искать программы, используя
переменную средыPATH, так что сеансы ввода и вывода
происходят нормально; но Emacs не получает достаточно информации
от GDB, чтобы найти исходные файлы в такой ситуации. Чтобы
избежать этой проблемы, либо запускайте режим GDB из каталога,
где находится ваша программа, либо укажите абсолютное имя файла, когда будет
запрошен параметр для M-x gdb.Подобная путаница может возникнуть, если вы используете команду
GDBfile, чтобы переключиться к отладке программы,
находящейся в каком-нибудь другом месте, из существующего буфера
GDB в Emacs.
По умолчанию, M-x gdb вызывает программу с именем `gdb'. Если вам
нужно вызвать GDB под другим именем (например, если вы храните
несколько конфигураций под различными именами), вы можете установить переменную
Emacs gdb-command-name; например, установка
(setq gdb-command-name "mygdb")
(которой предшествует M-: или ESC :, или если она введена в буфер
*scratch* или в вашем файле `.emacs'), заставит Emacs вызвать
программу «mygdb«.
В буфере ввода-вывода GDB, вы можете использовать следующие
специальные команды Emacs в дополнение к стандартным командам режима
оболочки:
- C-h m
- Описывает возможности режима GDB Emacs.
- M-s
-
Выполнить до другой строки исходного текста, подобно команде GDB
step; также обновляет окно отображения для показа текущего файла и
положения в нем. - M-n
-
Выполнить до следующей строки исходного текста в этой функции,
пропуская все вызовы функций, подобно команде GDBnext.
Затем обновить окно отображения, чтобы показать текущий файл и положение
в нем. - M-i
-
Выполнить одну инструкцию, подобно команде GDB
stepi;
обновляет окно отображения. - M-x gdb-nexti
-
Выполнить до следующей инструкции, используя команду GDB
nexti; обновляет окно отображения. - C-c C-f
-
Выполнить до выхода из выбранного кадра стека, подобно команде
GDBfinish. - M-c
-
Продолжить выполнение вашей программы, подобно команде GDB
continue.
Предупреждение: В Emacs версии 19, эта команда вызывается
посредством C-c C-p. - M-u
-
Подняться вверх по стеку на число кадров, заданное числовым параметром,
подобно команде GDBup
(see section `Числовые аргументы’ in Руководство по GNU Emacs).
Предупреждение: В Emacs версии 19, эта команда вызывается
посредством C-c C-u. - M-d
-
Спуститься вниз по стеку на число кадров, заданное числовым параметром,
аналогично команде GDBdown.
Предупреждение: В Emacs версии 19, эта команда вызывается
посредством C-c C-d. - C-x &
-
Прочитать число в позиции курсора и вставить его в конец буфера
ввода-вывода GDB. Например, если вы хотите дисассемблировать код
по адресу, отображенному ранее, наберите disassemble; затем
переместите курсор на изображение адреса и задайте аргумент для
disassemble, набрав C-x &.
Вы можете и дальше настраивать это, определяя элементы списка
gdb-print-command; если он определен, вы можете форматировать или
как-либо иначе обрабатывать числа, задаваемые C-x &, перед их вставкой
в буфер. Числовой аргумент к C-x & показывает, что вам нужно
специальное форматирование, а также действует как индекс для выбора
элемента из списка. Если элемент списка является строкой, то вставляемое
число форматируется с использованием функции Emacsformat; в
противном случае, число передается как параметр соответствующему
элементу списка.
В любом исходном файле, команда Emacs C-x SPC (gdb-break)
велит GDB установить точку останова на строке исходного текста,
в которой находится точка.
Если вы случайно удалите буфер отображения исходного текста, его можно легко
вернуть обратно, введя команду f в буфере GDB, чтобы запросить
отображение кадра; когда выполнение происходит под управлением Emacs,
это при необходимости создает исходный буфер заново, чтобы показать вам
текущий кадр.
Исходные файлы, отображаемые в Emacs, находятся в обычных буферах
Emacs, которые получают доступ к исходным файлам обычным способом. При
желании вы можете редактировать файлы в этих буферах; но помните,
что GDB взаимодействует с Emacs в терминах номеров строк.
Если вы добавите или удалите строки из текста, известные GDB
номера строк больше не будут соответствовать коду.
Примечания GDB
Эта глава описывает примечания в GDB.
Примечания разработаны для согласования GDB с
графическими интерфейсами пользователя или другими аналогичными
программами, которые хотят взаимодействовать с GDB на
относительно высоком уровне.
Что такое примечание?
Чтобы создавать примечания, запустите GDB с ключем
--annotate=2.
Примечания начинаются с символа новой строки, двух символов
`control-z’ и имени примечания. Если нет дополнительной
информации, связанной с примечанием, непосредственно за его именем следует
символ новой строки. Если дополнительная информация есть, за именем
примечания следует пропуск, дополнительная информация и символ новой
строки. Дополнительная информация не может содержать символа новой
строки.
Любой вывод, не начинающийся с символа новой строки и двух
`control-z’, означает буквальный вывод GDB. В настоящее
время GDB не нужно выводить два `control-z’ вслед за
символом новой строки, но если это понадобится, примечания могут быть
расширены `экранирующим’ примечанием, которое означает вывод этих
трех символов.
Вот простой пример запуска GDB с примечаниями:
$ gdb --annotate=2 GNU GDB 5.0 Copyright 2000 Free Software Foundation, Inc. GDB is free software, covered by the GNU General Public License, and you are welcome to change it and/or distribute copies of it under certain conditions. Type "show copying" to see the conditions. There is absolutely no warranty for GDB. Type "show warranty" for details. This GDB was configured as "sparc-sun-sunos4.1.3" ^Z^Zpre-prompt (gdb) ^Z^Zprompt quit ^Z^Zpost-prompt $
Здесь `quit’ является для GDB вводом; остальное—вывод
GDB. Три строки, начинающиеся с `^Z^Z’ (где `^Z’
означает знак `control-z’), суть примечания; остальное является
выводом GDB.
Префикс server
Чтобы подать команду GDB, не оказывая влияния на определенные
аспекты состояния, видимые для пользователей, начните ее с `server ‘.
Это означает, что данная команда не воздействует на историю команд, а также
не влияет на понятие GDB о том, какую команду повторять, если
в пустой строке нажата клавиша RET.
Префикс server не влияет на запись значений в историю значений; чтобы
напечатать значение, не занося его в историю, используйте команду
output вместо print.
Значения
Когда значение выводится в различных контекстах, GDB использует
примечания, чтобы отделить его от окружающего текста.
Если значение выводится с помощью print и добавляется в историю
значений, примечание выглядит так:
^Z^Zvalue-history-begin номер-в-истории флаги-значения строка-истории ^Z^Zvalue-history-value значение ^Z^Zvalue-history-end
где номер-в-истории—номер, который значение получает в истории,
строка-истории—строка, такая как `$5 = ‘, которая
представляет значение пользователю, значение является выводом,
соответствующим самому значению, а флаги-значения—`*’ для
значения, которое может быть разыменовано, и `-‘, если нет.
Если значение не добавляется в историю значений (это может быть или неверное
число с плавающей точкой, или оно выводится командой output),
примечание выглядит похожим образом:
^Z^Zvalue-begin флаги-значения значение ^Z^Zvalue-end
Когда GDB выводит аргумент функции (например, в выводе команды
backtrace), он делает такие примечания:
^Z^Zarg-begin имя-аргумента ^Z^Zarg-name-end строка-разделитель ^Z^Zarg-value флаги-значения значение ^Z^Zarg-end
где имя-аргумента есть имя аргумента,
строка-разделитель—текст (такой как `=’), который отделяет
имя от значения для удобства пользователя, а флаги-значения и
значение имеют такой же смысл, что и в примечании
value-history-begin.
При выводе структуры, GDB делает следующие примечания:
^Z^Zfield-begin флаги-значения имя-поля ^Z^Zfield-name-end строка-разделитель ^Z^Zfield-value значение ^Z^Zfield-end
где имя-поля есть имя поля, строка-разделитель—текст
(такой как `=’), который отделяет имя от значения для удобства
пользователя, а флаги-значения и значение имеют тот же
смысл, что и в примечании value-history-begin.
При выводе массива, GDB делает следующие примечания:
^Z^Zarray-section-begin индекс-в-массиве флаги-значения
где индекс-в-массиве—индекс первого аннотируемого элемента, а
флаги-значения имеют такой же смысл, что и в примечании
value-history-begin. За этим следует произвольное число
элементов. Элемент может быть либо одиночным
`,' пропуск ; опускается для первого элемента значение ^Z^Zelt
либо повторяющимся
`,' пропуск ; опускается для первого элемента значение ^Z^Zelt-rep число-повторений строка-повторений ^Z^Zelt-rep-end
В обоих случаях, значение является выводом значения элемента, а
пропуск может содержать пробелы, символы табуляции и новой
строки. В случае повторяющихся элементов, число-повторений
представляет число последовательных элементов массива, которые содержат
данное значение, а строка-повторений является строкой, которая
предназначена для уведомления пользователя о том, что выводятся
повторяющиеся элементы.
После того, как выведены все элементы массива, примечание к массиву
заканчивается так:
^Z^Zarray-section-end
Кадры
Когда GDB печатает кадр, он делает к нему примечания.
Например, это применяется к кадрам, выводимым при остановке GDB,
в результате вывода командами, такими как backtrace или
up, и так далее.
Примечания к кадру начинаются с
^Z^Zframe-begin уровень адрес строка-уровня
где уровень—это номер кадра (0 для самого внутреннего кадра,
другие кадры имеют положительные номера), адрес—это адрес кода,
выполняющегося в данном кадре, а строка-уровня—строка,
предназначенная для передачи уровня пользователю. Адрес имеет
форму `0x’, за которым следует одна или более шестнадцатеричных
цифр в нижнем регистре (заметьте, что это не зависит от языка). Кадр
заканчивается так:
^Z^Zframe-end
Между этими комментариями находится основное тело кадра, которое может
состоять из
-
^Z^Zfunction-call строка-вызова-функции
где строка-вызова-функции является текстом, предназначенным для
уведомления пользователя, что этот кадр связан с вызовом функции,
который GDB сделал в отлаживаемой программе. -
^Z^Zsignal-handler-caller строка-вызова-обработчика-сигнала
где строка-вызова-обработчика-сигнала—текст, предназначенный для
уведомления пользователя, что этот кадр связан с тем механизмом, который
использовался операционной системой при вызове обработчика сигнала
(это тот кадр, из которого произошел вызов обработчика, а не кадр для
самого обработчика). -
Обычный кадр.
Это может, возможно (в зависимости от того, считается ли это информацией,
интересной для пользователя), начинаться с^Z^Zframe-address адрес ^Z^Zframe-address-end строка-разделитель
здесь адрес—это адрес, где происходит выполнение в кадре (тот же
адрес, что и в примечанииframe-begin, но выведенный в форме,
предназначенной для пользователя—в частности, синтаксис различается в
зависимости от языка), а строка-разделитель является строкой,
предназначенной для отделения этого адреса от того, что за ним следует
для удобства пользователя.Затем идет
^Z^Zframe-function-name имя-функции ^Z^Zframe-args аргументы
где имя-функции есть имя функции, выполняющейся в кадре, или
`??’, если оно не известно, а аргументы—это аргументы к
кадру, со скобками вокруг них (каждый аргумент аннотируется также
индивидуально, see section Значения).Если доступна информация об исходных текстах, печатается ссылка на них:
^Z^Zframe-source-begin вводная-исходная-строка ^Z^Zframe-source-file имя-файла ^Z^Zframe-source-file-end : ^Z^Zframe-source-line номер-строки ^Z^Zframe-source-end
где вводная-исходная-строка отделяет ссылку от предшествуещего ей
текста, для удобства пользователя, имя-файла—это имя исходного
файла, номер-строки—номер строки в этом файле (первая строка
имеет номер 1).Если GDB печатает некоторую информацию о том, откуда появился
этот кадр (какая библиотека, какой сегмент загрузки, и так далее; в
настоящее время реализовано только на RS/6000), он делает такие
примечания:^Z^Zframe-where информация
Затем, если исходный текст действительно должен быть отображен для этого
кадра (например, это не верно для вывода от командыbacktrace),
тогда выводится примечаниеsource(see section Вывод исходного текста). В отличие от большинства примечаний, этот вывод производится
вместо обычного текста, который был бы напечатан, а не в дополнение к нему.
Отображения
Когда GDB велят отобразить что-то с помощью команды
display, к результату отображения делаются примечания:
^Z^Zdisplay-begin номер ^Z^Zdisplay-number-end разделитель-номеров ^Z^Zdisplay-format формат ^Z^Zdisplay-expression выражение ^Z^Zdisplay-expression-end разделитель-выражений ^Z^Zdisplay-value значение ^Z^Zdisplay-end
здесь номер—это номер отображения, разделитель-номеров
предназначен для отделения номеров от того, что следует затем для
пользователя, формат включает информацию о том, как отображается
значение, такую как размер, формат и так далее, выражение—это
отображаемое выражение, разделитель-выражений предназначен для
отделения выражения от следующего за ним текста для пользователя, и
значение—это действительное значение, которое отображается.
Примечания ко вводу GDB
Когда GDB выводит приглашение для ввода, он делает к этому
примечания, так что становится возможным узнать, когда посылать данные,
когда закончен вывод от данной команды, и так далее.
Каждый из различных видов ввода имеет различный тип ввода. Каждый
тип ввода имеет три примечания: примечание pre-, обозначающее
начало каждого выводимого приглашения, простое примечание, обозначающее
конец приглашения, и затем примечание post-, обозначающее конец
любого эхо, которое может быть ассоциировано (а может и не быть) со
вводом. Например, характерной чертой типа ввода prompt являются
следующие примечания:
^Z^Zpre-prompt ^Z^Zprompt ^Z^Zpost-prompt
Существуют следующие типы ввода:
prompt-
Когда GDB запрашивает команду (главное приглашение GDB).
commands-
Когда GDB запрашивает набор команд, как в команде
commands.
Примечания повторяются для каждой введенной команды. overload-choice-
Когда GDB хочет, чтобы пользователь выбрал одну из нескольких
перегруженных функций. query-
Когда GDB хочет, чтобы пользователь подтвердил потенциально
опасное действие. prompt-for-continue-
Когда GDB запрашивает у пользователя нажатие ввода для
продолжения. Замечание: не ожидайте, что это будет работать хорошо;
используйте вместо этогоset height 0для отключения приглашений.
Это происходит потому, что при наличии примечаний подсчет строк
происходит неверно.
Ошибки
^Z^Zquit
Это примечание появляется непосредственно перед тем, как GDB
отвечает на прерывание.
^Z^Zerror
Это примечание появляется сразу перед тем, как GDB отвечает на
ошибку.
Примечания выхода и ошибки обозначают, что любое примечание, в середине
которого находился GDB, могут внезапно оборваться. Например,
если за примечанием value-history-begin следует error, то
не нужно ожидать соответствующий value-history-end. Однако, не
следует также ожидать, что его точно не будет; примечание об ошибке не
обязательно означает, что GDB немедленно возвращается в начало
на самый верхний уровень.
Примечанию к ошибке или выходу может предшествовать
^Z^Zerror-begin
Весь вывод между этим и примечанием к ошибке или выходу является
сообщением об ошибке.
Пока примечаний к предупреждающим сообщениям не делается.
Информация о точке останова
К выводу, производимому командой info breakpoints, делаются
следующие примечания:
^Z^Zbreakpoints-headers элемент-заголовка ^Z^Zbreakpoints-table
где элемент-заголовка имеет тот же синтаксис, что и элемент
(смотрите ниже), но вместо данных, он содержит строки, которые
предназначены для разъяснения пользователю значений каждого поля. Затем
следует произвольное число элементов. Если поле не подходит к этому
элементу, оно опускается. Поля могут содержать завершающие пропуски.
Каждое поле состоит из:
^Z^Zrecord ^Z^Zfield 0 номер ^Z^Zfield 1 тип ^Z^Zfield 2 положение ^Z^Zfield 3 включена ^Z^Zfield 4 адрес ^Z^Zfield 5 что ^Z^Zfield 6 кадр ^Z^Zfield 7 условие ^Z^Zfield 8 счетчик-игнорирований ^Z^Zfield 9 команды
Заметьте, что адрес предназначен для использования
пользователем—синтаксис различается в зависимости от языка.
Вывод заканчивается так:
^Z^Zbreakpoints-table-end
Сообщения о недостоверности
Следующие примечания говорят о том, что определенные куски информации,
описывающие состояние, могли измениться.
^Z^Zframes-invalid-
Кадры (например, вывод команды
backtrace) могли измениться. ^Z^Zbreakpoints-invalid-
Точки останова могли измениться. Например, пользователь только что
добавил или удалил точку останова.
Выполнение программы
Когда программа начинает выполняться вследствие команды
GDB, такой как step или continue, выводится
^Z^Zstarting
Когда программа останавливается, выводится
^Z^Zstopped
Перед примечанием stopped, множество примечаний описывают, как
программа остановилась.
^Z^Zexited код-выхода-
Программа завершилась, и код-выхода является кодом выхода
(ноль при успешном завершении, в противном случае не ноль). ^Z^Zsignalled-
Программа завершилась по сигналу. После
^Z^Zsignalled, примечания
продолжаются:вступительный-текст ^Z^Zsignal-name имя ^Z^Zsignal-name-end текст-в-середине ^Z^Zsignal-string строка ^Z^Zsignal-string-end заключительный-текст
где имя является именем сигнала, таким как
SIGILLили
SIGSEGV, а строка представляет объяснение сигнала, такое как
Illegal InstructionилиSegmentation fault.
Вступительный-текст, текст-в-середине и заключительный
текст используются для удобства пользователя и не имеют определенного
формата. ^Z^Zsignal-
Синтаксис этого примечания такой же, как для
signalled, но
GDB сообщает, что программа лишь получила сигнал, а не то, что
она остановилась из-за него. ^Z^Zbreakpoint номер- Программа достигла точки останова с номером номер.
^Z^Zwatchpoint номер- Программа достигла точки наблюдения с номером номер.
Вывод исходного текста
Следующие примечания используются вместо вывода исходного текста:
^Z^Zsource имя-файла:строка:символ:middle:адрес
где имя-файла указывает абсолютное имя файла,
строка—это номер строки в этом файле (первая строка имеет номер 1),
символ—позиция символа в файле (первый символ в исходном файле
имеет номер 0) (для большинства отладочных форматов это будет
обязательно указывать на начало строки), middle есть
`middle’, если адрес находится в середине строки, или
`beg’, если адрес находится в начале строки, а адрес
является адресом в целевой программе, ассоциированным с выводимым
исходным текстом. Адрес записан в форме `0x’, за которым
следует одна или несколько шестнадцатеричных цифр в нижнем регистре
(заметьте, что это не зависит от языка).
Примечания, которые могут понадобиться с будущем
- target-invalid
цель могла измениться (регистры, содержимое памяти или статус
выполнения). Для эффективности выполнения, мы можем захотеть
определять `register-invalid' и `all-register-invalid' с большей
точностью
- систематические примечания к параметрам set/show (включая
сообщения о недостоверности).
- аналогично, `info' возвращает список кандидатов на сообщение о
недостоверности.
Интерфейс GDB/MI
Назначение и цель
GDB/MI является построчным, машинно-ориентированным текстовым
интерфейсом к GDB. Он предназначен специально для поддержки
разработки систем, которые используют отладчик лишь как одну маленькую
компоненту большой системы.
Эта глава является спецификацией интерфейса GDB/MI. Она написана в
форме справочного руководства.
Заметьте, что GDB/MI все еще находится в стадии разработки, так что
некоторые описанные ниже возможности являются неполными и могут быть изменены.
Система обозначений и терминология
Эта глава использует следующую систему обозначений:
-
|разделяет две альтернативы. -
[ нечто ]указывает, что нечто является
необязательным: оно может быть задано, а может и нет. -
( группа )*означает, что группа в скобках может
повторяться ноль и более раз. -
( группа )+означает, что группа в скобках может
повторяться один и более раз. -
"строка"обозначает текст строка.
Выражения признательности
В алфавитном порядке: Елена Заннони, Эндрю Кагни, Фернандо Нассер и
Стан Шебс.
Синтаксис команд GDB/MI
Входной синтаксис GDB/MI
команда ==>-
команда-cli | команда-mi команда-cli ==>-
[ лексема ] команда-cli nl, где
команда-cli есть любая существующая команда GDB CLI. команда-mi ==>-
[ лексема ] "-" действие ( " " ключ )*» —»
[]( » » параметр )* nl лексема ==>- «любая последовательность цифр»
ключ ==>-
"-" параметр [ " " параметр ] параметр ==>-
непустая-последовательность | строка-си действие ==>- любое из действий, описанных в этой главе
непустая-последовательность ==>-
все что угодно, не содержащее специальных знаков, таких как
«-«, nl, «»» и, конечно, » « строка-си ==>-
""" содержимое-семибитной-строки-iso-си """ nl ==>-
CR | CR-LF
Замечания:
-
Команды CLI все еще обрабатываются интерпретатором MI; их вывод
описан ниже. -
Лексема, если присутствует, передается назад, когда
выполнение команды завершается. -
Некоторые команды MI допускают необязательные аргументы как часть
списка параметров. Каждый ключ идентифицируется предшествующей ему
чертой `-‘, и за ним может следовать в качестве параметра
необязательный аргумент. Ключи появляются в начале списка параметров и
могут быть отделены от обычных параметров при помощи `—‘ (это
полезно, когда некоторые параметры начинаются с черты).
Прагматические соображения:
- Мы хотим получить простой доступ к существующему синтаксису CLI (для отладки).
- Мы хотим, чтобы работа MI была легко заметна.
Выходной синтаксис GDB/MI
Вывод GDB/MI состоит из нуля или более внеочередных
записей, за которыми может следовать одна результирующая запись. Эта
запись относится к самой последней команде. Последовательность
выводимых записей завершается `(gdb)’.
Если входная команда начиналась с префикса лексема, то
соответствующий вывод для этой команды также будет начинаться с того же
префикса лексема.
вывод ==>-
( внеочередная-запись )* [ результирующая-запись ] "(gdb)" nl результирующая-запись ==>-
[ лексема ] "^" результирующий-класс ( "," результат )* nl внеочередная-запись ==>-
асинхр-запись | поточн-запись асинхр-запись ==>-
асинхр-вывод-выполн | асинхр-вывод-статуса | асинхр-вывод-уведомл асинхр-вывод-выполн ==>-
[ лексема ] "*" асинхр-вывод асинхр-вывод-статуса ==>-
[ лексема ] "+" асинхр-вывод асинхр-вывод-уведомл ==>-
[ лексема ] "=" асинхр-вывод асинхр-вывод ==>-
асинхр-класс ( "," результат )* nl результ-класс ==>-
"done" | "running" | "connected" | "error" | "exit" асинхр-класс ==>-
"stopped" | другое(где другое будет добавлено
по необходимости—это все еще находится в стадии разработки). результат ==>-
[ строка "=" ] значение значение ==>-
константа | "{" результат ( "," результат )* "}" константа ==>-
строка-си поточн-запись ==>-
консольн-поточн-вывод | целев-поточн-вывод | журн-поточн-вывод консольн-поточн-вывод ==>-
"~" строка-си целев-поточн-вывод ==>-
"@" строка-си журн-поточн-вывод ==>-
"&" строка-си nl ==>-
CR | CR-LF лексема ==>- любая последовательность цифр.
Кроме того, следующее все еще находится в стадии разработки:
запрос- Это действие пока не определено.
Замечания:
-
Все выходные последовательности заканчиваются одной строкой, содержащей
точку. -
Лексемаберется из соответствующего запроса. Если
выполнение команды прерывается командой `-exec-interrupt’,
лексема, ассоциированная с сообщением `*stopped’, является
лексемой исходной выполняемой команды, а не лексемой
команды прерывания. -
Асинхр-вывод-статуса содержит последующую информацию состояния о
выполнении медленной операции. Она может быть отброшена. Весь вывод
состояния начинается с префикса `+’. -
Асинхр-вывод-выполн содержит асинхронное изменения состояния на цели
(остановлена, запущена, исчезла). Весь асинхронный вывод начинается с
префикса `*’. -
Асинхр-вывод-уведомл содержит сопровождающую информацию, которую
должен обработать клиент (например, информацию о новой точке останова).
Весь уведомительный вывод начинается с префикса `=’. -
Консольн-поточн-вывод является выводом, который должен быть
отображен на консоли без изменений. Он является текстовым
ответом на команду CLI. Весь консольный вывод начинается с префикса
`~’. -
Целев-поточн-вывод является выводом, произведенным целевой
программой. Весь целевой вывод начинается с префикса `@’. -
Журн-поточн-вывод является выходным текстом, происходящим от
внутренней реализации GDB, например, сообщения, которые должны
быть отображены как часть журнала ошибок. Весь журнальный вывод
начинается с префикса `&’.
See section Поточные записи GDB/MI, для
более подробной информации о различных выводимых записях.
See section Черновик изменений к выходному синтаксису GDB/MI, для предлагаемых изменений
к выходному синтаксису.
Простые примеры взаимодействия с GDB/MI
Этот подраздел представляет несколько простых примеров взаимодействия с
использованием интерфейса GDB/MI. В этих примерах, `->’
означает, что следующая строка передается GDB/MI в качестве ввода,
а `<-‘ означает вывод, полученный от GDB/MI.
Останов цели
Вот пример останова подчиненного процесса:
-> -stop <- (gdb)
и затем:
<- *stop,reason="stop",address="0x123",source="a.c:123" <- (gdb)
Простая команда CLI
Вот пример простой команды CLI, передаваемой ему через GDB/MI.
-> print 1+2 <- ~3n <- (gdb)
Команда с побочными эффектами
-> -symbol-file xyz.exe <- *breakpoint,nr="3",address="0x123",source="a.c:123" <- (gdb)
Плохая команда
Вот что происходит, если вы передаете несуществующую команду:
-> -rubbish <- error,"Rubbish not found" <- (gdb)
Совместимость GDB/MI с CLI
Чтобы помочь пользователям, знакомым с существующим в GDB
интерфейсом CLI, GDB/MI принимает существующие команды CLI.
Как определено синтаксисом, такие команды могут быть непосредственно
введены в интерфейс GDB/MI, и GDB будет отвечать.
Этот механизм предоставляется для помощи разработчикам клиентов
GDB/MI, а не как надежный интерфейс к CLI. Так как команда
интерпретируется в среде, которая подразумевает поведение GDB/MI,
точные результаты таких команд в конечном итоге скорее всего
станут неудобоваримой смесью вывода GDB/MI и CLI.
Выходные записи GDB/MI
Результирующие записи GDB/MI
В дополнение к множеству внеочередных уведомлений, ответ на команду
GDB/MI включает один из следующих указателей результата:
"^done" [ "," результаты ]-
Синхронная операция прошла успешно, возвращаемыми значениями являются
результаты. "^running"-
Асинхронная операция была успешно начата. Цель выполняется.
"^error" "," строка-си-
Операция завершилась с ошибкой.
Строка-сисодержит
соответствующее сообщение об ошибке.
Поточные записи GDB/MI
GDB хранит число выходных потоков: консоль, цель и журнал.
Вывод, предназначенный для этих потоков, пропускается через интерфейс
GDB/MI при помощи поточных записей.
Каждая поточная запись начинается с уникального префиксного
символа, который идентифицирует свой поток (see section Выходной синтаксис GDB/MI). Помимо префикса, каждая
поточная запись содержит строку-вывод. Это либо простой
текст (с подразумеваемым знаком новой строки), или Си-строка в кавычках
(которая не содержит подразумеваемого знака новой строки).
"~" строка-вывод-
Консольный поток вывода содержит текст, который должен быть отображен в
консольном окне CLI. Он содержит текстовые ответы на команды CLI. "@" строка-вывод-
Целевой поток вывода содержит произвольный текстовый вывод от
выполняемой цели. "&" строка-вывод-
Журнальный поток содержит отладочные сообщения, которые создает сам
GDB.
Внеочередные записи GDB/MI
Внеочередные записи используются для уведомления клиента GDB/MI
о произошедших дополнительных изменениях. Эти изменения могут либо
исходить от GDB/MI (например, измененная точка останова), либо быть
результатом действий цели (например, цель остановилась).
Ниже приведен предварительный список возможных внеочередных записей.
"*" "stop"
Формат описания команд GDB/MI
Оставшиеся разделы описывают блоки команд. Каждый блок команд
схематично аналогичен этому разделу.
Заметьте, что разбиения строк в примерах присутствуют только для
удобства чтения. Они не появляются в реальном выводе. Учтите также,
что команды с недоступными примерами (Н.П.) еще не реализованы.
Мотивация
Мотивация для этого набора команд.
Введение
Краткое введение в этот набор команд в целом.
Команды
Для каждой команды в блоке, описано следующее:
Краткое описание
-command арг...
Команда GDB
Соответствующая команда CLI GDB.
Результат
Внеочередные сообщения
Примечания
Пример
Команды GDB/MI для таблицы точек останова
Этот раздел описывает команды GDB/MI для управления точками
останова.
Команда -break-after
Краткое описание
-break-after номер число
Точка останова с номером номер не срабатывает, пока она не будет
достигнута число раз. Чтобы увидеть, как это отражается на выводе
команды `-break-list’, смотрите ниже описание команды
`-break-list’.
Команда GDB
Соответствующей командой GDB является `ignore’.
Пример
(gdb)
-break-insert main
^done,bkpt={number="1",addr="0x000100d0",file="hello.c",line="5"}
(gdb)
-break-after 1 3
~
^done
(gdb)
-break-list
^done,BreakpointTable={hdr={"Num","Type","Disp","Enb","Address","What"},
bkpt={number="1",type="breakpoint",disp="keep",enabled="y",
addr="0x000100d0",func="main",file="hello.c",line="5",times="0",
ignore="3"}}
(gdb)
Команда -break-condition
Краткое описание
-break-condition номер выраж
Точка останова номер остановит программу, только если условие
выраж истино. Условие становится частью вывода `-break-list’
(смотрите ниже описание команды `-break-list’).
Команда GDB
Соответствующей командой GDB является `condition’.
Пример
(gdb)
-break-condition 1 1
^done
(gdb)
-break-list
^done,BreakpointTable={hdr={"Num","Type","Disp","Enb","Address","What"},
bkpt={number="1",type="breakpoint",disp="keep",enabled="y",
addr="0x000100d0",func="main",file="hello.c",line="5",cond="1",
times="0",ignore="3"}}
(gdb)
Команда -break-delete
Краткое описание
-break-delete ( точка-останова )+
Удалить точки останова, чьи номера указаны в списке аргументов. Это,
очевидно, отражается на списке точек останова.
Команда GDB
Соответствующей командой GDB является `delete’.
Пример
(gdb)
-break-delete 1
^done
(gdb)
-break-list
^done,BreakpointTable={}
(gdb)
Команда -break-disable
Краткое описание
-break-disable ( точка-останова )+
Отключить упомянутые точки-останова. Для указанных
точек-останова поле `enabled’ в списке точек останова
теперь установлено в `n’.
Команда GDB
Соответствующей командой GDB является `disable’.
Пример
(gdb)
-break-disable 2
^done
(gdb)
-break-list
^done,BreakpointTable={hdr={"Num","Type","Disp","Enb","Address","What"},
bkpt={number="2",type="breakpoint",disp="keep",enabled="n",
addr="0x000100d0",func="main",file="hello.c",line="5",times="0"}}
(gdb)
Команда -break-enable
Краткое описание
-break-enable ( точка-останова )+
Включить (ранее отключенные) точки-останова.
Команда GDB
Соответствующей командой GDB является `enable’.
Пример
(gdb)
-break-enable 2
^done
(gdb)
-break-list
^done,BreakpointTable={hdr={"Num","Type","Disp","Enb","Address","What"},
bkpt={number="2",type="breakpoint",disp="keep",enabled="y",
addr="0x000100d0",func="main",file="hello.c",line="5",times="0"}}
(gdb)
Команда -break-info
Краткое описание
-break-info точка-останова
Получить информацию об одной точке останова.
Команда GDB
Соответствующей командой GDB является `info break
точка-останова‘.
Пример
Н.П.
Команда -break-insert
Краткое описание
-break-insert [ -t ] [ -h ] [ -r ]
[ -c условие ] [ -i счетчик-игнорирований ]
[ -p нить ] [ строка | адрес ]
Строка, если указана, может быть одной из:
- функция
- имя-файла:номер-строки
- имя-файла:функция
- *адрес
Вот возможные необязательные параметры этой команды:
- `-t’
- Вставить временную точку останова.
- `-h’
- Вставить аппаратную точку останова.
- `-c условие‘
- Сделать точку останова условной с заданным условием.
- `-i счетчик-игнорирований‘
- Инициализировать счетчик-игнорирований.
- `-r’
-
Вставить обычную точку останова во всех функциях, чьи имена
удовлетворяют данному регулярному выражению. Другие флаги к регулярному
выражению неприменимы.
Результат
Результат имеет форму:
^done,bkptno="номер",func="имя-функции", file="имя-файла",line="ном-строки"
где номер является номером этой точки останова в GDB,
имя-функции—имя функции, в которой была вставлена точка
останова, имя-файла—имя исходного файла, в котором находится эта
функция, а ном-строки является номером строки исходного текста в
этом файле.
Замечание: этот формат может изменяться.
Команда GDB
Соответстующими командами GDB являются `break’,
`tbreak’, `hbreak’, `thbreak’ и `rbreak’.
Пример
(gdb)
-break-insert main
^done,bkpt={number="1",addr="0x0001072c",file="recursive2.c",line="4"}
(gdb)
-break-insert -t foo
^done,bkpt={number="2",addr="0x00010774",file="recursive2.c",line="11"}
(gdb)
-break-list
^done,BreakpointTable={hdr={"Num","Type","Disp","Enb","Address","What"},
bkpt={number="1",type="breakpoint",disp="keep",enabled="y",
addr="0x0001072c", func="main",file="recursive2.c",line="4",times="0"},
bkpt={number="2",type="breakpoint",disp="del",enabled="y",
addr="0x00010774",func="foo",file="recursive2.c",line="11",times="0"}}
(gdb)
-break-insert -r foo.*
~int foo(int, int);
^done,bkpt={number="3",addr="0x00010774",file="recursive2.c",line="11"}
(gdb)
Команда -break-list
Краткое описание
-break-list
Отображает список установленных точек останова, показывая следующие
поля:
- `Number’
- номер точки останова
- `Type’
- тип точки останова: `breakpoint’ или `watchpoint’
- `Disposition’
-
эта точка останова должна быть удалена или отключена при срабатывании:
`keep’ или `nokeep’ - `Enabled’
- включена точка останова или нет: `y’ или `n’
- `Address’
- местоположение в памяти, где установлена точка останова
- `What’
-
логическое положение точки останова, выраженное именем функции, именем
файла, номером строки - `Times’
- Число раз, которое точка останова срабатывала
Если точек останова или наблюдения нет, поле BreakpointTable является
пустым списком.
Команда GDB
Соответствующей командой GDB является `info break’.
Пример
(gdb)
-break-list
^done,BreakpointTable={hdr={"Num","Type","Disp","Enb","Address","What"},
bkpt={number="1",type="breakpoint",disp="keep",enabled="y",
addr="0x000100d0",func="main",file="hello.c",line="5",times="0"},
bkpt={number="2",type="breakpoint",disp="keep",enabled="y",
addr="0x00010114",func="foo",file="hello.c",line="13",times="0"}}
(gdb)
Вот пример результата, когда точек останова нет:
(gdb)
-break-list
^done,BreakpointTable={}
(gdb)
Команда -break-watch
Краткое описание
-break-watch [ -a | -r ]
Создать точку наблюдения. С ключем `-a’ будет создана точка
наблюдения за доступом, то есть такая точка наблюдения, которая
срабатывает либо при чтении, либо при записи в определенное
местоположение в памяти. С ключем `-r’ созданная точка наблюдения
будет точкой наблюдения за чтением, то есть она будет срабатывать
только когда к определенному местоположению в памяти осуществляется доступ на
чтение. Без этих ключей будет создана обычная точка наблюдения, то есть
она будет срабатывать, когда к местоположению в памяти осуществляется
доступ для записи.
See section Установка точек наблюдения.
Заметьте, что `-break-list’ выдаст единый список установленных
точек наблюдения и останова.
Комада GDB
Соответствующими командами GDB являются `watch’,
`awatch’ и `rwatch’.
Пример
Установка точки наблюдения за переменной в функции main:
(gdb)
-break-watch x
^done,wpt={number="2",exp="x"}
(gdb)
-exec-continue
^running
^done,reason="watchpoint-trigger",wpt={number="2",exp="x"},
value={old="-268439212",new="55"},
frame={func="main",args={},file="recursive2.c",line="5"}
(gdb)
Установка точки наблюдения за локальной переменной функции.
GDB дважды остановит выполнение программы: сначала при
изменении значения переменной, затем при выходе точки наблюдения из
области видимости.
(gdb)
-break-watch C
^done,wpt={number="5",exp="C"}
(gdb)
-exec-continue
^running
^done,reason="watchpoint-trigger",
wpt={number="5",exp="C"},value={old="-276895068",new="3"},
frame={func="callee4",args={},
file="../../../devo/gdb/testsuite/gdb.mi/basics.c",line="13"}
(gdb)
-exec-continue
^running
^done,reason="watchpoint-scope",wpnum="5",
frame={func="callee3",args={{name="strarg",
value="0x11940 "A string argument.""}},
file="../../../devo/gdb/testsuite/gdb.mi/basics.c",line="18"}
(gdb)
Список точек останова и наблюдения, в разных местах выполнения
программы. Заметьте, что как только точка наблюдения выходит из области
видимости, она удаляется.
(gdb)
-break-watch C
^done,wpt={number="2",exp="C"}
(gdb)
-break-list
^done,BreakpointTable={hdr={"Num","Type","Disp","Enb","Address","What"},
bkpt={number="1",type="breakpoint",disp="keep",enabled="y",
addr="0x00010734",func="callee4",
file="../../../devo/gdb/testsuite/gdb.mi/basics.c",line="8",times="1"},
bkpt={number="2",type="watchpoint",disp="keep",
enabled="y",addr="",what="C",times="0"}}
(gdb)
-exec-continue
^running
^done,reason="watchpoint-trigger",wpt={number="2",exp="C"},
value={old="-276895068",new="3"},
frame={func="callee4",args={},
file="../../../devo/gdb/testsuite/gdb.mi/basics.c",line="13"}
(gdb)
-break-list
^done,BreakpointTable={hdr={"Num","Type","Disp","Enb","Address","What"},
bkpt={number="1",type="breakpoint",disp="keep",enabled="y",
addr="0x00010734",func="callee4",
file="../../../devo/gdb/testsuite/gdb.mi/basics.c",line="8",times="1"},
bkpt={number="2",type="watchpoint",disp="keep",
enabled="y",addr="",what="C",times="-5"}}
(gdb)
-exec-continue
^running
^done,reason="watchpoint-scope",wpnum="2",
frame={func="callee3",args={{name="strarg",
value="0x11940 "A string argument.""}},
file="../../../devo/gdb/testsuite/gdb.mi/basics.c",line="18"}
(gdb)
-break-list
^done,BreakpointTable={hdr={"Num","Type","Disp","Enb","Address","What"},
bkpt={number="1",type="breakpoint",disp="keep",enabled="y",
addr="0x00010734",func="callee4",
file="../../../devo/gdb/testsuite/gdb.mi/basics.c",line="8",times="1"}}
(gdb)
Управление данными GDB/MI
Этот раздел описывает команды GDB/MI для управления данными:
исследование памяти и регистров, вычисление выражений, и так далее.
Команда -data-disassemble
Краткое описание
-data-disassemble
[ -s нач-адр -e кон-адр ]
| [ -f имя-файла -l ном-строки [ -n ст ] ]
-- режим
Где:
- `нач-адр‘
-
начальный адрес (или
$pc) - `кон-адр‘
- конечный адрес
- `имя-файла‘
- имя файла для дисассемблирования
- `ном-строки‘
- номер строки, в районе которой проводить дисассемблирование
- `ст‘
-
число строк дисассемблирования, которое необходимо произвести. Если
равно -1 и кон-адр не указан, то будет дисассемблирована целая
функция. Если кон-адр указан и не равен нулю, и
ст меньше, чем количество строк дисассемблирования между
нач-адр и кон-адр, отображаются только ст строк.
Если ст больше, чем число строк между нач-адр и
кон-адр, отображаются только строки до кон-адр. - `режим‘
-
либо 0 (означает только результат дисассемблирования), либо 1 (означает
смесь исходного текста и результата дисассемблирования).
Результат
Вывод для каждой инструкции состоит из четырех полей:
- Адрес
- Имя-Функции
- Смещение
- Инструкция
Заметьте, что то, что включено в поле инструкции, не обрабатывается
непосредственно GDB/MI, то есть изменить его формат невозможно.
Команда GDB
Непосредственного отображения этой команды в CLI нет.
Пример
Дисассемблирование от текущего значения $pc до $pc + 20:
(gdb)
-data-disassemble -s $pc -e "$pc + 20" -- 0
^done,
asm_insns={
{address="0x000107c0",func-name="main",offset="4",
inst="mov 2, %o0"},
{address="0x000107c4",func-name="main",offset="8",
inst="sethi %hi(0x11800), %o2"},
{address="0x000107c8",func-name="main",offset="12",
inst="or %o2, 0x140, %o1t! 0x11940 <_lib_version+8>"},
{address="0x000107cc",func-name="main",offset="16",
inst="sethi %hi(0x11800), %o2"},
{address="0x000107d0",func-name="main",offset="20",
inst="or %o2, 0x168, %o4t! 0x11968 <_lib_version+48>"}}
(gdb)
Дисассемблирование всей функции main. Строка 32 является частью
main.
-data-disassemble -f basics.c -l 32 -- 0
^done,asm_insns={
{address="0x000107bc",func-name="main",offset="0",
inst="save %sp, -112, %sp"},
{address="0x000107c0",func-name="main",offset="4",
inst="mov 2, %o0"},
{address="0x000107c4",func-name="main",offset="8",
inst="sethi %hi(0x11800), %o2"},
[...]
{address="0x0001081c",func-name="main",offset="96",inst="ret "},
{address="0x00010820",func-name="main",offset="100",inst="restore "}}
(gdb)
Дисассемблирование 3 инструкций от начала main:
(gdb)
-data-disassemble -f basics.c -l 32 -n 3 -- 0
^done,asm_insns={
{address="0x000107bc",func-name="main",offset="0",
inst="save %sp, -112, %sp"},
{address="0x000107c0",func-name="main",offset="4",
inst="mov 2, %o0"},
{address="0x000107c4",func-name="main",offset="8",
inst="sethi %hi(0x11800), %o2"}}
(gdb)
Дисассемблирование 3 инструкций от начала main в смешаном режиме:
(gdb)
-data-disassemble -f basics.c -l 32 -n 3 -- 1
^done,asm_insns={
src_and_asm_line={line="31",
file="/kwikemart/marge/ezannoni/flathead-dev/devo/gdb/
testsuite/gdb.mi/basics.c",line_asm_insn={
{address="0x000107bc",func-name="main",offset="0",
inst="save %sp, -112, %sp"}}},
src_and_asm_line={line="32",
file="/kwikemart/marge/ezannoni/flathead-dev/devo/gdb/
testsuite/gdb.mi/basics.c",line_asm_insn={
{address="0x000107c0",func-name="main",offset="4",
inst="mov 2, %o0"},
{address="0x000107c4",func-name="main",offset="8",
inst="sethi %hi(0x11800), %o2"}}}}
(gdb)
Команда -data-evaluate-expression
Краткое описание
-data-evaluate-expression выраж
Вычислить выражение выраж. Выражение может содержать подчиненный
вызов функции. Вызов функции быдет выполнен синхронно. Если выражение
содержит пробелы, оно должно быть заключено в двойные кавычки.
Команда GDB
Соответствующими командами GDB являются `print’,
`output’ и `call’. В gdbtk есть
соответствующая команда `gdb_eval’.
Пример
В следующем примере числа, предшествующие командам, суть лексемы.
Для их описания, см. section Синтаксис команд GDB/MI. Обратите внимание на то, как GDB/MI возвращает
те же лексемы в своем выводе.
211-data-evaluate-expression A 211^done,value="1" (gdb) 311-data-evaluate-expression &A 311^done,value="0xefffeb7c" (gdb) 411-data-evaluate-expression A+3 411^done,value="4" (gdb) 511-data-evaluate-expression "A + 3" 511^done,value="4" (gdb)
Команда -data-list-changed-registers
Краткое описание
-data-list-changed-registers
Выводит список регистров, которые изменились.
Команда GDB
GDB не имеет прямого аналога этой команды; соответствующей
командой gdbtk является `gdb_changed_register_list’.
Пример
На плате PPC MBX:
(gdb)
-exec-continue
^running
(gdb)
*stopped,reason="breakpoint-hit",bkptno="1",frame={func="main",
args={},file="try.c",line="5"}
(gdb)
-data-list-changed-registers
^done,changed-registers={"0","1","2","4","5","6","7","8","9",
"10","11","13","14","15","16","17","18","19","20","21","22","23",
"24","25","26","27","28","30","31","64","65","66","67","69"}
(gdb)
Команда -data-list-register-names
Краткое описание
-data-list-register-names [ ( ном-рег )+ ]
Показать список имен регистров текущей цели. Если аргументы не заданы,
показывается список имен всех регистров. Если в качестве аргументов
заданы целые числа, команда напечатает список имен регистров,
соответствующих аргументам.
Команда GDB
В GDB нет команды, которая соответствует
`-data-list-register-names’. В gdbtk соответствующей
командой является `gdb_regnames’.
Пример
Для платы PPC MBX:
(gdb)
-data-list-register-names
^done,register-names={"r0","r1","r2","r3","r4","r5","r6","r7",
"r8","r9","r10","r11","r12","r13","r14","r15","r16","r17","r18",
"r19","r20","r21","r22","r23","r24","r25","r26","r27","r28","r29",
"r30","r31","f0","f1","f2","f3","f4","f5","f6","f7","f8","f9",
"f10","f11","f12","f13","f14","f15","f16","f17","f18","f19","f20",
"f21","f22","f23","f24","f25","f26","f27","f28","f29","f30","f31",
"pc","ps","cr","lr","ctr","xer"}
(gdb)
-data-list-register-names 1 2 3
^done,register-names={"r1","r2","r3"}
(gdb)
Команда -data-list-register-values
Краткое описание
-data-list-register-values фмт [ ( ном-рег )*]
Отобразить содержимое регистров. Фмт является форматом, в
соответствии с которым должно быть возвращено содержимое регистров, за
которым следует необязательный список чисел, указывающих регистры,
подлежащие отображению. Отсутствие списка чисел означает, что должно быть
возвращено содержимое всех регистров.
Вот допустимые форматы для фмт:
x- Шестнадцатеричный
o- Восьмеричный
t- Двоичный
d- Десятичный
r- Без преобразования
N- Натуральный
Команда GDB
Соответствующими командами GDB являются `info reg’,
`info all-reg’ и (в gdbtk) `gdb_fetch_registers’.
Пример
Для платы PPC MBX (имейте ввиду: переносы строк даны только для удобства
чтения, они не появляются в реальном выводе):
(gdb)
-data-list-register-values r 64 65
^done,register-values={{number="64",value="0xfe00a300"},
{number="65",value="0x00029002"}}
(gdb)
-data-list-register-values x
^done,register-values={{number="0",value="0xfe0043c8"},
{number="1",value="0x3fff88"},{number="2",value="0xfffffffe"},
{number="3",value="0x0"},{number="4",value="0xa"},
{number="5",value="0x3fff68"},{number="6",value="0x3fff58"},
{number="7",value="0xfe011e98"},{number="8",value="0x2"},
{number="9",value="0xfa202820"},{number="10",value="0xfa202808"},
{number="11",value="0x1"},{number="12",value="0x0"},
{number="13",value="0x4544"},{number="14",value="0xffdfffff"},
{number="15",value="0xffffffff"},{number="16",value="0xfffffeff"},
{number="17",value="0xefffffed"},{number="18",value="0xfffffffe"},
{number="19",value="0xffffffff"},{number="20",value="0xffffffff"},
{number="21",value="0xffffffff"},{number="22",value="0xfffffff7"},
{number="23",value="0xffffffff"},{number="24",value="0xffffffff"},
{number="25",value="0xffffffff"},{number="26",value="0xfffffffb"},
{number="27",value="0xffffffff"},{number="28",value="0xf7bfffff"},
{number="29",value="0x0"},{number="30",value="0xfe010000"},
{number="31",value="0x0"},{number="32",value="0x0"},
{number="33",value="0x0"},{number="34",value="0x0"},
{number="35",value="0x0"},{number="36",value="0x0"},
{number="37",value="0x0"},{number="38",value="0x0"},
{number="39",value="0x0"},{number="40",value="0x0"},
{number="41",value="0x0"},{number="42",value="0x0"},
{number="43",value="0x0"},{number="44",value="0x0"},
{number="45",value="0x0"},{number="46",value="0x0"},
{number="47",value="0x0"},{number="48",value="0x0"},
{number="49",value="0x0"},{number="50",value="0x0"},
{number="51",value="0x0"},{number="52",value="0x0"},
{number="53",value="0x0"},{number="54",value="0x0"},
{number="55",value="0x0"},{number="56",value="0x0"},
{number="57",value="0x0"},{number="58",value="0x0"},
{number="59",value="0x0"},{number="60",value="0x0"},
{number="61",value="0x0"},{number="62",value="0x0"},
{number="63",value="0x0"},{number="64",value="0xfe00a300"},
{number="65",value="0x29002"},{number="66",value="0x202f04b5"},
{number="67",value="0xfe0043b0"},{number="68",value="0xfe00b3e4"},
{number="69",value="0x20002b03"}}
(gdb)
Команда -data-read-memory
Краткое описание
-data-read-memory [ -o смещение ] адрес формат-слова размер-слова число-строк число-колонок [ asсимв ]
где:
- `адрес‘
-
Выражение, определяющее адрес в памяти первого слова, которое надо
прочитать. Сложные выражения, содержащие пробельные символы, должны
заключаться в кавычки с использованием соглашений Си. - `формат-слова‘
-
Формат, который должен быть использован для печати слов памяти.
Обозначения те же, что и для команды GDBprint
(see section Форматы вывода). - `размер-слова‘
- Размер в байтах каждого слова в памяти.
- `число-строк‘
- Число строк в выходной таблице.
- `число-колонок‘
- Число колонок в выходной таблице.
- `asсимв‘
-
В настоящее время означает, что каждая строка должна включать
ASCII-дамп. Значение asсимв используется в качестве
заполняющего символа, когда байт не является элементом набора печатных
знаков ASCII (печатные знаки ASCII это те знаки, чьи коды
находятся между 32 и 126 включительно). - `смещение‘
-
Смещение, которое надо добавить к адресу перед тем, как начать
извлечение из памяти.
Эта команда отображает содержимое памяти в виде таблицы из
число-строк на число-колонок слов, причем каждое слово
занимает размер-слова байт. В общей сложности считывается
число-строк * число-колонок * размер-слова
байт (возвращается как `total-bytes’). Если цель должна возвратить
меньше запрошенного числа байт, отсутствующие слова идентифицируются при
помощи `N/A’. Число байт, прочитанное с цели, возвращается в
`nr-bytes’, а начальный адрес, использованный для чтении памяти, в
`addr’.
Адрес следующей/предыдущей строки или страницы доступен в
`next-row’ и `prev-row’, `next-page’ и `prev-page’.
Команда GDB
Соответствующей командой GDB является `x’. gdbtk
имеет команду чтения памяти `gdb_get_mem’.
Пример
Прочитать шесть байт памяти, начиная с bytes+6, но сместиться на
-6 байт. Форматировать в три ряда по две колонки. Один байт на
слово. Отображать каждое слово в шестнадцатеричном виде.
(gdb)
9-data-read-memory -o -6 -- bytes+6 x 1 3 2
9^done,addr="0x00001390",nr-bytes="6",total-bytes="6",
next-row="0x00001396",prev-row="0x0000138e",next-page="0x00001396",
prev-page="0x0000138a",memory={
{addr="0x00001390",data={"0x00","0x01"}},
{addr="0x00001392",data={"0x02","0x03"}},
{addr="0x00001394",data={"0x04","0x05"}}}
(gdb)
Прочитать два байта памяти, начиная с адреса shorts + 64 и
отобразить в виде одного слова в десятичном виде.
(gdb)
5-data-read-memory shorts+64 d 2 1 1
5^done,addr="0x00001510",nr-bytes="2",total-bytes="2",
next-row="0x00001512",prev-row="0x0000150e",
next-page="0x00001512",prev-page="0x0000150e",memory={
{addr="0x00001510",data={"128"}}}
(gdb)
Прочитать тридцать два байта памяти, начиная с bytes+16, и
форматировать на восемь рядов по четыре колонки. Включить строку,
закодированную с использованием `x’ в качестве непечатного символа.
(gdb)
4-data-read-memory bytes+16 x 1 8 4 x
4^done,addr="0x000013a0",nr-bytes="32",total-bytes="32",
next-row="0x000013c0",prev-row="0x0000139c",
next-page="0x000013c0",prev-page="0x00001380",memory={
{addr="0x000013a0",data={"0x10","0x11","0x12","0x13"},ascii="xxxx"},
{addr="0x000013a4",data={"0x14","0x15","0x16","0x17"},ascii="xxxx"},
{addr="0x000013a8",data={"0x18","0x19","0x1a","0x1b"},ascii="xxxx"},
{addr="0x000013ac",data={"0x1c","0x1d","0x1e","0x1f"},ascii="xxxx"},
{addr="0x000013b0",data={"0x20","0x21","0x22","0x23"},ascii=" !"#"},
{addr="0x000013b4",data={"0x24","0x25","0x26","0x27"},ascii="$%&'"},
{addr="0x000013b8",data={"0x28","0x29","0x2a","0x2b"},ascii="()*+"},
{addr="0x000013bc",data={"0x2c","0x2d","0x2e","0x2f"},ascii=",-./"}}
(gdb)
Команда -display-delete
Краткое описание
-display-delete число
Удалить элемент номер из списка выражений, подлежащих
отображению.
Команда GDB
Соответствующей командой GDB является `delete display’.
Пример
Н.П.
Команда -display-disable
Краткое описание
-display-disable номер
Отключить элемент номер списка выражений, подлежащих
отображению.
Команда GDB
Соответствующей командой GDB является `disable display’.
Пример
Н.П.
Команда -display-enable
Краткое описание
-display-enable номер
Включить элемент номер списка выражений, подлежащих
отображению.
Команда GDB
Соответствующей командой GDB является `enable display’.
Пример
Н.П.
Команда -display-insert
Краткое описание
-display-insert выражение
Отображать выражение всякий раз, когда программа останавливается.
Команда GDB
Соответствующей командой GDB является `display’.
Пример
Н.П.
Команда -display-list
Краткое описание
-display-list
Перечислить элементы списка выражений, подлежащих автоматическому
отображению. Текущие значения не показывать.
Команда GDB
Соответствующей командой GDB является `info display’.
Пример
Н.П.
Команда -environment-cd
Краткое описание
-environment-cd кат
Установить рабочий каталог GDB.
Команда GDB
Соответствующей командой GDB является `cd’.
Пример
(gdb) -environment-cd /kwikemart/marge/ezannoni/flathead-dev/devo/gdb ^done (gdb)
Команда -environment-directory
Краткое описание
-environment-directory кат
Добавить каталог кат в начало пути поиска исходных файлов.
Команда GDB
Соответствующей командой GDB является `dir’.
Пример
(gdb) -environment-directory /kwikemart/marge/ezannoni/flathead-dev/devo/gdb ^done (gdb)
Команда -environment-path
Краткое описание
-environment-path ( кат )+
Добавить каталоги кат в начало пути поиска объектных файлов.
Команда GDB
Соответствующей командой GDB является `path’.
Пример
(gdb) -environment-path /kwikemart/marge/ezannoni/flathead-dev/ppc-eabi/gdb ^done (gdb)
Команда -environment-pwd
Краткое описание
-environment-pwd
Показать текущий рабочий каталог.
Команда GDB
Соответствующей командой GDB является `pwd’.
Пример
(gdb) -environment-pwd ~Working directory /kwikemart/marge/ezannoni/flathead-dev/devo/gdb. ^done (gdb)
Управление программой GDB/MI
Завершение программы
В процессе выполнения, подчиненная программа может достигнуть конца,
если она не встретит ни одной точки останова. В этом случае вывод будет
включать код завершения, если программа завершилась ненормально.
Примеры
Программа завершилась нормально:
(gdb) -exec-run ^running (gdb) x = 55 *stopped,reason="exited-normally" (gdb)
Программа завершилась ненормально:
(gdb) -exec-run ^running (gdb) x = 55 *stopped,reason="exited",exit-code="01" (gdb)
Кроме того, программа может завершиться так, как если бы она получила
сигнал, например SIGINT. В этом случае, GDB/MI отображает
следующее:
(gdb) *stopped,reason="exited-signalled",signal-name="SIGINT", signal-meaning="Interrupt"
Команда -exec-abort
Краткое описание
-exec-abort
Убить выполняющуюся подчиненную программу.
Команда GDB
Соответствующей командой GDB является `kill’.
Пример
Н.П.
Команда -exec-arguments
Краткое описание
-exec-arguments арг
Установить аргументы подчиненной программы, которые должны быть
использованы при следующем `-exec-run’.
Команда GDB
Соответствующей командой GDB является `set args’.
Пример
Пока нет.
Команда -exec-continue
Краткое описание
-exec-continue
Асинхронная команда. Возобновляет выполнение подчиненной программы до
тех пор, пока не будет встречена точка останова, или пока подчиненная
программа не завершится.
Команда GDB
Соответствующей командой GDB является `continue’.
Пример
-exec-continue
^running
(gdb)
@Hello world
*stopped,reason="breakpoint-hit",bkptno="2",frame={func="foo",args={},
file="hello.c",line="13"}
(gdb)
Команда -exec-finish
Краткое описание
-exec-finish
Асинхронная команда. Возобновляет выполнение подчиненной программы до
тех пор, пока не завершится текущая функция. Отображает результаты,
возвращенные функцией.
Команда GDB
Соответствующей командой GDB является `finish’.
Пример
Функция, возвращающая void.
-exec-finish
^running
(gdb)
@hello from foo
*stopped,reason="function-finished",frame={func="main",args={},
file="hello.c",line="7"}
(gdb)
Функция, возвращающая что-либо отличное от void. Печатается имя
внутренней переменной GDB, хранящей результат, а также и сам
результат.
-exec-finish
^running
(gdb)
*stopped,reason="function-finished",frame={addr="0x000107b0",func="foo",
args={{name="a",value="1"},{name="b",value="9"}},
file="recursive2.c",line="14"},
gdb-result-var="$1",return-value="0"
(gdb)
Команда -exec-interrupt
Краткое описание
-exec-interrupt
Асинхронная команда. Прерывает фоновое исполнение цели. Заметьте, что
лексема, ассоциированная с сообщением об останове, совпадает с лексемой
для выполнения команды, которая была прервана. Лексема для самого
прерывания появляется только в выводе `^done’. Если пользователь
пытается прервать невыполняющуюся программу, будет выведено сообщение об
ошибке.
Команда GDB
Соответствующей командой GDB является `interrupt’.
Пример
(gdb)
111-exec-continue
111^running
(gdb)
222-exec-interrupt
222^done
(gdb)
111*stopped,signal-name="SIGINT",signal-meaning="Interrupt",
frame={addr="0x00010140",func="foo",args={},file="try.c",line="13"}
(gdb)
(gdb)
-exec-interrupt
^error,msg="mi_cmd_exec_interrupt: Inferior not executing."
(gdb)
Команда -exec-next
Краткое описание
-exec-next
Асинхронная команда. Возобновляет выполнение подчиненной программы,
останавливая ее, когда достигается начало следующей строки исходного
текста.
Команда GDB
Соответствующей командой GDB является `next’.
Пример
-exec-next ^running (gdb) *stopped,reason="end-stepping-range",line="8",file="hello.c" (gdb)
Команда -exec-next-instruction
Краткое описание
-exec-next-instruction
Асинхронная команда. Выполняет одну машинную инструкцию. Если
инструкция является вызовом функции, выполнение продолжается до возврата
из функции. Если программа останавливается на инструкции в середине
строки исходного текста, печатается также адрес.
Команда GDB
Соответствующей командой GDB является `nexti’.
Пример
(gdb) -exec-next-instruction ^running (gdb) *stopped,reason="end-stepping-range", addr="0x000100d4",line="5",file="hello.c" (gdb)
Команда -exec-return
Краткое описание
-exec-return
Велит текущей функции немедленно вернуться. Не выполняет подчиненную
программу. Отображает новый текущий кадр.
Команда GDB
Соответствующей командой GDB является `return’.
Пример
(gdb)
200-break-insert callee4
200^done,bkpt={number="1",addr="0x00010734",
file="../../../devo/gdb/testsuite/gdb.mi/basics.c",line="8"}
(gdb)
000-exec-run
000^running
(gdb)
000*stopped,reason="breakpoint-hit",bkptno="1",
frame={func="callee4",args={},
file="../../../devo/gdb/testsuite/gdb.mi/basics.c",line="8"}
(gdb)
205-break-delete
205^done
(gdb)
111-exec-return
111^done,frame={level="0 ",func="callee3",
args={{name="strarg",
value="0x11940 "A string argument.""}},
file="../../../devo/gdb/testsuite/gdb.mi/basics.c",line="18"}
(gdb)
Команда -exec-run
Краткое описание
-exec-run
Асинхронная команда. Начинает выполнение подчиненной программы с начала.
Она выполняется до тех пор, пока либо не встретится точка останова, либо
программа не завершится.
Команда GDB
Соответствующей командой GDB является `run’.
Пример
(gdb)
-break-insert main
^done,bkpt={number="1",addr="0x0001072c",file="recursive2.c",line="4"}
(gdb)
-exec-run
^running
(gdb)
*stopped,reason="breakpoint-hit",bkptno="1",
frame={func="main",args={},file="recursive2.c",line="4"}
(gdb)
Команда -exec-show-arguments
Краткое описание
-exec-show-arguments
Печатает аргументы программы.
Команда GDB
Соответствующей командой GDB является `show args’.
Пример
Н.П.
Команда -exec-step
Краткое описание
-exec-step
Асинхронная команда. Возобновляет выполнение подчиненной программы,
останавливая ее, когда будет достигнуто начало следующей строки исходного
файла, при условии, что она не является вызовом функции. Если же
следующая строка является вызовом функции, программа останавливается на
первой инструкции этой функции.
Команда GDB
Соответствующей командой GDB является `step’.
Пример
Пошаговый вход в функцию:
-exec-step
^running
(gdb)
*stopped,reason="end-stepping-range",
frame={func="foo",args={{name="a",value="10"},
{name="b",value="0"}},file="recursive2.c",line="11"}
(gdb)
Обычное пошаговое выполнение:
-exec-step ^running (gdb) *stopped,reason="end-stepping-range",line="14",file="recursive2.c" (gdb)
Команда -exec-step-instruction
Краткое описание
-exec-step-instruction
Асинхронная команда. Возобновляет выполнение подчиненной программы,
выполняя одну машинную инструкцию. Вывод, когда GDB
остановится, будет различаться в зависимости от того, остановились мы в
середине исходной строки или нет. В первом случае, адрес, по которому
программа остановлена, также будет напечатан.
Команда GDB
Соответствующей командой GDB является `stepi’.
Пример
(gdb)
-exec-step-instruction
^running
(gdb)
*stopped,reason="end-stepping-range",
frame={func="foo",args={},file="try.c",line="10"}
(gdb)
-exec-step-instruction
^running
(gdb)
*stopped,reason="end-stepping-range",
frame={addr="0x000100f4",func="foo",args={},file="try.c",line="10"}
(gdb)
Команда -exec-until
Краткое описание
-exec-until [ местоположение ]
Асинхронная команда. Выполняет подчиненную программу до тех пор, пока
не будет достигнуто указанное в аргументе местоположение. Если
аргумента нет, подчиненная программа выполняется, пока не будет
достигнута строка исходного текста, превышающая текущую. В этом случае,
причиной остановки будет `location-reached’.
Команда GDB
Соответствующей командой GDB является `until’.
Пример
(gdb)
-exec-until recursive2.c:6
^running
(gdb)
x = 55
*stopped,reason="location-reached",frame={func="main",args={},
file="recursive2.c",line="6"}
(gdb)
Команда -file-exec-and-symbols
Краткое описание
-file-exec-and-symbols файл
Указать выполняемый файл для отладки. Это тот файл, из которого также
читается таблица символов. Если файл не указан, команда очищает
информацию о выполняемом файле и символах. Если при использовании этой
команды без аргументов установлены точки останова, GDB выдаст
сообщение об ошибке. В противном случае, никакого вывода не будет, за
исключением уведомления о завершении.
Команда GDB
Соответствующей командой GDB является `file’.
Пример
(gdb) -file-exec-file /kwikemart/marge/ezannoni/TRUNK/mbx/hello.mbx ^done (gdb)
Команда -file-exec-file
Краткое описание
-file-exec-file файл
Указать выполняемый файл для отладки. В отличие от
`-file-exec-and-symbols’, таблица символов не считывается из
этого файла. При использовании без аргумента, GDB очищает
информацию о выполняемом файле. Никакого вывода не производится, за
исключением уведомления о завершении.
Команда GDB
Соответствующей командой GDB является `exec-file’.
Пример
(gdb) -file-exec-file /kwikemart/marge/ezannoni/TRUNK/mbx/hello.mbx ^done (gdb)
Команда -file-list-exec-sections
Краткое описание
-file-list-exec-sections
Перечисляет разделы текущего выполняемого файла.
Команда GDB
Команда GDB `info file’ показывает, помимо всего прочего,
ту же информацию, что и эта команда. gdbtk имеет соответствующую
команду `gdb_load_info’.
Пример
Н.П.
Команда -file-list-exec-source-files
Краткое описание
-file-list-exec-source-files
Перечисляет исходные файлы для текущего выполняемого файла.
Команда GDB
В GDB нет команды, непосредственно соответсвующей этой.
gdbtk имеет аналогичную команду `gdb_listfiles’.
Пример
Н.П.
Команда -file-list-shared-libraries
Краткое описание
-file-list-shared-libraries
Перечисляет используемые программой разделяемые библиотеки.
Команда GDB
Соответствующей командой GDB является `info shared’.
Пример
Н.П.
Команда -file-list-symbol-files
Краткое описание
-file-list-symbol-files
Перечисляет файлы символов.
Команда GDB
Соответствующей командой GDB является `info file’ (ее
часть).
Пример
Н.П.
Команда -file-symbol-file
Краткое описание
-file-symbol-file файл
Прочитать информацию символьной таблицы из указанного в аргументе
файла. Будучи использованной без аргументов, очищиет таблицу
символьной информации GDB. Никакого вывода не производится,
кроме уведомления о завершении.
Команда GDB
Соответствующей командой GDB является `symbol-file’.
Пример
(gdb) -file-symbol-file /kwikemart/marge/ezannoni/TRUNK/mbx/hello.mbx ^done (gdb)
Разные команды GDB в GDB/MI
Команда -gdb-exit
Краткое описание
-gdb-exit
Немедленно выйти из GDB.
Команда GDB
Примерно соответствует команде `quit’.
Пример
(gdb) -gdb-exit
Команда -gdb-set
Краткое описание
-gdb-set
Установить внутреннюю переменную GDB.
Команда GDB
Соответствующей командой GDB является `set’.
Пример
(gdb) -gdb-set $foo=3 ^done (gdb)
Команда -gdb-show
Краткое описание
-gdb-show
Показать текущее значение переменной GDB.
Команда GDB
Соответствующей командой GDB является `show’.
Пример
(gdb) -gdb-show annotate ^done,value="0" (gdb)
Команда -gdb-version
Краткое описание
-gdb-version
Вывести информацию о версии GDB. Используется преимущественно
при тестировании.
Команда GDB
Эквивалентной команды GDB нет. По умолчанию, GDB
показывает эту информацию, когда вы вызываете интерактивный сеанс.
Пример
(gdb) -gdb-version ~GNU gdb 5.2.1 ~Copyright 2000 Free Software Foundation, Inc. ~GDB is free software, covered by the GNU General Public License, and ~you are welcome to change it and/or distribute copies of it under ~ certain conditions. ~Type "show copying" to see the conditions. ~There is absolutely no warranty for GDB. Type "show warranty" for ~ details. ~This GDB was configured as "--host=sparc-sun-solaris2.5.1 --target=ppc-eabi". ^done (gdb)
Команды управления стеком в GDB/MI
Команда -stack-info-frame
Краткое описание
-stack-info-frame
Получить информацию о текущем кадре.
Команда GDB
Соответствующей командой GDB является `info frame’ или
`frame’ (без аргументов).
Пример
Н.П.
Команда -stack-info-depth
Краткое описание
-stack-info-depth [ макс-глуб ]
Возвращает глубину стека. Если указан целочисленный аргумент
макс-глуб, не считать более макс-глуб кадров.
Команда GDB
Эквивалентной команды GDB нет.
Пример
Для стека с уровнями кадров от 0 до 11:
(gdb) -stack-info-depth ^done,depth="12" (gdb) -stack-info-depth 4 ^done,depth="4" (gdb) -stack-info-depth 12 ^done,depth="12" (gdb) -stack-info-depth 11 ^done,depth="11" (gdb) -stack-info-depth 13 ^done,depth="12" (gdb)
Команда -stack-list-arguments
Краткое описание
-stack-list-arguments показ-знач
[ нижн-кадр верхн-кадр ]
Отобразить список аргументов для кадров от нижн-кадр до
верхн-кадр (включительно). Если нижн-кадр и
верхн-кадр не указаны, перечислить аргументы для всего стека
вызовов.
Аргумент показ-знач должен иметь значение 0 или 1. Значение 0
означает, что выводятся только имена аргументов, а 1,—что
печатаются как имена, так и значения аргументов.
Команда GDB
GDB не имеет эквивалентной команды. В gdbtk есть
команда `gdb_get_args’, которая частично перекрывается с действием
`-stack-list-arguments’.
Пример
(gdb)
-stack-list-frames
^done,
stack={
frame={level="0 ",addr="0x00010734",func="callee4",
file="../../../devo/gdb/testsuite/gdb.mi/basics.c",line="8"},
frame={level="1 ",addr="0x0001076c",func="callee3",
file="../../../devo/gdb/testsuite/gdb.mi/basics.c",line="17"},
frame={level="2 ",addr="0x0001078c",func="callee2",
file="../../../devo/gdb/testsuite/gdb.mi/basics.c",line="22"},
frame={level="3 ",addr="0x000107b4",func="callee1",
file="../../../devo/gdb/testsuite/gdb.mi/basics.c",line="27"},
frame={level="4 ",addr="0x000107e0",func="main",
file="../../../devo/gdb/testsuite/gdb.mi/basics.c",line="32"}}
(gdb)
-stack-list-arguments 0
^done,
stack-args={
frame={level="0",args={}},
frame={level="1",args={name="strarg"}},
frame={level="2",args={name="intarg",name="strarg"}},
frame={level="3",args={name="intarg",name="strarg",name="fltarg"}},
frame={level="4",args={}}}
(gdb)
-stack-list-arguments 1
^done,
stack-args={
frame={level="0",args={}},
frame={level="1",
args={{name="strarg",value="0x11940 "Строковый аргумент.""}}},
frame={level="2",args={
{name="intarg",value="2"},
{name="strarg",value="0x11940 "Строковый аргумент.""}}},
{frame={level="3",args={
{name="intarg",value="2"},
{name="strarg",value="0x11940 "Строковый аргумент.""},
{name="fltarg",value="3.5"}}},
frame={level="4",args={}}}
(gdb)
-stack-list-arguments 0 2 2
^done,stack-args={frame={level="2",args={name="intarg",name="strarg"}}}
(gdb)
-stack-list-arguments 1 2 2
^done,stack-args={frame={level="2",
args={{name="intarg",value="2"},
{name="strarg",value="0x11940 "Строковый аргумент.""}}}}
(gdb)
Команда -stack-list-frames
Краткое описание
-stack-list-frames [ нижн-кадр верхн-кадр ]
Перечисляет кадры, находящиеся в данный момент в стеке. Для каждого
кадра, команда отображает следующую информацию:
- `level‘
-
Номер кадра, 0 для самого верхнего, то есть для самой внутренней
функции. - `addr‘
-
Значение
$pcдля этого кадра. - `func‘
- Имя функции.
- `file‘
- Имя исходного файла, где находится функция.
- `line‘
-
Номер строки, соответствующий
$pc.
Будучи вызванной без аргументов, эта команда печатает цепочку вызовов
для всего стека. Если задано два целочисленных аргумента, она
показывает кадры с уровнями между этими аргументами (включительно).
Если аргументы равны, она показывает один единственный кадр
соответствующего уровня.
Команда GDB
Соответствующими командами GDB являются `backtrace’ и
`where’.
Пример
Цепочка вызовов стека целиком:
(gdb)
-stack-list-frames
^done,stack=
{frame={level="0 ",addr="0x0001076c",func="foo",
file="recursive2.c",line="11"},
frame={level="1 ",addr="0x000107a4",func="foo",
file="recursive2.c",line="14"},
frame={level="2 ",addr="0x000107a4",func="foo",
file="recursive2.c",line="14"},
frame={level="3 ",addr="0x000107a4",func="foo",
file="recursive2.c",line="14"},
frame={level="4 ",addr="0x000107a4",func="foo",
file="recursive2.c",line="14"},
frame={level="5 ",addr="0x000107a4",func="foo",
file="recursive2.c",line="14"},
frame={level="6 ",addr="0x000107a4",func="foo",
file="recursive2.c",line="14"},
frame={level="7 ",addr="0x000107a4",func="foo",
file="recursive2.c",line="14"},
frame={level="8 ",addr="0x000107a4",func="foo",
file="recursive2.c",line="14"},
frame={level="9 ",addr="0x000107a4",func="foo",
file="recursive2.c",line="14"},
frame={level="10",addr="0x000107a4",func="foo",
file="recursive2.c",line="14"},
frame={level="11",addr="0x00010738",func="main",
file="recursive2.c",line="4"}}
(gdb)
Показать кадры между нижн-кадр и верхн-кадр:
(gdb)
-stack-list-frames 3 5
^done,stack=
{frame={level="3 ",addr="0x000107a4",func="foo",
file="recursive2.c",line="14"},
frame={level="4 ",addr="0x000107a4",func="foo",
file="recursive2.c",line="14"},
frame={level="5 ",addr="0x000107a4",func="foo",
file="recursive2.c",line="14"}}
(gdb)
Показать один кадр:
(gdb)
-stack-list-frames 3 3
^done,stack=
{frame={level="3 ",addr="0x000107a4",func="foo",
file="recursive2.c",line="14"}}
(gdb)
Команда -stack-list-locals
Краткое описание
-stack-list-locals печатать-значения
Вывести имена локальных переменных для текущего кадра. С параметром 0
выводит только имена переменных, с параметром 1 выводит также их
значения.
Команда GDB
`info locals’ в GDB, `gdb_get_locals’ в gdbtk.
Пример
(gdb)
-stack-list-locals 0
^done,locals={name="A",name="B",name="C"}
(gdb)
-stack-list-locals 1
^done,locals={{name="A",value="1"},{name="B",value="2"},
{name="C",value="3"}}
(gdb)
Команда -stack-select-frame
Краткое описание
-stack-select-frame ном-кадра
Изменить текущий кадр. Выбрать другой кадр ном-кадра в стеке.
Команда GDB
Соответствующими командами GDB являются `frame’,
`up’, `down’, `select-frame’, `up-silent’ и
`down-silent’.
Пример
(gdb) -stack-select-frame 2 ^done (gdb)
Команды GDB/MI запросов о символах
Команда -symbol-info-address
Краткое описание
-symbol-info-address символ
Описать, где хранится символ.
Команда GDB
Соответствующей командой GDB является `info address’.
Пример
Н.П.
Команда -symbol-info-file
Краткое описание
-symbol-info-file
Показать файл для символа.
Команда GDB
Эквивалентной команды GDB нет. В gdbtk есть команда
`gdb_find_file’.
Пример
Н.П.
Команда -symbol-info-function
Краткое описание
-symbol-info-function
Показать, в какой функции находится символ.
Команда GDB
`gdb_get_function’ в gdbtk.
Пример
Н.П.
Команда -symbol-info-line
Краткое описание
-symbol-info-line
Показать адреса памяти кода для текущей строки.
Команда GDB
Соответствующей командой GDB является `info line’. В
gdbtk есть команды `gdb_get_line’ и `gdb_get_file’.
Пример
Н.П.
Команда -symbol-info-symbol
Краткое описание
-symbol-info-symbol адрес
Описать, какой символ находится в местоположении адрес.
Команда GDB
Соответствующей командой GDB является `info symbol’.
Пример
Н.П.
Команда -symbol-list-functions
Краткое описание
-symbol-list-functions
Перечислить функции, находящиеся в выполняемом файле.
Команда GDB
`info functions’ в GDB, `gdb_listfunc’ и
`gdb_search’ в gdbtk.
Пример
Н.П.
Команда -symbol-list-types
Краткое описание
-symbol-list-types
Перечислить все имена типов.
Команда GDB
Соответствующими командами являются `info types’ в GDB и
`gdb_search’ в gdbtk.
Пример
Н.П.
Команда -symbol-list-variables
Краткое описание
-symbol-list-variables
Перечислить имена всех глобальных и статических переменных.
Команда GDB
`info variables’ в GDB, `gdb_search’ в gdbtk.
Пример
Н.П.
Команда -symbol-locate
Краткое описание
-symbol-locate
Команда GDB
`gdb_loc’ в gdbtk.
Пример
Н.П.
Команда -symbol-type
Краткое описание
-symbol-type переменная
Показать тип переменной.
Команда GDB
Соответствующей командой GDB является `ptype’, в
gdbtk есть команда `gdb_obj_variable’.
Пример
Н.П.
Команды GDB/MI управления целью
Команда -target-attach
Краткое описание
-target-attach ид-проц | файл
Присоединиться к процессу ид-проц или файлу файл вне
GDB.
Команда GDB
Соответствующей командой GDB является `attach’.
Пример
Н.П.
Команда -target-compare-sections
Краткое описание
-target-compare-sections [ раздел ]
Сравнить данные раздела раздел на цели с выполняемым файлом. Без
аргумента сравниваются все разделы.
Команда GDB
Эквивалентной командой в GDB является `compare-sections’.
Пример
Н.П.
Команда -target-detach
Краткое описание
-target-detach
Отсоединиться от удаленной цели. Никакого вывода не производится.
Команда GDB
Соответствующей командой GDB является `detach’.
Пример
(gdb) -target-detach ^done (gdb)
Команда -target-download
Краткое описание
-target-download
Загружает выполняемый файл на удаленную цель. Команда два раза в
секунду обновляет сообщение, которое включает поля:
- `section’
- Имя раздела.
- `section-sent’
- Размер переданного на данный момент участка для этого раздела.
- `section-size’
- Размер раздела.
- `total-sent’
-
Общий размер переданной на данный момент информации (текущий и
предыдущие разделы). - `total-size’
- Размер всего выполняемого файла, подлежащего загрузке.
Каждое сообщение посылается в виде сообщения статуса (see section Выходной синтаксис GDB/MI).
Кроме того, команда печатает имена и размеры разделов, по мере их
загрузки. Эти сообщения включают следующие поля:
- `section’
- Имя раздела.
- `section-size’
- Размер раздела.
- `total-size’
- Размер всего выполняемого файла, подлежащего загрузке.
В конце печатается суммарная информация.
Команда GDB
Соответствующей командой GDB является `load’.
Пример
Замечание: каждое сообщение статуса появляется на одной строке. Здесь
сообщения были разбиты на несколько строк, чтобы они могли влезть на страницу.
(gdb)
-target-download
+download,{section=".text",section-size="6668",total-size="9880"}
+download,{section=".text",section-sent="512",section-size="6668",
total-sent="512",total-size="9880"}
+download,{section=".text",section-sent="1024",section-size="6668",
total-sent="1024",total-size="9880"}
+download,{section=".text",section-sent="1536",section-size="6668",
total-sent="1536",total-size="9880"}
+download,{section=".text",section-sent="2048",section-size="6668",
total-sent="2048",total-size="9880"}
+download,{section=".text",section-sent="2560",section-size="6668",
total-sent="2560",total-size="9880"}
+download,{section=".text",section-sent="3072",section-size="6668",
total-sent="3072",total-size="9880"}
+download,{section=".text",section-sent="3584",section-size="6668",
total-sent="3584",total-size="9880"}
+download,{section=".text",section-sent="4096",section-size="6668",
total-sent="4096",total-size="9880"}
+download,{section=".text",section-sent="4608",section-size="6668",
total-sent="4608",total-size="9880"}
+download,{section=".text",section-sent="5120",section-size="6668",
total-sent="5120",total-size="9880"}
+download,{section=".text",section-sent="5632",section-size="6668",
total-sent="5632",total-size="9880"}
+download,{section=".text",section-sent="6144",section-size="6668",
total-sent="6144",total-size="9880"}
+download,{section=".text",section-sent="6656",section-size="6668",
total-sent="6656",total-size="9880"}
+download,{section=".init",section-size="28",total-size="9880"}
+download,{section=".fini",section-size="28",total-size="9880"}
+download,{section=".data",section-size="3156",total-size="9880"}
+download,{section=".data",section-sent="512",section-size="3156",
total-sent="7236",total-size="9880"}
+download,{section=".data",section-sent="1024",section-size="3156",
total-sent="7748",total-size="9880"}
+download,{section=".data",section-sent="1536",section-size="3156",
total-sent="8260",total-size="9880"}
+download,{section=".data",section-sent="2048",section-size="3156",
total-sent="8772",total-size="9880"}
+download,{section=".data",section-sent="2560",section-size="3156",
total-sent="9284",total-size="9880"}
+download,{section=".data",section-sent="3072",section-size="3156",
total-sent="9796",total-size="9880"}
^done,address="0x10004",load-size="9880",transfer-rate="6586",
write-rate="429"
(gdb)
Команда -target-exec-status
Краткое описание
-target-exec-status
Предоставить информацию о состоянии цели (например, выполняется она или
нет).
Команда GDB
Эквивалентной команды GDB нет.
Пример
Н.П.
Команда -target-list-available-targets
Краткое описание
-target-list-available-targets
Перечислить цели, к которым можно установить соединение.
Команда GDB
Соответствующей командой GDB является `help target’.
Пример
Н.П.
Команда -target-list-current-targets
Краткое описание
-target-list-current-targets
Описать текущую цель.
Команда GDB
Соответствующая информация (вместе с другой) печатается командой
`info file’.
Пример
Н.П.
Команда -target-list-parameters
Краткое описание
-target-list-parameters
Команда GDB
Эквивалента нет.
Пример
Н.П.
Команда -target-select
Краткое описание
-target-select тип параметры ...
Соединить GDB с удаленной целью. Эта команда допускает два
аргумента:
- `тип‘
- Тип цели, например, `async’, `remote’, и т.д.
- `параметры‘
- Имена устройств, названия машин и тому подобное. See section Команды для управления целями, для более полной информации.
Результатом является уведомление о соединении, за которым следует адрес,
по которому находится целевая программа, в следующей форме:
^connected,addr="адрес",func="имя функции",
args={список аргументов}
Команда GDB
Соответствующей командой GDB является `target’.
Пример
(gdb)
-target-select async /dev/ttya
^connected,addr="0xfe00a300",func="??",args={}
(gdb)
Команды GDB/MI для нитей
Команда -thread-info
Краткое описание
-thread-info
Команда GDB
Эквивалента нет.
Пример
Н.П.
Команда -thread-list-all-threads
Краткое описание
-thread-list-all-threads
Команда GDB
Эквивалентной командой GDB является `info threads’.
Пример
Н.П.
Команда -thread-list-ids
Краткое описание
-thread-list-ids
Выводит список известных GDB в данный момент идентификаторов
нитей. В конце списка также выводится общее число таких нитей.
Команда GDB
Часть `info threads’ предоставляет ту же информацию.
Пример
Кроме основного процесса нет ни одной нити:
(gdb)
-thread-list-ids
^done,thread-ids={},number-of-threads="0"
(gdb)
Несколько нитей:
(gdb)
-thread-list-ids
^done,thread-ids={thread-id="3",thread-id="2",thread-id="1"},
number-of-threads="3"
(gdb)
Команда -thread-select
Краткое описание
-thread-select номер-нити
Сделать нить номер-нити текущей. Команда выводит номер новой
текущей нити и самый верхний кадр для нее.
Команда GDB
Соответствующей командой GDB является `thread’.
Пример
(gdb)
-exec-next
^running
(gdb)
*stopped,reason="end-stepping-range",thread-id="2",line="187",
file="../../../devo/gdb/testsuite/gdb.threads/linux-dp.c"
(gdb)
-thread-list-ids
^done,
thread-ids={thread-id="3",thread-id="2",thread-id="1"},
number-of-threads="3"
(gdb)
-thread-select 3
^done,new-thread-id="3",
frame={level="0 ",func="vprintf",
args={{name="format",value="0x8048e9c "%*s%c %d %c\n""},
{name="arg",value="0x2"}},file="vprintf.c",line="31"}
(gdb)
Команды GDB/MI для точек трассировки
Команды для точек трассировки еще не реализованы.
Изменяемые объекты GDB/MI
Обоснование для изменяемых объектов в GDB/MI
Для реализации изменяемого отладочного окна (локальные переменные,
наблюдаемые выражения, и т.д.), мы предлагаем модификацию существующего
кода, используемого в Insight.
Вот две основные причины для этого:
- Он был проверен на практике (это уже его второе поколение).
- Это сократит время разработки (не стоит говорить, как это сейчас важно).
Первоначальный интерейс был разработан для использование кодом Tcl, так
что он был немного изменен, чтобы его можно было использовать через
GDB/MI. Этот раздел описывает операции GDB/MI, которые будут
доступны, и дает некоторые советы по их использованию.
Замечание: В дополнение к описанному здесь набору операций, мы
ожидаем, что GUI-реализация изменяемого окна будет требовать, как
минимум, следующие операции:
-gdb-showoutput-radix-stack-list-arguments-stack-list-locals-stack-select-frame
Введение в изменяемые объекты в GDB/MI
Основной идеей изменяемых объектов является создание именованного
объекта для представления переменной, выражения, местоположения в памяти
или даже регистра ЦП. Для каждого созданного объекта существует набор
операций для изучения или изменения его свойств.
Более того, сложные типы данных, такие как структуры Си, представлены в
древовидном формате. Например, переменная типа struct является
корнем, а потомки будут представлять элементы этой структуры. Если
потомок сам является сложным типом, он также будет иметь своих потомков.
Соответствующие различия языков учитываются для Си, Си++ и Java.
При возврате реальных значений объектов, эта возможность позволяет
отдельно выбирать формат отображения, используемый при создании
результата. Он может быть выбран из: двоичный, десятичный,
шестнадцатеричный, восьмеричный и обычный. Обычный ссылается на формат
по умолчанию, выбираемый автоматически в зависимости от типа переменной
(например, десятичный для int, шестнадцатеричный для указателей,
и т.д.).
Далее следует полный набор операций GDB/MI, определенный для
доступа к этим возможностям:
| Операция | Описание |
-var-create |
создать изменяемый объект |
-var-delete |
удалить изменяемый объект и его потомков |
-var-set-format |
установить формат отображения для этой переменной |
-var-show-format |
показать формат отображения для этой переменной |
-var-info-num-children |
сообщает, сколько потомков имеет данный объект |
-var-list-children |
возвращает список потомков объекта |
-var-info-type |
показать тип этого изменяемого объекта |
-var-info-expression |
напечатать, что представляет этот изменяемый объект |
-var-show-attributes |
является ли эта переменная редактируемой? она здесь существует? |
-var-evaluate-expression |
получить значение этой переменной |
-var-assign |
установить значение этой переменной |
-var-update |
скорректировать переменную и ее потомков |
В следующем подразделе мы подробно описываем каждую операцию и
предлагаем возможный способ ее использования.
Описание и использование операций для изменяемых объектов
Команда -var-create
Краткое описание
-var-create {имя | "-"}
{адрес-кадра | "*"} выражение
Данная операция создает изменяемый объект. Это позволяет наблюдать за
переменной, результатом выражения, ячейкой памяти или регистром ЦП.
Параметр имя является строкой, по которой можно ссылаться на
объект. Она должен быть уникальной. Если указан `-‘, система
изменяемых объектов автоматически сгенерирует строку «varNNNNNN». Она
будет уникальной, при условии, что имя не будет указано в этом
формате. Команда завершается ошибкой, если найдено повторяющееся имя.
В адресе-кадра может быть задан кадр, в котором должно быть
вычислено выражение. `*’ указывает, что должен использоваться
текущий кадр.
Выражение—это произвольное выражение, правильное в текущем
наборе языков (не должно начинаться со `*’), или одно из
следующего:
- `*адрес‘, где адрес есть адрес ячейки памяти
- `*адрес—адрес‘ — диапазон адресов памяти (TBD)
- `$имя-рег‘ — имя регистра ЦП
Результат
Эта операция возвращает имя, число потомков и тип созданного объекта.
Тип возвращается как строка, как будто она создана GDB CLI:
name="имя",numchild="N",type="тип"
Команда -var-delete
Краткое описание
-var-delete имя
Удаляет созданный ранее изменяемый объект и всех его потомков.
Возвращает ошибку, если объект с именем имя не найден.
Команда -var-set-format
Краткое описание
-var-set-format имя специф-формата
Устанавливает формат вывода в специф-формата для значения объекта
имя.
Синтаксис специф-формата следующий:
специф-формата ==>
{binary | decimal | hexadecimal | octal | natural}
Команда -var-show-format
Краткое описание
-var-show-format имя
Возвращает формат, используемый для отображения значений объекта имя.
формат ==> специф-формата
Команда -var-info-num-children
Краткое описание
-var-info-num-children имя
Возвращает число потомков изменяемого объекта с именем имя:
numchild=n
Команда -var-list-children
Краткое описание
-var-list-children имя
Возвращает список потомков указанного изменяемого объекта:
numchild=n,children={{name=имя,
numchild=n,type=тип},(повторяется N раз)}
Команда -var-info-type
Краткое описание
-var-info-type имя
Возвращает тип указанного изменяемого объекта имя. Тип
возвращается как строка в том же формате, в котором она выдается
GDB CLI:
type=имя-типа
Команда -var-info-expression
Краткое описание
-var-info-expression имя
Возвращает то, что представляет изменяемый объект с именем имя:
lang=специф-языка,exp=выражение
где специф-языка есть {"C" | "C++" | "Java"}.
Команда -var-show-attributes
Краткое описание
-var-show-attributes имя
Перечисляет атрибуты заданного изменяемого объекта имя:
status=атр [ ( ,атр )* ]
где атр есть { { editable | noneditable } | TBD }.
Команда -var-evaluate-expression
Краткое описание
-var-evaluate-expression имя
Вычисляет выражение, которое представлено указанным изменяемым объектом
и возвращает его значение в виде строки в текущем формате, определенном
для объекта:
value=значение
Команда -var-assign
Краткое описание
-var-assign имя выражение
Присваивает значение выражения изменяемому объекту, заданному
именем. Объект должен быть в состоянии `editable’.
Команда -var-update
Краткое описание
-var-update {имя | "*"}
Обновить значение изменяемого объекта с именем имя путем
вычисления его выражения, после получения всех новых значений из памяти
или регистров. `*’ приводит к обновлению всех существующих
изменяемых объектов.
Черновик изменений к выходному синтаксису GDB/MI
Одной проблемой, обнаруженной в существующем синтаксисе вывода
GDB/MI, была трудность в нахождении отличий между наборами вроде
этого:
{number="1",type="breakpoint",disp="keep",enabled="y"}
где каждое значение имеет уникальную метку, и таким списком:
{"1","2","4"}
{bp="1",bp="2",bp="4"}
где значения не имеют меток, или метки повторяются.
Далее представлен черновик изменений к спецификации вывода, который
решает эту проблему.
Вывод GDB/MI состоит из нуля или более внеочередных
записей, за которыми может следовать одна результирующая запись, причем
она относится к самой последней введенной команде. Последовательность
завершается `gdb’.
Асинхронный вывод GDB/MI такой же.
Каждая выходная запись, непосредственно связанная с входной командой,
начинается с префикса лексема входной команды.
вывод ==>-
{ внеочередная-запись }
[рез-запись]«(gdb)» nl рез-запись ==>-
[лексема]«^» рез-класс { «,» результат } nl внеочередная-запись ==>-
асинхр-запись
|поточн-запись асинхр-запись ==>-
асинхр-вывод-выполн
|асинхр-вывод-статуса|асинхр-вывод-уведомл асинхр-вывод-выполн ==>-
[лексема]«*» асинхр-вывод асинхр-вывод-статуса ==>-
[лексема]«+» асинхр-вывод асинхр-вывод-уведомл ==>-
[лексема]«=» асинхр-вывод асинхр-вывод ==>- асинхр-класс { «,» результат } nl
результ-класс ==>-
«done»
|«running»|«connected»|«error»|«exit» асинхр-класс ==>-
«stopped»
|другое по необходимости, т.к. находится в
стадии разработки результат ==>- строка «=» значение
значение ==>-
строка-си
|набор|список набор ==>-
«{}»
|«{» результат { «,» результат } «}» список ==>-
«
[]»|«[» значение { «,» значение } «]» строка ==>- [-A-Za-z.0-9_]*
строка-си ==>- Смотри спецификацию ввода
поточн-запись ==>-
консольн-поточн-вывод
|целев-поточн-вывод|журн-поточн-вывод консольн-поточн-вывод ==>- «~» строка-си
целев-поточн-вывод ==>- «@» строка-си
журн-поточн-вывод ==>- «&» строка-си
nl ==>-
CR
|CR-LF лексема ==>- «любая последовательность цифр»
Кроме того, следующее находится в стадии разработки.
запрос- Это действие пока не определено.
Замечания:
- Все выходные последовательности заканчиваются строкой, содержащей точку.
-
Лексемаберется из соответствующего запроса. Если
выполняющаяся команда прерывается командой-exec-interrupt,
лексема, ассоциированная с сообщением `*stopped’, берется из исходной
выполнявшейся команды, а не из команды прерывания. -
Асинхр-вывод-статуса содержит информацию о статусе выполнения
медленной операции. Она может быть отброшена. Вся информация о статусе
начинается с префикса `+’. -
Асинхр-вывод-выполн содержит изменения асинхронного состояния на
цели (остановлена, запущена, исчезла). Весь асинхронный вывод
начинается с префикса `*’. -
Асинхр-вывод-уведомл содержит дополнительную информацию, которую
должен обработать клиент (информация о новой точке останова). Весь
уведомительный вывод начинается с префикса `=’. -
Консольн-поточн-вывод является выводом, который должен быть
отображен на консоли без изменений. Это текстовая реакция на команду
CLI. Весь консольный вывод начинается с префикса `~’. -
Целев-поточн-вывод является выводом, произведенным целевой
программой. Весь целевой вывод начинается с префикса `@’. -
Журн-поточн-вывод является текстом, исходящим изнутри
GDB, например, сообщения, которые должны быть выведены как
часть журнала ошибок. Весь журнальный вывод начинается с префикса
`&’.
Отчеты об ошибках в GDB
Ваши отчеты об ошибках играют существенную роль в обеспечении
надежности GDB.
Сообщение об ошибке может помочь вам найти решение вашей проблемы, а
может и не помочь. Но в любом случае, основная функция отчета об
ошибке—помочь всему обществу сделать следующую версию GDB
лучше. Отчеты об ошибках—это ваш вклад в поддержку GDB.
Чтобы отчет об ошибке сделал свое дело, вы должны включить в него
информацию, которая даст нам возможность ее устранить.
Вы нашли ошибку?
Если вы не уверены, нашли ли вы ошибку, вот несколько руководящих
принципов:
-
Если отладчик получает фатальный сигнал, то это ошибка в
GDB, независимо от ввода. В надежных отладчиках сбоев не бывает. -
Если GDB выводит сообщение об ошибке для допустимого
ввода—это ошибка. (Заметьте, что если вы выполняете кросс-отладку,
проблема может возникать где-то в соединении к цели.) -
Если GDB не выводит сообщение об ошибке для недопустимого ввода,
это ошибка. Однако вы должны обратить внимание, что если по вашему
мнению что-то является «недопустимым вводом», по нашему мнению это может быть
«расширением» или «поддержкой для традиционной практики». -
Если вы опытный пользователь средств отладки, ваши предложения по
улучшению GDB приветствуются в любом случае.
Как составлять отчеты об ошибках
Некоторые компании и частные лица предлагают поддержку для программных
продуктов GNU. Если вы получили GDB из организации
поддержки, мы рекомендуем вам сперва связаться с ней.
Вы можете найти контактную информацию для многих организаций поддержки
и частных лиц в файле `etc/SERVICE' в дистрибутиве GNU Emacs.
В любом случае, мы также рекомендуем вам послать отчет об ошибке в
GDB по этому адресу:
bug-gdb@gnu.org
Не посылайте отчеты об ошибках в `info-gdb’, или в
`help-gdb’, или в какую-либо группу новостей. Большинство
пользователей GDB не хотят получать отчеты об ошибках. Те, кто
этого действительно хочет, должны получать `bug-gdb’.
Список рассылки `bug-gdb’ имеет группу новостей `gnu.gdb.bug’,
которая служит как повторитель. Список рассылки и группа новостей
имеют в точности одинаковые сообщения. Часто люди посылают сообщения об
ошибках в группу новостей, вместо отправки по электронной почте.
Это работает, но имеется одна проблема, которая может быть решающей:
группа новостей часто не имеет информации об обратном адресе отправителя.
Таким образом, если нам потребуется запросить дополнительную информацию,
мы можем не иметь возможности связаться с вами. По этой причине, лучше
посылать отчеты об ошибках в список рассылки.
В крайнем случае, посылайте отчеты об ошибках на бумаге по адресу:
GNU Debugger Bugs Free Software Foundation Inc. 59 Temple Place - Suite 330 Boston, MA 02111-1307 USA
Основной принцип действенного составления отчетов об ошибках:
сообщайте все факты. Если вы не уверены, оставить факт или
исключить, оставьте его!
Часто люди опускают факты, потому что думают, что знают причины
проблемы, и полагают, что некоторые детали не имеют значения. Таким
образом, вы можете считать, что имя переменной, которую вы используете
в примере, не имеет значения. Возможно это так, но нельзя быть
уверенным в этом. Может быть ошибкой является неверное обращение к
памяти, которое выбрало данные из ячеек, где хранилось это имя;
возможно, если бы имя было другим, содержимое этих ячеек ввело бы
отладчик в заблуждение, и ошибка не была бы замечена. Относитесь к
этому осторожно, и приводите конкретные, полные примеры. Это самое
простое что вы можете сделать, и наиболее полезное.
Помните, что цель отчета об ошибке состоит в том, чтобы
дать нам возможность установить дефект. Может случиться, что об этой
ошибке нам уже сообщали, но не вы, не мы не можем этого знать, если отчет
об ошибке не будет полным и самодостаточным.
Иногда люди дают несколько поверхностных фактов и спрашивают, «не
говорит ли это об ошибке?». Такие сообщения о дефектах бесполезны, и мы
убеждаем всех отказываться отвечать на них, за исключением того,
чтобы побудить автора отчета послать его правильно.
Чтобы дать нам возможность устранить ошибку, вы должны включить в
сообщение следующее:
-
Версию GDB. GDB сообщает ее при вызове без
параметров; вы можете также вывести ее в любой момент, используя
show version.
Без этого мы не будем знать, имеет ли смысл поиск ошибки в текущей
версии отладчика. -
Тип машины, которой вы пользуетесь, название и номер версии операционной
системы. -
Какой компилятор (и его версия) использовался при компиляции
GDB. Например, «gcc—2.8.1». -
Какой компилятор (и его версия) использовался для компиляции
отлаживаемой программы—например «gcc—2.8.1», или
«HP92453-01 A.10.32.03 HP C Compiler». Для gcc, вы можете
использоватьgcc --versionчтобы получить эту информацию; для
других компиляторов, смотрите их документацию. -
Параметры команды, которые вы дали компилятору для компиляции вашего
примера, с которым вы наблюдали ошибку. Например, использовали ли вы
`-O’? Для гарантии, что вы не пропустите что-нибудь важное,
перечисляйте все.
Копии`Makefile'(или результата вызоваmake) достаточно.
Если мы должны будем угадывать аргументы, мы возможно сделаем это
неправильно и можем не столкнуться с ошибкой. -
Полный сценарий ввода, и все необходимые исходные файлы, которые
воспроизведут ошибку. -
Описание наблюдаемого вами поведения, которое вы считаете ошибочным.
Например, «Это приводит к фатальному сигналу».
Конечно, если ошибка состоит в получении GDB фатального
сигнала, то мы, конечно, заметим это. Но если ошибкой является
некорректный вывод, мы можем не заметить этого, если это не бросается в
глаза. Вы также можете не дать нам возможности ошибиться.
Даже если ваша проблема заключается в фатальном сигнале, вы все же
должны сообщить об этом явно. Предположим, происходит что-то странное,
например, ваша копия GDB рассинхронизировалась, или вы
столкнулись с ошибкой в библиотеке Си вашей системы. (Такое бывало!)
Ваша копия может завершиться аварийно, а наша нет. Если вы предупредите
нас об ожидаемой аварии, а в нашей системе этого не произойдет, мы будем
знать, что ошибка произошла не из-за нас. Если вы нас не предупредите,
мы не сможем сделать никаких выводов из наших наблюдений. -
Если вы хотите предложить внести изменения в исходные тексты GDB,
присылайте нам контекстные изменения. Даже если вы желаете обсудить
что-нибудь из исходных текстов, ссылайтесь по контексту, а не по
номеру строки.
Номера строк в наших исходных текстах разработки не будут
соответствовать вашим. Ваши номера строк не дадут нам никакой полезной
информации.
Вот некоторые вещи, не являющиеся обязательными:
-
Описание контекста ошибки.
Часто люди, сталкивающиеся с ошибкой, тратят много времени на
исследования, какие изменения входного файла приведут к ее
исчезновению, а какие на нее не влияют.
Это часто занимает много времени и приносит мало пользы, потому что мы
найдем ошибку посредством выполнения одного примера под управлением
отладчика с точками останова, а не чистыми выводами из
серии примеров. Мы рекомендуем вам сохранить это время для
чего-нибудь другого.
Конечно, если вы сможете найти более простой пример для отчета
вместо первоначального, это будет удобнее для нас.
Выделение ошибок в выводе будет проще, выполнение под управлением
отладчика будет занимать меньше времени, и так далее.
Однако, это упрощение не является жизненно важным; если вы не
хотите делать этого, сообщайте об ошибке в любом случае и посылайте нам
весь тестовый материал, который вы использовали. -
Заплата для ошибки.
Заплата для исправления ошибки действительно поможет нам, если это
хорошая заплата. Но не опускайте необходимую информацию, такую как
тестовый пример, предполагая, что заплата это все, в чем мы нуждаемся.
Мы можем обнаружить проблемы с вашей заплатой и решить устранить ошибку
другим путем, или мы можем вообще не понять смысл вашей заплаты.
Иногда для такой сложной программы, как GDB, очень трудно
создать пример, который заставит программу следовать по определенному
пути в процессе выполнения. Если вы не пришлете нам пример, мы не
сможем сконструировать его сами, и таким образом не сможем проверить,
что ошибка устранена.
И если мы не сможем понять, какую ошибку вы пытаетесь исправить,
или почему ваша заплата являются улучшением, мы не используем ее.
Тестовый пример поможет нам во всем разобраться. -
Предположения, в чем состоит ошибка, или от чего она зависит.
Такие предположения обычно неверны. Даже мы не можем сделать
правильных предположений о такого рода вещах до запуска отладчика
и выявления фактов.
Редактирование командной строки
Эта глава описывает основные возможности интерфейса редактирования
командной строки GNU.
Введение в редактирование строк
Следующие параграфы описывают нотацию, используемую для обозначения
нажатия клавиш.
Текст C-k читается как `Control-K’ и описывает знак, полученный
нажатием клавиши k при нажатой клавише Control.
Текст M-k читается как `Meta-K’ и описывает знак, введенный
нажатием клавиши k при нажатой клавише Meta (если у вас она
имеется). На многих клавиатурах клавиша Meta отмечается с помощью
ALT. На клавиатурах с двумя клавишами, отмеченными ALT
(обычно по разные стороны от пробела), ALT на левой стороне обычно
устанавливается для работы клавишей Meta. Правый ALT
также может быть сконфигурирован для работы Meta, или он может быть
сконфигурирован как другой модификатор, например как клавиша Compose для
ввода символов с акцентами.
Если у вас нет клавиши Meta или ALT, или другой клавиши,
работающей как Meta, идентичное нажатие клавиш можно получить
нажав сначала ESC, а затем k. Эти процессы
называются метафикацией клавиши k.
Текст M-C-k читается как `Meta-Control-k’ и описывает знак,
полученный посредством метафикации C-k.
Кроме того, некоторые клавиши имеют собственные имена. Именно,
DEL, ESC, LFD, SPC, RET и TAB в этом
тексте или в файле инициализации обозначают сами себя (see section Файл инициализации Readline).
Если на вашей клавиатуре нет клавиши LFD, нажатие C-j
приведет к вводу желаемого символа.
Клавиша RET на некоторых клавиатурах может быть отмечена как
Return или Enter.
Взаимодействие с Readline
Часто во время интерактивного сеанса вы вводите длинную строку
текста только для того, чтобы заметить, что первое слово набрано
неправильно. Библиотека Readline дает вам набор команд для
управления текстом во время ввода, позволяя вам лишь исправить опечатку,
а не набирать заново большую часть строки. С помощью
этих команд редактирования, вы перемещаете курсор в место,
требующее исправления, и удаляете или вставляете текст для коррекции.
Затем, когда строка полностью исправлена, вы просто нажимаете RET.
Чтобы нажать RET вам не обязательно находиться в конце строки; вся
строка вводится независимо от расположения в ней курсора.
Сведения первой необходимости
Для того, чтобы ввести знак в строку, просто нажмите его. Введенный знак
появляется там, где был курсор, и затем курсор перемещается на одну
позицию вправо. Если вы неверно набрали знак, вы можете использовать
ваш знак уничтожения, чтобы вернуться и удалить неверный знак.
Иногда вы можете набрать символ ошибочно, и не
заметить ошибки, пока не напечатаете несколько других знаков. В этом
случае, вы можете набрать C-b, чтобы переместить курсор влево, и
затем исправить вашу ошибку. После этого, вы можете переместить
курсор вправо нажатием C-f.
Когда вы добавляете текст в середину строки, символы справа от
курсора `сдвигаются вперед’, чтобы освободить место для вставляемого
текста. Аналогично, когда вы удаляете текст за курсором, символы
справа от него `сдвигаются назад’, занимая пустое пространство,
созданное в результате удаления текста. Ниже следует список
команд первой необходимости для редактирования вводимого текста.
- C-b
- Переместиться назад на одну позицию.
- C-f
- Переместиться вперед на одну позицию.
- DEL или Backspace
- Удалить символ слева от курсора.
- C-d
- Удалить символ под курсором.
- Ввод символов
- Вставить символ в строку в позицию курсора.
- C-_ или C-x C-u
-
Отменить последнюю команду редактирования. Вы можете отменить все,
вернувшись назад к пустой строке.
(В зависимости от вашей конфигурации, клавиша Backspace может быть
настроена удалять знак слева от курсора, а DEL удалять знак под
курсором, как C-d, вместо символа, расположенного от курсора
слева.)
Команды перемещения Readline
Приведенная выше таблица описывает только самые базовые
последовательности клавиш, которые
могут вам понадобиться для редактирования строки ввода. Для удобства, в
дополнение к C-b, C-f, C-d и DEL были добавлены
многие другие команды. Вот некоторые из них, предназначенные для более
быстрого перемещения по строке.
- C-a
- Переместиться в начало строки.
- C-e
- Переместиться в конец строки.
- M-f
- Переместиться вперед на слово. Слово состоит из букв и цифр.
- M-b
- Переместиться назад на слово.
- C-l
- Очистить экран, напечатав текущую строку заново вверху экрана.
Заметьте, что C-f перемещает курсор вперед на символ, в то время
как M-f перемещает вперед на слово. Это своего рода соглашение,
что при нажатии клавиши Сontrol производятся действия над символами, при
нажатии клавиши Meta—над словами.
Команды уничтожения Readline
Уничтожение текста означает уничтожение текста из строки, но
сохранение его для дальнейшего использования, обычно для
восстановления (повторной вставки) обратно в строку.
(`Вырезать’ и `вставить’ являются более свежими жаргонными синонимами
для `уничтожить’ и `восстановить’.)
Если в описании команды сказано, что она `уничтожает’ текст,
то вы можете быть уверены, что позже его можно будет получить обратно в
другом (или том же самом) месте.
Когда вы используете команду уничтожения, текст сохраняется в
кольцевом списке уничтожений. Любое число последовательных уничтожений
сохраняет весь уничтоженный текст вместе, так что когда вы
восстанавливаете его назад, вы получите все. Список уничтожений не
имеет привязки к строкам; текст, уничтоженный вами в предыдущей строке
ввода, доступен для восстановления позже, когда вы вводите другую
строку.
Вот список команд для уничтожения текста.
- C-k
- Уничтожить текст от текущей позиции курсора до конца строки.
- M-d
-
Уничтожить от курсора до конца текущего слова, или, если курсор
находится между словами, до конца следующего слова.
Границы слов такие же, как и используемые M-f. - M-DEL
-
Уничтожить от курсора до начала текущего слова, или, если курсор
находится между словами, до начала предыдущего слова.
Границы слов такие же, как и используемые M-b. - C-w
-
Уничтожить от курсора до предыдущего пробельного символа. Это отличается от
M-DEL, так как границы слова различаются.
Вот как можно восстановить текст обратно в строку. Восстановление
означает копирование последнего уничтоженного текста из буфера
уничтожений.
- C-y
- Восстановить последний уничтоженный текст в буфер перед курсором.
- M-y
-
Циклический сдвиг по кольцевому списку уничтожений, и восстановление
новой вершины. Вы можете использовать это, только если предыдущая команда
была C-y или M-y.
Параметры команд Readline
Вы можете передавать числовые параметры командам Readline. Иногда
параметр действует как счетчик повторений, иногда он является
знаком, если аргумент имеет знак. Если вы передаете
отрицательный параметр команде, которая обычно действует в прямом
направлении, то она будет действовать в обратном направлении. Например,
чтобы уничтожить текст до начала строки, вы можете набрать
`M-- C-k‘.
Общий способ передачи числовых параметров команде состоит в
наборе Meta-цифр перед командой. Если первая набранная `цифра’ есть знак
минус (`-‘), тогда знак аргумента будет отрицательным. Если вы набрали
одну мета-цифру для начала параметра, вы можете набрать оставшиеся
цифры, и потом команду. Например, чтобы передать команде C-d
параметр 10, вы можете набрать `M-1 0 C-d‘.
Поиск команд в истории
Readline предоставляет команды для поиска в истории команд
строк, содержащих указанную подстроку. Существует два режима поиска:
наращиваемый и ненаращиваемый.
Наращиваемый поиск начинается до того, как пользователь закончит ввод
строки поиска. По мере ввода очередных символов строки поиска, Readline
отображает следующий элемент из истории, соответствующий строке,
введенной на данный момент. Наращиваемый поиск требует ровно столько
символов, сколько требуется для нахождения желаемого элемента истории.
Для поиска определенной строки в истории в обратном направлении, введите
C-r. Ввод C-s производит поиск в прямом направлении.
Символы, присутствующие в значении переменной isearch-terminators,
используются для завершения наращиваемого поиска. Если этой переменной
не было присвоено значение, знаки ESC и C-J будут завершать
наращиваемый поиск. C-g прерывает наращиваемый поиск и
восстанавливает исходную строку. Когда поиск завершается, элемент
истории, содержащий искомую строку, становится текущей строкой.
Для нахождения других подходящих элементов списка истории, введите
соответственно C-r или C-s. Это произведет поиск вперед или
назад в истории до следующего элемента, соответствующего введенной
строке поиска. Любая другая последовательность клавиш, привязанная к
команде Readline, завершит поиск и выполнит эту команду. Например,
RET завершит поиск и примет эту строку, таким образом выполняя
команду из списка истории.
Ненаращиваемый поиск считывает строку поиска целиком, до начала поиска
соответствующих строк истории. Строка поиска может быть введена
пользователем или являться частью содержимого текущей строки.
Файл инициализации Readline
Хотя библиотека Readline поставляется с установленным по умолчанию набором
привязок клавиш, аналогичному Emacs, возможно использование
другого набора привязок. Любой пользователь может настраивать
программы, которые используют Readline, помещая команды в файл
inputrc, обычно в своем домашнем каталоге. Имя этого
файла берется из переменной среды INPUTRC. Если
эта переменная не установлена, по умолчанию берется файл `~/.inputrc'.
Когда запускается программа, использующая библиотеку Readline,
файл инициализации считывается и устанавливаются привязки клавиш.
Кроме того, команда C-x C-r считывает файл инициализации заново,
так что изменения, которые вы могли cделать к этому времени, вступают в
силу.
Синтаксис файла инициализации Readline
Существуют всего несколько конструкций, которые допускаются в файле
инициализации Readline. Пустые строки игнорируются. Строки,
начинающиеся с `#’, являются комментариями. Строки, начинающиеся с
`$’, обозначают условные конструкции (see section Условные конструкции инициализации). Другие строки обозначают установку переменных и
привязки клавиш.
- Установка переменных
-
Вы можете изменять поведение Readline во время выполнения посредством
изменения значений переменных, используя командуsetв
файле инициализации. Вот как можно изменить привязку клавиш Emacs,
используемую по умолчанию, для использования команд редактирования
строкиvi:set editing-mode vi
Основная часть поведения при выполнении изменяется с помощью следующих
переменных.bell-style-
Контролирует, что происходит, когда Readline хочет издать звук на
терминале. Если установлено в `none’, Readline никогда не издает
звук. Если установлено в `visible’, Readline использует визуальный
звонок, если есть возможность. Если установлено в `audible’ (по
умолчанию), Readline пытается издать звук на терминале. comment-begin-
Строка для вставки в начало строки, когда выполняется команда
`insert-comment’. По умолчанию"#". completion-ignore-case-
Если установлено в `on’, Readline производит проверку совпадений
и завершение имени файла без учета регистра.
По умолчанию `off’. completion-query-items-
Количество возможных завершений, определяющее, когда у пользователя
запрашивается, хочет ли он увидеть список возможных вариантов. Если
число возможных завершений больше этого значения, Readline спросит у
пользователя, хочет он их просмотреть или нет; в противном случае, они
просто отображаются. По умолчанию устанавливается предел100. convert-meta-
Если установлено в `on’, Readline будет преобразовывать символы с
установленным восьмым битом в последовательность клавиш ASCII,
удаляя восьмой бит и подставляя в качестве префикса знак ESC, тем
самым преобразовывая их в последовательность клавиш с Meta-префиксом.
По умолчанию `on’. disable-completion-
Если установлено в `on’, Readline будет препятствовать завершению
слов. Знаки завершения будут вставляться в строку так, как если бы они
отображались вself-insert. По умолчанию `off’. editing-mode-
Переменная
editing-modeконтролирует, какой набор привязок клавиш
используется. По умолчанию, Readline запускается в режиме
редактирования Emacs, где нажатия клавиш очень похожи на Emacs. Эта
переменная может быть установлена или в `emacs’, или в `vi’. enable-keypad-
Когда установлено в `on’, Readline будет пытаться активизировать
малую клавиатуру приложения, когда она вызывается. Это требуется
некоторым системам для активации клавиш со стрелками. По умолчанию
`off’. expand-tilde-
Если установлено в `on’, производится раскрывание тильды, когда
Readline осуществляет завершение слова. По умолчанию `off’. horizontal-scroll-mode-
Эта переменная может быть установлена в `on’ или `off’.
Установка в `on’ означает, что текст в редактируемых строках будет
прокручиваться горизонтально в одной строке экрана, когда ширина строки
становится больше ширины экрана, вместо переноса на новую строку. По
умолчанию, эта переменная установлена в `off’. input-meta-
Если установлено в `on’, Readline включит восьмибитовый ввод
(восьмой бит не будет удаляться из считываемых символов) независимо от
того, поддерживает ли это терминал. Значение по умолчанию `off’. Имя
meta-flagявляется синонимом для этой переменной. isearch-terminators-
Строка из знаков, которые должны прекращать наращиваемый поиск без
последующего выполнения знака как команды (see section Поиск команд в истории).
Если этой переменной не присвоено значение, наращиваемый поиск
прекращают знаки ESC и C-J. keymap-
Устанавливает текущую раскладку клавиатуры Readline для привязок команд
к клавишам. Возможные имена дляkeymap:emacs,
emacs-standard,emacs-meta,emacs-ctlx,vi,
vi-commandиvi-insert.viэквивалентно
vi-command;emacsэквивалентноemacs-standard.
Значение по умолчаниюemacs. Значение переменной
editing-modeтакже влияет на раскладку по умолчанию. mark-directories-
Если установлено в `on’, к именам каталогов после завершения
добавляется косая черта. По умолчанию `on’. mark-modified-lines-
Эта переменная, будучи установлена в `on’, велит Readline
отображать звездочку (`*’) в начале тех строк истории, которые были
модифицированы. По умолчанию, эта переменная установлена в `off’. output-meta-
Если установлено в `on’, Readline будет отображать знаки с
установленным восьмым битом непосредственно, а не в виде экранирующих
последовательностей с Meta-префиксом. По умолчанию `off’. print-completions-horizontally-
Если установлено в `on’, Readline будет отображать завершения,
отсортированные горизонтально в алфавитном порядке, а не вниз по
экрану. По умолчанию `off’. show-all-if-ambiguous-
Это изменяет поведение по умолчанию функций завершения. При
установке в `on’, если слово имеет более одного возможного
завершения, они будут выводиться немедленно, вместо подачи сигнала. По
умолчанию `off’. visible-stats-
Если установлено в `on’,
при выводе возможных завершений, к имени файла добавляется знак,
обозначающий тип файла. По умолчанию `off’.
- Привязки клавиш
-
Синтаксис для управления привязками клавиш в файле инициализации прост.
Во-первых, вы должны найти имя команды, которую вы хотите изменить.
Следующий раздел содержит таблицы с именем команды, привязкой клавиш по
умолчанию, если таковые есть, и коротким описанием, что делает команда.
Если вы знаете имя команды, просто поместите в строке файла
инициализации название клавиши, к которой вы хотите привязать команду,
двоеточие, и затем имя команды. Название клавиши может быть выражено
различными способами, в зависимости от того, как вам удобнее.- назв-клавиши: имя-функции или макрос
-
назв-клавиши—это название клавиши, записанное по-английски.
Например:Control-u: universal-argument Meta-Rubout: backward-kill-word Control-o: "> output"
В этом примере, C-u привязана к функции
universal-argument,
а C-o привязана к выполнению макрокоманды, записанной с правой
стороны (то есть, вставить текст `> output’ в строку). - «послед-клавиш«: имя-функции или макро
-
послед-клавиш отличается от вышеупомянутого назв-клавиши
тем, что позволяет определять строки, обозначающие целую последовательность
клавиш, посредством ее заключения в двойные кавычки.
Могут быть использованы некоторые экранирующие последовательности в стиле
GNU Emacs, как в следующем примере, но имена специальных знаков не
распознаются."C-u": universal-argument "C-xC-r": re-read-init-file "e[11~": "Function Key 1"
В этом примере, C-u привязывается к функции
universal-argument(как это было в первом примере),
`C-x C-r‘ привязывается к функции
re-read-init-fileи `ESC [ 1 1 ~‘ привязывается к
вставке текста `Function Key 1′.
Следующие экранирующие последовательности в стиле GNU Emacs доступны
при определении последовательности клавиш:C-- префикс Control
M-- префикс Meta
e- префикс экранирующего знака
\- обратная косая черта
"- ", знак двойных кавычек
'- ', одинарная кавычка или апостроф
В дополнение к экранирующим последовательностям стиля GNU Emacs,
доступен второй набор последовательностей с обратной косой чертой:a- тревога (звуковой сигнал)
b- переместиться назад на одну позицию
d- удаление
f- перевод страницы
n- новая строка
r- возврат каретки
t- горизонтальная табуляция
v- вертикальная табуляция
nnn-
знак, восьмеричное значение кода
ASCIIкоторого есть nnn
(от одной до трех цифр) xnnn-
знак, шестнадцатеричное значение кода
ASCIIкоторого есть nnn
(от одной до трех цифр)
При вводе текста макрокоманды, для обозначения ее определения должны
использоваться одиночные или двойные кавычки. Предполагается, что текст
без кавычек является именем функции. В теле макрокоманды, экранирующие
последовательности с обратной косой чертой раскрываются. Обратная косая
черта будет экранировать любой другой знак в тексте макрокоманды,
включая `»‘ и `». Например, следующая привязка велит
`C-x ‘ вставлять одиночную `’ в строку:"C-x\": "\"
Условные конструкции инициализации
Readline реализует возможности, аналогичные по смыслу возможностям
условной компиляции препроцессора Си, позволяющие производить привязки
клавиш и установку переменных в результате тестов. Вот четыре
директивы, используемые анализатором.
$if-
Конструкция
$ifпозволяет производить привязки в зависимости от
режима редактирования, используемого терминала, или приложения,
использующего Readline. Содержимое теста продолжается до конца строки;
для его ограничения не требуются никакие знаки.mode-
Форма
mode=директивы$ifиспользуется для проверки в
каком из режимов находится Readline:emacsилиvi. Это
может быть использовано, например, вместе с командой `set keymap’
для установки привязок в наборыemacs-standardи
emacs-ctlx, только если Readline запускается в режиме
emacs. term-
Форма
term=может использоваться для включения привязок клавиш,
уникальных для какого-либо терминала, возможно для привязки вывода
последовательности клавиш к функциональным клавишам терминала. Слово,
стоящее справа от `=’, сравнивается как с полным названием
терминала, так и с частью названия, идущей до первого `-‘. Это
позволяет, например, опознавать какsun, так иsun-cmd. application-
Конструкция application используется для включения установок,
уникальных для какого-либо приложения. Каждая программа, использующая
библиотеку Readline, устанавливает application name, и вы можете
проверить его. Это может быть использовано для привязки
последовательностей клавиш к функциям, полезным в конкретной программе.
Например, следующая команда добавляет последовательность, которая
заключает в кавычки текущее или предыдущее слово в Bash:$if Bash # Quote the current or previous word "C-xq": "eb"ef"" $endif
$endif-
Эта команда, как показано в предыдущем примере, заканчивает команду
$if. $else-
Команды этой ветви директивы
$ifвыполняются, если проверка
заканчивается неудачей. $include-
Эта директива принимает в качестве аргумента одно имя файла и считывает
из него команды и привязки клавиш.$include /etc/inputrc
Пример файла инициализации
Вот пример файла inputrc. Он иллюстрирует привязки клавиш, присвоение
значений переменным и синтаксис условий.
# Этот файл управляет поведением редактирования строки ввода в
# программах, использующих библиотеку Gnu Readline. Среди таких программ
# FTP, Bash, и Gdb.
#
# Вы можете заново считать файл inputrc с помощью C-x C-r.
# Строки, начинающиеся с '#', являются комментариями.
#
# Сначала, включим все общесистемные привязки и переменные из
# /etc/Inputrc
$include /etc/Inputrc
#
# Установка различных привязок для режима emacs.
set editing-mode emacs
$if mode=emacs
Meta-Control-h: backward-kill-word Текст после имени функции игнорируется
#
# Стрелки в режиме малой клавиатуры
#
#"M-OD": backward-char
#"M-OC": forward-char
#"M-OA": previous-history
#"M-OB": next-history
#
# Стрекли в режиме ANSI
#
"M-[D": backward-char
"M-[C": forward-char
"M-[A": previous-history
"M-[B": next-history
#
# Стрелки в восьмибитном режиме малой клавиатуры
#
#"M-C-OD": backward-char
#"M-C-OC": forward-char
#"M-C-OA": previous-history
#"M-C-OB": next-history
#
# Стрелки в восьмибитовом режиме ANSI
#
#"M-C-[D": backward-char
#"M-C-[C": forward-char
#"M-C-[A": previous-history
#"M-C-[B": next-history
C-q: quoted-insert
$endif
# Привязки старого стиля. Устанавливается по умолчанию.
TAB: complete
# Макрокоманды, удобные при взаимодействии с оболочкой
$if Bash
# редактирование пути
"C-xp": "PATH=${PATH}eC-eC-aefC-f"
# Подготовка к вводу слова в кавычках -- вставляет открывающуюся и
# закрывающуюся двойные кавычки и помещает курсор сразу за открывающей
"C-x"": """C-b"
# вставляет обратную косую черту (testing backslash escapes in sequences
# and macros)
"C-x\": "\"
# Заключает в кавычки текущее или предыдущее слово
"C-xq": "eb"ef""
# Добавляет привязку для обновления строки, которая непривязана
"C-xr": redraw-current-line
# Редактирование переменной в текущей строке
"M-C-v": "C-aC-k$C-yM-C-eC-aC-y="
$endif
# использовать визуальный звонок, если он доступен
set bell-style visible
# не урезать символы при чтении до 7 бит
set input-meta on
# позволяет ввод символов iso-latin1, вместо из преобразования к
# последовательностям с Meta-префиксом
# prefix-meta sequences
set convert-meta off
# отображает символы непосредственно с установленным восьмым битом, а не
# в виде знаков с Meta-префиксом
set output-meta on
# если существует более 150 возможных завершений слова, запросить
# пользователя, хочет ли он видеть их все
set completion-query-items 150
# Для FTP
$if Ftp
"C-xg": "get M-?"
"C-xt": "put M-?"
"M-.": yank-last-arg
$endif
Привязываемые команды Readline
Этот раздел описывает команды Readline, которые могут быть привязаны к
последовательностям клавиш.
Команды для перемещения
beginning-of-line (C-a)-
Переместиться в начало текущей строки.
end-of-line (C-e)-
Переместиться в конец строки.
forward-char (C-f)-
Переместиться на один знак вперед.
backward-char (C-b)-
Переместиться назад на один знак.
forward-word (M-f)-
Переместиться вперед до конца следующего слова. Слова составляются из
букв и цифр. backward-word (M-b)-
Переместиться назад к началу текущего или предыдущего слова. Слова
составляются из букв и цифр. clear-screen (C-l)-
Очистить экран и перерисовать текущую строку, оставляя ее наверху
экрана. redraw-current-line ()-
Обновить текущую строку. По умолчанию не привязана.
Команды для манипуляции историей
accept-line (Newline, Return)-
Ввод строки независимо от положения курсора. Если строка
непуста, добавить ее к списку истории. Если эта строка была
строкой истории, то восстановить строку истории до ее первоначального
состояния. previous-history (C-p)-
Переместиться `вверх’ по списку истории.
next-history (C-n)-
Переместиться `вниз’ по списку истории.
beginning-of-history (M-<)-
Переместиться к первой строке истории.
end-of-history (M->)-
Переместиться в конец истории ввода, то есть к строке, которая сейчас
редактируется. reverse-search-history (C-r)-
Обратный поиск начиная с текущей строки и перемещаясь по мере
необходимости `вверх’ по истории. Это наращиваемый поиск. forward-search-history (C-s)-
Прямой поиск начиная с текущей строки и перемещаясь по мере
необходимости `вниз’ по истории. Это наращиваемый поиск. non-incremental-reverse-search-history (M-p)-
Обратный поиск начиная с текущей строки и перемещаясь по мере
необходимости `вверх’ по истории, используя ненаращиваемый поиск строки,
заданной пользователем. non-incremental-forward-search-history (M-n)-
Прямой поиск начиная с текущей строки и перемещаясь по мере
необходимости `вниз’ по истории, используя ненаращиваемый поиск строки,
заданной пользователем. history-search-forward ()-
Прямой поиск в истории строки символов между началом текущей строки и
точкой. Это ненаращиваемый поиск. По умолчанию эта команда не
привязана. history-search-backward ()-
Обратный поиск в истории строки символов между началом текущей строки и
точкой. Это ненаращиваемый поиск. По умолчанию эта команда не привязана. yank-nth-arg (M-C-y)-
Вставить первый аргумент предыдущей команды (обычно второе слово
предыдущей строки). С аргументом n, вставляет n-ное слово
из предыдущей команды (слова в предыдущей команде начинаются со слова
0). Отрицательный аргумент вставляет n-ное с конца слово
предыдущей команды. yank-last-arg (M-., M-_)-
Вставить последний аргумент предыдущей команды (последнее слово
предыдущего элемента истории). С аргументом, ведет себя точно так же,
какyank-nth-arg. Последовательные вызовыyank-last-arg
перемещают назад по списку истории, вставляя последний аргумент каждой
строки по очереди.
Команды для изменения текста
delete-char (C-d)-
Удалить символ в позиции курсора. Если курсор находится в
начале строки, в строке нет символов и последний набранный знак не был
привязан кdelete-char, возвращает EOF. backward-delete-char (Rubout)-
Удалить символ за курсором. Числовой параметр предписывает
уничтожать символы, а не удалять их. forward-backward-delete-char ()-
Удалить символ под курсором, если не находится в конце строки, в этом
случае удаляется символ за курсором. По умолчанию, эта функция не
привязана к какой-либо клавише. quoted-insert (C-q, C-v)-
Добавить в строку следующий введенный знак, каким бы он ни был. Таким
образом можно вставить последовательность клавиш, например C-q. tab-insert (M-TAB)-
Вставить знак табуляции.
self-insert (a, b, A, 1, !, ...)-
Эти символы вставляют сами себя.
transpose-chars (C-t)-
Переместить знак перед курсором вперед за знак под курсором, также перемещая
курсор вперед. Если точка вставки находится в конце строки, то
переставить последние два знака в строке. Отрицательные аргументы не
оказывают действия. transpose-words (M-t)-
Переместить слово перед точкой за слово после точки. Также перемещает
точку за это слово. upcase-word (M-u)-
Перевести в верхний регистр текущее (или следующее) слово. С
отрицательным аргументом, переводит в верхний регистр предыдущее
слово, но не перемещает курсор. downcase-word (M-l)-
Перевести в нижний регистр текущее (или следующее) слово. С
отрицательным аргументом переводит в нижний регистр предыдущее слово, но
не перемещает курсор. capitalize-word (M-c)-
Перевести текущее (или предыдущее) слово в нижний регистр с первой
заглавной буквой. С отрицательным аргументом, действует на предыдущее
слово, но не перемещает курсор.
Уничтожение и восстановление
kill-line (C-k)-
Уничтожить текст от точки до конца строки.
backward-kill-line (C-x Rubout)-
Уничтожить назад до начала строки.
unix-line-discard (C-u)-
Уничтожить назад от курсора до начала текущей строки.
kill-whole-line ()-
Уничтожить все символы в текущей строке, независимо от позиции точки.
По умолчанию эта функция не привязана. kill-word (M-d)-
Уничтожить от точки до конца текущего слова,
или, если курсор находится между словами, до конца следующего слова.
Границы слова такие же, как дляforward-word. backward-kill-word (M-DEL)-
Уничтожить слово за точкой. Границы слова такие же, как для
backward-word. unix-word-rubout (C-w)-
Уничтожает слово за точкой, используя в качестве границы
слова пробелы. Уничтоженный текст сохраняется в кольцевом списке
уничтожений. delete-horizontal-space ()-
Удалить все пробелы и знаки табуляции вокруг точки. По умолчанию эта
функция не привязана. kill-region ()-
Уничтожить текст в текущей области. Эта функция по
умолчанию не привязана. copy-region-as-kill ()-
Копировать текст области в буфер уничтожения, так что он может быть сразу
восстановлен. Эта команда по умолчанию не привязана. copy-backward-word ()-
Копировать слово перед точкой в буфер уничтожений. Границы слова
такие же, как дляbackward-word. Эта команда по умолчанию не
привязана. copy-forward-word ()-
Копировать слово, следующее за точкой, в буфер уничтожений. Границы слова
такие же, как дляforward-word. Эта команда по умолчанию не
привязана. yank (C-y)-
Восстановить вершину кольцевого списка уничтожений в буфер в текущую
позицию курсора. yank-pop (M-y)-
Циклический сдвиг кольцевого списка уничтожений и восстановление новой
вершины. Вы можете использовать эту команду только если предыдущей
командой былаyankилиyank-pop.
Определение числовых параметров
digit-argument (M-0, M-1, ... M--)-
Добавить эту цифру к вводимому аргументу, или начать новый
аргумент. M-- начинает отрицательный аргумент. universal-argument ()-
Это другой способ задать аргумент. Если за этой командой следуют одна
или несколько цифр, возможно со знаком минус в начале, то они
определяют аргумент. Если за командой следуют цифры, повторное
выполнениеuniversal-argumentзаканчивает числовой аргумент, а в
противном случае он игнорируется.
В особом случае, если непосредственно за этой командой следует или
цифра, или знак минус, аргумент для следующей команды умножается на
четыре. Изначально аргумент равен единице, так что выполнение этой
функции первый раз делает его равным четырем, второй раз—шестнадцати,
и так далее. По умолчанию эта функция не привязана к клавише.
Readline вводит за вас
complete (TAB)-
Пытается завершить текст перед курсором. Действие функции зависит от
приложения. Обычно, если вы вводите имя файла, вы можете выполнить
завершение имени файла; если вы вводите команду, вы можете завершить
команду; если вводите символ для GDB, можете выполнить завершение имени
символа; если вы вводите переменную для Bash, можете завершить имя
переменной, и так далее. possible-completions (M-?)-
Перечислить возможные завершения текста перед курсором.
insert-completions (M-*)-
Вставить все завершения текста перед точкой, которые были бы созданы
possible-completions. menu-complete ()-
Аналогично
complete, но замещает завершаемое слово одним
совпадением из списка возможных завершений. Повторяемое выполнение
menu-completeобходит список возможных завершений, вставляя
каждое совпадение по очереди. В конце списка завершений издается
звуковой сигнал и восстанавливается исходный текст. Аргумент n
перемещает на n позиций вперед в списке совпадений; отрицательный
аргумент может использоваться для перемещения по списку назад. Эта
команда предназначается для привязки к TAB, но по умолчанию не
привязана. delete-char-or-list ()-
Удаляет знак в позиции курсора, если он не находится в начале или конце
строки (какdelete-char). Если курсор находится в конце строки,
поведение аналогичноpossible-completions. Эта команда по
умолчанию не привязана.
Клавиатурные макросы
start-kbd-macro (C-x ()-
Начать сохранение вводимых символов в текущий клавиатурный макрос.
end-kbd-macro (C-x ))-
Прекратить сохранение вводимых символов в текущий клавиатурный макрос и
запомнить его определение. call-last-kbd-macro (C-x e)-
Выполнить последний определенный клавиатурный макрос, выводя символы
макроса так, как если бы он набирался на клавиатуре.
Некоторые другие команды
re-read-init-file (C-x C-r)-
Считать содержание файла inputrc, и подключить любые найденные там
привязки клавиш и присвоения переменных. abort (C-g)-
Прервать текущую команду редактирования и издать звук на терминале
(зависит от установкиbell-style). do-uppercase-version (M-a, M-b, M-x, ...)-
Если метафицированный знак x находится в нижнем регистре,
выполнить команду, привязанную к соответствующему символу в верхнем
регистре. prefix-meta (ESC)-
Метафицировать следующий введенный вами символ. Это для клавиатур, не
имеющих клавиши Meta. Ввод `ESC f’ эквивалентен вводу
M-f. undo (C-_, C-x C-u)-
Наращиваемая отмена, запоминаемая отдельно для каждой строки.
revert-line (M-r)-
Отменить все изменения, сделанные в этой строке. Это аналогично
выполнению достаточного числа раз командыundo, чтобы вернуться в
начало. tilde-expand (M-~)-
Выполнить раскрывание знака тильды для текущего слова.
set-mark (C-@)-
Установить отметку в текущей точке. Если задан числовой аргумент,
отметка устанавливается в указанной позиции. exchange-point-and-mark (C-x C-x)-
Поменять местами точку и отметку. Текущая позиция курсора устанавливается
в сохраненную позицию, а старое положение курсора запоминается как отметка. character-search (C-])-
Считывается символ, и точка перемещается к следующему появлению этого
символа. Отрицательный аргумент производит поиск вхождения символа в
обратном направлении. character-search-backward (M-C-])-
Считывается символ, и точка перемещается к предыдущему появлению этого
символа. Отрицательный аргумент производит поиск последующих вхождений
символа. insert-comment (M-#)-
Значение переменной
comment-beginвставляется в начало текущей
строки, и строка вводится, так как если бы был введен знак ввода строки. dump-functions ()-
Напечатать все функции и их привязки к клавишам в выходной поток
Readline. Если задан числовой аргумент, вывод форматируется так, что он
может быть сделан частью файла inputrc. По умолчанию, эта команда
не привязана. dump-variables ()-
Напечатать все устанавливаемые переменные и их значения в выходной поток
Readline. Если задан числовой аргумент, вывод форматируется так, что он
может быть сделать частью файла inputrc. Эта команда по умолчанию
не привязана. dump-macros ()-
Напечатать все последовательности клавиш Readline, привязанные к
макросам, и выводимые ими строки. Если задан числовой аргумент, вывод
форматируется так, что он может быть сделан частью файла inputrc.
Эта команда по умолчанию не привязана.
Режим vi Readline
Хотя библиотека Readline не имеет полного набора функций редактирования
vi, она все же содержит достаточно для простого редактирования
строки. Режим vi Readline функционирует так, как определено в
стандарте POSIX 1003.2.
Для интерактивного переключения между режимами редактирования
emacs и vi, используйте команду M-C-j
(toggle-editing-mode).
По умолчанию, Readline использует режим emacs.
Когда вы вводите строку в режиме vi, вы уже находитесь в режиме
`вставки’, как если бы вы набрали `i’. Нажатие ESC
переключает вас в `командный’ режим, в котором вы можете редактировать
текст строки стандартными клавишами перемещения vi, перемещаться
к предыдущим строкам истории посредством `k’ и к последующим
строкам посредством `j’, и так далее.
Использование истории в интерактивном режиме
Эта глава описывает, как использовать библиотеку GNU History
интерактивно, c точки зрения пользователя. Она должна рассматриваться
как руководство пользователя.
Раскрывание истории
Библиотека History обеспечивает средства раскрывания истории, подобные
предоставляемым csh. Этот раздел описывает
синтаксис, использующийся для управления информацией истории.
Раскрывание истории вводит слова из списка истории во входной поток,
облегчая повторение команд, вставку аргументов предыдущей команды в
текущую строку ввода, или быстрое устранение ошибок в предыдущей
команде.
Раскрывание истории происходит в два этапа. Первый заключается в
определении, какая из строк списка истории должна использоваться
в процессе замены. На втором этапе выбираются части этой строки для включения
в текущую. Строка, выбранная из истории, называется событием, а
использованные части называются словами. Существуют различные
модификаторы для манипулирования выбранными словами. Строка
разбивается на слова так же, как это делает Bash, так что несколько
слов, заключенных в кавычки, рассматриваются как одно слово.
Раскрывания истории вводятся появлением знака раскрывания истории, по
умолчанию `!’.
Указатели событий
Указатель событий является ссылкой на запись командной строки в
списке истории.
!-
Начать подстановку истории, если только за
!не следует пробел,
знак табуляции, знак конца строки, `=’ или `(‘. !n- Сослаться на командную строку с номером n.
!-n- Сослаться на командную строку, отстоящую на n строк назад.
!!- Сослаться на предыдущую команду. Это синоним для `!-1′.
!строка- Сослаться на самую последнюю команду, начинающуюся со строки.
!?строка[?]-
Сослаться на самую последнюю команду, содержащую строку. `?’
в конце может быть опущен, если знак новой строки следует немедленно за
строкой. ^строка1^строка2^-
Быстрая подстановка. Повторяет последнюю команду, заменяя строку1
на строку2. Эквивалентно!!:s/строка1/строка2/. !#- Вся командная строка, введенная до этого момента.
Указатели слов
Указатели слов используются для выбора желаемых слов из события.
Спецификация события отделяется от указателя слова двоеточием.
Его можно опустить, если указатель слова начинается с `^’,
`$’, `*’, `-‘ или `%’. Слова нумеруются от начала
строки, причем первому слову присваивается номер 0 (ноль). Слова
вставляются в текущую строку, разделенные одиночными пробелами.
Например,
!!-
обозначает предыдущую команду. Когда вы это вводите, предыдущая команда
повторяется один к одному. !!:$-
обозначает последний аргумент предыдущей команды. Это может быть
сокращено как!$. !fi:2-
обозначает второй аргумент самой последней команды, начинавшейся с букв
fi.
Вот указатели слов:
0 (ноль)- Нулевое слово. Для многих приложений, это командное слово.
n- n-ное слово.
^- Первый аргумент, то есть слово 1.
$- Последний аргумент.
%- Слово, соответствующее самому последнему поиску `?строка?’.
x-y- Диапазон слов; `0-y‘ сокращается как `-y‘.
*-
Все слова, за исключением нулевого. Это синоним для `1-$’. Даже
если в событии имеется только одно слово, использование `*’ не
является ошибкой; в этом случае возвращается пустая строка. x*- Сокращение для `x-$’
x--
Сокращает `x-$’ как `x*’, но опускает последнее
слово.
Если указатель слова задается без указания события, в качестве события
используется предыдущая команда.
Модификаторы
После необязательного указателя слова, вы можете добавить
последовательность из одного или более следующих модификаторов,
перед каждым из которых ставится двоеточие.
h- Удалить заключительную компоненту имени пути, оставляя только начальную.
r-
Удалить заключительный суффикс, имеющий форму `.суффикс‘,
оставляя базовое имя. e- Удалить все, кроме заключительного суффикса.
p- Напечатать новую команду, но не выполнять ее.
s/старое/новое/-
Заменить первое появление старое на новое в строке
события. На месте `/’ может использоваться любой разделитель.
Разделитель может быть включен в старое или новое с помощью
обратной косой черты. Если в новое появляется символ `&’, он
заменяется на старое. Одиночная обратная косая черта
экранирует `&’. Заключительный разделитель необязателен, если он
является последним символов во входной строке. &- Повторить предыдущую подстановку.
g-
Велит применить изменения ко всей строке события. Используется вместе с
`s’, как вgs/старое/новое/, или с `&’.
Форматирование документации
Выпуск 4 GDB содержит уже отформатированную справочную
карточку, готовую к печати с PostScript или Ghostscript, в подкаталоге
`gdb' главного исходного каталога(19). Если вы можете использовать PostScript или Ghostscript с
вашим принтером, вы можете распечатать справочную карточку немедленно из
`refcard.ps'.
Выпуск также включает исходный текст справочной карточки. Вы можете
отформатировать ее при помощи TeX, набрав:
make refcard.dvi
Справочная карточка GDB разработана для печати в режиме
landscape на бумаге американского размера «letter»; то есть на листе
шириной 11 и высотой 8.5 дюймов. Вы должны будете указать
этот формат печати в качестве ключа к вашей программе вывода DVI.
Вся документация для GDB поставляется как часть машинно-считываемого
дистрибутива. Документация написана в формате Texinfo, который
является системой построения документации, использующей один исходный файл,
для создания как интерактивного, так и печатного руководства. Вы
можете использовать одну из команд форматирования Info, чтобы создать
интерактивную версию документации, и TeX (или texi2roff) для
создания печатной версии.
GDB включает уже отформатированную копию интерактивной версии Info
этого руководства в подкаталоге `gdb'. Основной файл Info—
`gdb-5.0/gdb/gdb.info', он ссылается на подчиненные файлы
`gdb.info*’ в том же каталоге. В случае необходимости,
вы можете распечатать эти файлы, или прочитать их в любом редакторе; но
их легче прочитать, используя подсистему info в GNU Emacs или
автономную программу info, доступную как часть дистрибутива GNU
Texinfo.
Если вы хотите форматировать эти Info-файлы самостоятельно, вам
нужна одна из программ форматирования Info, например
texinfo-format-buffer или makeinfo.
Если у вас установлена программа makeinfo, и вы находитесь на верхнем
уровне иерархии каталогов GDB (`gdb-5.0' в
случае версии 5.0), вы можете создать файл Info, набрав:
cd gdb make gdb.info
Если вы хотите сформировать и распечатать копии этого руководства, вам
нужен TeX, программа печати его выходных DVI-файлов и файл
определений Texinfo `texinfo.tex'.
TeX—это программа форматирования; она не печатает файлы непосредственно, а
создает выходные файлы, называемые DVI-файлами. Чтобы напечатать
сформатированный документ, вам нужна программа печати DVI-файлов.
Если в вашей системе установлен TeX, в ней, возможно, есть такая
программа. Какую точно команду нужно использовать зависит от вашей
системы; lpr -d является общей; другая программа (для
PostScript-устройств)—это dvips. Команда печати DVI-файлов
может требовать имя файла без расширения или с расширением `.dvi’.
TeX также требует файл макроопределений `texinfo.tex'. Этот файл
сообщает TeX, как форматировать документ, написанный в формате
Texinfo. Сам по себе TeX не может читать или форматировать
файл Texinfo. `texinfo.tex' распространяется с GDB и
размещается в каталоге `gdb-номер-версии/texinfo'.
Если у вас установлены TeX и программа печати DVI, вы можете
отформатировать и распечатать это руководство. Сначала перейдите в
подкаталог `gdb'
главного исходного каталога (например, в `gdb-5.0/gdb'), и
наберите:
make gdb.dvi
Это передаст `gdb.dvi' вашей программе печати DVI.
Установка GDB
GDB поставляется вместе со сценарием configure, который
автоматизирует процесс подготовки GDB к установке; затем вы можете
использовать make для построения программы gdb.
(20)
Дистрибутив GDB включает весь исходный код, который вам
понадобится для GDB, в одном каталоге, имя которого обычно
составляется добавлением номера версии к `gdb’.
Например, дистрибутив GDB версии 5.0 находится в каталоге
`gdb-5.0'. Этот каталог содержит:
gdb-5.0/configure (и файлы поддержки)- сценарий для конфигурации GDB и всех поддерживаемых библиотек
gdb-5.0/gdb- исходные тексты, специфичные для самого GDB
gdb-5.0/bfd-
исходные тексты для библиотеки описания двоичных файлов (Binary File
Descriptor) gdb-5.0/include- включаемые файлы GNU
gdb-5.0/libiberty-
исходные тексты для `-liberty’ библиотеки свободного программного
обеспечения gdb-5.0/opcodes- исходные тексты библиотеки таблиц кодов операций и дисассемблеров
gdb-5.0/readline- исходные тексты интерфейса командной строки GNU
gdb-5.0/glob-
исходные тексты подпрограммы GNU сопоставления с образцом имени
файла gdb-5.0/mmalloc- исходные тексты пакета GNU для выделения памяти
Простейший способ сконфигурировать и собрать GDB состоит в
выполнении configure из исходного каталога
`gdb-номер-версии', который в этом примере есть
`gdb-5.0'.
Сперва перейдите в исходный каталог `gdb-номер-версии', если вы
еще не находитесь в нем; затем запустите configure. Передайте в
качестве аргумента идентификатор платформы, на которой будет выполняться
GDB.
Например:
cd gdb-5.0 ./configure платформа make
где платформа—идентификатор, такой как `sun4′ или
`decstation’, задающий платформу, на которой будет выполняться
GDB. (Часто вы
можете опустить платформу; configure пытается определить
корректное значение, изучая вашу систему.)
Выполнение `configure платформа‘ и затем make строят
библиотеки `bfd', `readline', `mmalloc' и
`libiberty', и затем сам gdb. Сконфигурированные исходные
файлы, а также двоичные файлы, остаются в соответствующих исходных каталогах.
configure является сценарием оболочки Bourne (/bin/sh); если
ваша система не распознает это автоматически, когда вы находитесь в
другой оболочке, вам может потребоваться выполнить sh явно:
sh configure платформа
Если вы выполните configure из каталога, содержащего исходные
каталоги для нескольких библиотек или программ, например
`gdb-5.0' для версии 5.0, configure
создает файлы конфигурации для всех подкаталогов низшего уровня (если вы не
велите ему не этого делать ключем `—norecursion’).
Вы можете выполнить сценарий configure из любого подкаталога из
поставки GDB, если вы хотите сконфигурировать только этот
подкаталог, но убедитесь, что указали путь к нему.
Например, для версии 5.0, чтобы сконфигурировать только подкаталог
bfd, введите:
cd gdb-5.0/bfd ../configure платформа
Вы можете установить gdb куда угодно; он не имеет никаких
жестко заданных путей. Однако, вы должны удостовериться, что ваша оболочка
(определяемая переменной среды `SHELL’) доступна всем для чтения.
Помните, что GDB использует оболочку для запуска вашей программы—
некоторые системы не позволяют GDB отлаживать дочерние
процессы, чьи программы недоступны для чтения.
Компиляция GDB в другом каталоге
Если вы хотите запускать версии GDB на нескольких рабочих или
целевых машинах, вам нужны различные gdb, скомпилированные для
каждой комбинации рабочей и целевой машины. configure разработан
так, чтобы облегчить это, позволяя вам создавать каждую конфигурацию в
отдельном подкаталоге, а не в исходном каталоге. Если ваша программа
make поддерживает возможности `VPATH’ (GNU make
это делает), вызов make в каждом из этих каталогов строит
программу gdb, определенную там.
Чтобы построить gdb в отдельном каталоге, запустите configure с
ключем `—srcdir’, для определения, где искать источник. (Вам также
нужно определить путь для поиска configure из вашего рабочего каталога.
Если путь к configure совпадает с параметром `—srcdir’,
ключ `—srcdir’ можно опустить; он подразумевается.)
Например, в версии 5.0, вы можете построить GDB в
отдельном каталоге для Sun 4 так:
cd gdb-5.0 mkdir ../gdb-sun4 cd ../gdb-sun4 ../gdb-5.0/configure sun4 make
Когда configure строит конфигурацию, используя удаленный
каталог с источниками, он создает дерево для двоичных файлов с той же
структурой (и используя те же имена), что и дерево каталогов с
исходными текстами. В этом примере, вы бы нашли библиотеку Sun 4
`libiberty.a' в каталоге `gdb-sun4/libiberty', и сам
GDB в `gdb-sun4/gdb'.
Одна из распространенных причин построения нескольких конфигураций
GDB в отдельных каталогах состоит в том, чтобы конфигурировать
GDB для кросс-компиляции (где GDB запускается на
одной машине—рабочей, в то время как отлаживаемые программы
выполняются на другой машине—целевой). Вы определяете целевую
машину кросс-отладки ключем configure `—target=цель‘.
Когда вы выполняете make для построения программы или библиотеки,
вы должны выполнять ее из сконфигурированного каталога—того каталога,
из которого вы вызывали configure (или из одного из его подкаталогов).
Makefile, который создает configure в каждом исходном
каталоге, также выполняется рекурсивно. Если вы ввели
make в каталоге с исходными файлами, например в
`gdb-5.0' (или в каталоге, сконфигурированном отдельно
посредством `—srcdir=имя-каталога/gdb-5.0′),
вы построите все требуемые библиотеки, и затем GDB.
Когда у вас имеется несколько рабочих или целевых конфигураций в
отдельных каталогах, вы можете запустить make для них параллельно
(например, если они смонтированы по NFS на каждой рабочей машине); они
не будут конфликтовать друг с другом.
Определение имен рабочих и целевых машин
Спецификации, использованные для рабочих и целевых машин в сценарии
configure, именуются в соответствии со схемой наименования,
состоящей из трех частей, но поддерживаются также некоторые короткие
предопределенные синонимы. Полная схема наименования кодирует три
фрагмента информации по следующему образцу:
архитектура-производитель-ОС
Например, вы можете использовать синоним sun4 как параметр
платформа, или как значение цель в ключе
--target=цель.
Эквивалентное полное имя—`sparc-sun-sunos4′.
Сценарий configure, сопровождающий GDB, не предоставляет
никаких средств для запроса вывода всех поддерживаемых имен рабочих и
целевых машин или их сокращений. configure вызывает скрипт
оболочки Bourne config.sub для отображения сокращений в полные
имена; при желании, вы можете посмотреть сценарий или использовать его
для проверки ваших предположений о сокращениях. Например:
% sh config.sub i386-linux i386-pc-linux-gnu % sh config.sub alpha-linux alpha-unknown-linux-gnu % sh config.sub hp9k700 hppa1.1-hp-hpux % sh config.sub sun4 sparc-sun-sunos4.1.1 % sh config.sub sun3 m68k-sun-sunos4.1.1 % sh config.sub i986v Invalid configuration `i986v': machine `i986v' not recognized
config.sub также распространяется в исходном каталоге
GDB (`gdb-5.0', для версии 5.0).
Ключи configure
Здесь приводится обзор ключей и параметров configure, которые
наиболее часто используются для построения GDB.
configure также имеет несколько других ключей, не представленных
здесь. See Info file `configure.info’, node `What Configure Does’, для полного
объяснения configure.
configure [--help]
[--prefix=каталог]
[--exec-prefix=каталог]
[--srcdir=имя-каталога]
[--norecursion] [--rm]
[--target=цель]
платформа
Если хотите, можете вводить ключи с одним `-‘, а не с `—‘;
но вы можете сокращать имена ключей, если используете `—‘.
--help-
Отображает быстрый обзор, как вызывать
configure. --prefix=каталог-
Конфигурировать источник, чтобы устанавливать программы и файлы в
подкаталогах`каталога'. --exec-prefix=каталог-
Конфигурировать источник, чтобы устанавливать программы в каталог
`каталог'. --srcdir=имя-каталога-
Предупреждение: использование этого ключа требует GNU
makeили другой программыmake, реализующей возможности
VPATH.
Используйте этот ключ для создания конфигураций в каталогах,
отдельных от исходного каталога GDB. Кроме всего прочего, вы
можете использовать его для построения (или поддержки)
нескольких конфигураций одновременно в отдельных каталогах.
configureзаписывает файлы, относящиеся к конфигурации, в текущий
каталог, но принимает меры, чтобы можно было использовать источники в
каталоге имя-каталога.configureсоздает каталоги внутри
рабочего каталога параллельно с исходными каталогами внутри имя-каталога. --norecursion-
Конфигурировать только тот уровень каталогов, где выполняется
configure; не распространять конфигурацию на подкаталоги. --target=цель-
Конфигурировать GDB для кросс-отладки программ, выполняемых на
указанной цели. Без этого ключа GDB конфигурируется для
отладки программ, выполняемых на той же машине (платформе), что и сам
GDB.
Нет никакого удобного способа сгенерировать список всех доступных
целей. платформа ...-
Конфигуровать GDB для выполнения на указанной платформе.
Нет никакого удобного способа сгенерировать список всех допустимых
платформ.
Существует также много других ключей, но обычно они требуются только для
специальных целей.
Алфавитный указатель
Jump to:
»
—
#
—
$
—
—
—
.
—
/
—
:
—
@
—
^
—
a
—
b
—
c
—
d
—
e
—
f
—
g
—
h
—
i
—
j
—
k
—
l
—
m
—
n
—
o
—
p
—
q
—
r
—
s
—
t
—
u
—
v
—
w
—
x
—
y
—
z
—
«
#
# в Модуле-2
$
$
$$
$_ и info breakpoints
$_ и info line
$_, $__ и история значений
—
--annotate
--async
--batch
--baud
--cd
--command
--core
--directory
--epoch
--exec
--fullname
--interpreter
--mapped
--noasync
--nowindows
--nx
--quiet
--readnow
--se
--silent
--statistics
--symbols
--tty
--version
--windows
--write
-b
-c
-d
-e
-f
-m
-n
-nw
-q
-r
-s
-t
-w
-x
.
., оператор области видимости Модулы-2
`.esgdbinit'
`.gdbinit'
`.os68gdbinit'
`.vxgdbinit'
/
:
::, контекст для переменных/функций
@
^
a
b
break)
backtrace)
c
продолжить)
d
delete)
disable)
down)
e
`eb.log', журнальный файл для EB29K
f
frame)
g
g++, компилятор GNU Си++
`gdb.ini'
h
help)
heuristic-fence-post (Alpha, MIPS)
i
info)
`i386-stub.c'
info frame)
info stack)
j
k
l
info list)
m
`m68k-stub.c'
n
next)
nexti)
o
p
q
quit)
r
run)
remotedebug, протокол MIPS
retransmit-timeout, протокол MIPS
s
step)
`sh-stub.c'
stepi)
`sparc-stub.c'
`sparcl-stub.c'
t
target remote
++
timeout, протокол MIPS
u
until)
v
w
x
y
z
{
а
ц
д
ф
г
и
к
л
м
н
о
п
breakpoint, удаленная
target remote
remotedebug
я
р
с
т
у
ж
в
з
ч
Ф
М
П
С
++
(1)
В Си++ и других
объектно-ориентированных языках программирования, у вас может быть
несколько функций с одним именем, но с аргументами разных типов.
Например:
int add_two(int a, int b); double add_two(double a, double b); double add_two(double a, int b);
Компилятор генерирует код для вызова верной функции по заданным
аргументам. Это называется перегрузкой функций.
Однако, компоновщик требует, чтобы все символы имели недвусмысленные
имена. Поэтому компилятор шифрует (от английского «mangle»)
имена перегруженных функций так, чтобы они включали типы аргументов и
возвращаемые значения. К примеру, приведенные выше функции могут быть
могут быть зашифрованы примерно так:
add_two_Ret_int_int_int add_two_Ret_double_double_double add_two_Ret_double_double_int
(в действительности шифрованные имена выглядят безобразнее). В
результате компоновщик может правильно обработать перегруженные функции.
Дешифровщик (от английского «demangler»)—это программа (или
функция), которая выполняет обратную операцию: анализируя зашифрованные
имена, она выдает исходную сигнатуру функции. Это необходимо, чтобы
отобразить то, что программист сможет понять и связать с исходным
текстом своей программы. Для этого любому средству отладки,
поддерживающему Си++, обычно требуется дешифровщик. (Прим. переводчика)
(2)
m4: Конец ввода: 0: фатальная ошибка: EOF в строке (Прим. переводчика)
(3)
Программа завершилась нормально. (Прим. переводчика)
(4)
GDB, собранный со средствами
DJGPP для MS-DOS/MS-Windows, поддерживает этот режим
функционирования, но цикл событий приостанавливается, когда выполняется
отлаживаемая программа.
(5)
Нить с идентификатором 1 неизвестна. Используйте команду «info threads», чтобы получить идентификаторы известных нитей. (Прим. переводчика)
(6)
Выражение не может быть реализовано с помощью точки наблюдения чтения/доступа. (Прим. переводчика)
(7)
Аппаратная точка наблюдения номер: Не удается поместить точку наблюдения (Прим. переводчика)
(8)
В текущем контексте нет символа «foo». (Прим. переводчика)
(9)
Не удается поместить точки останова. Эта программа может выполняться в другом процессе. (Прим. переводчика)
(10)
Остановлено; не удается поместить точки останова. Вы могли запросить слишком много аппаратно-поддерживаемых точек останова и наблюдения. (Прим. переводчика)
(11)
`b’ не может быть использовано, потому что эти символы
формата также используются с командой x, где `b’ означает
«byte»; смотрите section Исследование памяти.
(12)
На машинах, где
стек растет вниз в памяти (в наши дни, на большинстве машин), это способ
удалить одно слово из стека. Это подразумевает, что выбран самый
внутренний кадр; когда выбраны другие кадры стека, установка
$sp не разрешена. Используйте return для извлечения
целого кадра из стека, вне зависимости от архитектуры машины; смотрите
section Возврат из функции.
(13)
Если, например, вызов процедуры используется в
выражении, то эта процедура вызывается со всеми своими побочными
эффектами. При неаккуратном использовании это может привести к
путанице.
(14)
от
`Binary File Descriptor’ (библиотека описания двоичных файлов).
(Прим. переводчика)
(15)
Если вы
выберете номер порта, который конфликтует с другим сервисом,
gdbserver печатает сообщение об ошибке и завершает работу.
(16)
Универсальный отладочный интерфейс. (Прим.
переводчика)
(17)
виртуальный адрес памяти (Прим. переводчика)
(18)
В системах DOS/Windows, домашним каталогом
считается тот, который указывает переменная среды HOME.
(19)
В
`gdb-5.0/gdb/refcard.ps' в версии 5.0
выпуска.
(20)
Если у вас более новая версия GDB, чем 5.0,
просмотрите файл `README' в исходном каталоге; мы могли
усовершенствовать процедуру установки с момента публикации этого
руководства.
Если вам понравилась статья, поделитесь ею с друзьями:
Reading time
4 min
Views 14K

GDB is THE debugger for Linux programs. It’s super powerful. But its user-friendliness or lack thereof can actually make you throw your PC out of the window. But what’s important to understand about GDB is that GDB is not simply a tool, it’s a debugging framework for you to build upon. In this video, I’m gonna walk you through GDB setup for reverse engineering and show you all of the necessary commands and shortcuts for your debugging workflow.
GDB Setup With Plugins
The most common mistake I see is that people perceive GDB as a standalone debugger tool. I suggest you think of GDB as a debugger framework that allows you to build your own tools. Or you can use premade tools. My GDB-based tool of choice is Peda. It’s pretty easy to install, just follow installation instructions from Peda repository: https://github.com/longld/peda
git clone https://github.com/longld/peda.git ~/peda
echo "source ~/peda/peda.py" >> ~/.gdbinitProgram example
I’ll be using this simple program as our debugging target:
#include <stdio.h>int main() {int x = 5;printf("x = %dn", x);x = x + 5;printf("x = %d", x);return 0;}This code creates local variable X on the stack, prints its value to the console, then adds 5 to X, and prints its value again. Pretty simple, just what we need for our learning example.
First Steps with Debugging a Program
To open a file in GDB, type gdb [filename] in the console. GDB will open and load your file. Notice, that code execution hasn’t started. That’s because there’s a separate command to start the execution, it’s called run, or r for short.

And if we start it, our program successfully completes execution. That’s because we haven’t set any breakpoints yet. We can set a breakpoint using symbol name, for example, break main, or using address: `break *0x555555555149`. You can print a list of all your breakpoints with ‘info breakpoints’ and delete them with delete <breakpoint number>.

Now if I issue run command, the execution conveniently stops at the beginning of the “main” function. And just to save us some time we can use command start which comes from Peda instead of doing all of this. This command will do all this work for us.
Of course, as with any other debugger, we can use single-stepping with command step or stepi.
And if you like to do single-stepping a lot, note, that pressing ‘Return’ on an empty line will make GDB execute the previous command you entered once more. Also, you can use command next to single step without entering function calls.
To step through several instructions at once you can use command next <number of instructions>.
If you want to continue execution to a certain point in a program (for example to exit a loop), you can use command xuntil <address or function>.
Modifying Registers
To modify registers, use following construction set$<register name> = 1234. For example, if I want to skip incrementing X, I can change the value of RIP register to 0x555555555176 with command set $RIP = 0x555555555176.
![]()
As you might have noticed, you can treat registers like variables in GDB. So I can assign RIP value of EAX with set $rip = $eax command. Now I can issue context command to make Peda reprint its beautiful context “window” to make sure that RIP points to some nonsense.

And I want to start execution from the start of ‘main’ function I can just write set $rip = main.
By the way, with Peda you have a faster way to skip instructions without executing them with skipi command.
Modifying Memory
Modifying memory is similar to modifying registers in the sense that any memory location can be a variable in GDB. So in my example, I want to change the contents of the format string “x = %d”. This string is located at 0x555555556004 in my binary. I can use this address as a variable and type in the same command as with registers: set 0x555555556004 = “AAAA%d”. But in this case, we’ll see an error message. That’s because you should always provide a variable type when modifying memory in GDB. So let me correct my command to set {char[7]}0x555555556004 = “AAAA%d”.

Print xprint hexdump hexprint
You can use the command x to examine memory. For example, if I want to print 20 8-byte words from the stack pointer, I’ll use command x/20xg $rsp: 20 — the number of words, x — hexadecimal format, g — giant (8-byte words).

By changing the second x to i you can print memory as instructions.

The full list of supported modifiers you can find in the documentation:
From https://sourceware.org/gdb/current/onlinedocs/gdb/Memory.html
You can use the command
x(for “examine”) to examine memory in any of several formats, independently of your program’s data types.
x/nfu addrx addrxUse thexcommand to examine memory.n, f, and u are all optional parameters that specify how much memory to display and how to format it; addr is an expression giving the address where you want to start displaying memory. If you use defaults for nfu, you need not type the slash ‘/’. Several commands set convenient defaults for addr.
n, the repeat countThe repeat count is a decimal integer; the default is 1. It specifies how much memory (counting by units u) to display. If a negative number is specified, memory is examined backward from addr.f, the display formatThe display format is one of the formats used by
xorbBytes.hHalfwords (two bytes).wWords (four bytes). This is the initial default.gGiant words (eight bytes).
Also, Peda provides you with a convenient hexdump address /count (dump “count” lines, 16-bytes each) command which you can use… well, to display hex dump.

And if you want to print again all the stuff Peda shows to you (instructions, registers, stack, etc.), you command context.
Final Thoughts
So today we’ve seen a glimpse of GDB functionality. To sum up, I want you to take home 3 things:
-
use Peda or a different GDB plugin that suits you
-
use ‘break’ and ‘delete’ commands to control breakpoints
-
use ‘x’ command to print memory contents
If you have any further questions on GDB, please leave a comment below. Like the article, if you want more content like this. And happy hacking, you guys.
As always, instead of reading this article, you can watch the full video (bonus outtakes and cats included):