ООО «ЮНИКО-СИС», официальный представитель научно-производственной компании UNITED PRODUCTS & INSTRUMENTS (USA), представляет серию спектрофотометров UNICO 280X SpectroQuest, отличающуюся легкостью в освоении, простотой и удобством в работе, максимальной надежностью, превосходными аналитическими характеристиками.
Однолучевой спектрофотометр UNICO модель 2800.
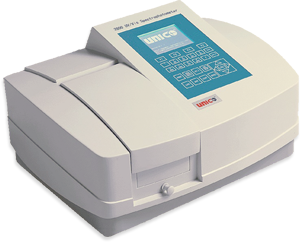 Работающий в спектральном диапазоне 190-1100 нм, является самой экономичной разработкой в серии однолучевых приборов UNICO 280X. Эта модель, имеющая спектральную щель 4 нм и скорость сканирования до 1000 нм/мин специально адаптирована для отечественных условий и выпускается с учетом российских лабораторных требований. Прибор отличается высокой точностью определения процента пропускания/ оптической плотности, установки длины волны, разрешением 0,1 нм и прекрасной временной стабильностью.
Спектрофотометр UNICO 2800 является настольным прибором, оснащенным большим информативным жидкокристаллическим экраном.(320х240 точек), 29-знаковой клавиатурой, встроенным мощным процессором, позволяющим проводить все аналитические измерения без подключения к персональному компьютеру. Режимы измерений, градуировки и полученные спектры хранятся в энергонезависимой памяти. Для вывода информации предусмотрены порты для подключения принтера и компьютера. Для удобства хранения и обработки данных на персональном компьютере разработано специальное программное обеспечение, обеспечивающее перенос данных, составление отчетов, представление результатов измерений.
Вместительное отделение для проб позволяет размещать кюветы длиной до 100 мм. Предлагается широкий ряд держателей проб/кювет и дополнительных принадлежностей. Возможна установка кассеты для программируемой автоматической смены 8-ми квадратных кювет 10х10 мм. Для медико-биологических измерений особенно интересна проточная терморегулируемая (15-40оС) система с собственным перистальтическим насосом и программатором температуры на Пельтье-элементах.
Конструкция спектрофотометров UNICO серии 280Х основана на оригинальных оптических элементах с защитным покрытием, смонтированных на мощной плите. Источниками излучения служат дейтериевая и галогеновая лампы, доступные для самостоятельной смены и юстировки. Программный счетчик времени работы ламп позволяет планировать их эксплуатацию и своевременную замену.
Метрологическая поддержка.
На основании положительных результатов испытаний спектрофотометр UNICO модель 2800 внесен как тип в государственный реестр средств измерений РФ и зарегистрирован под № 54737-13
Спектрофотометры UNICO 2800 имеют описание типа средств измерений, снабжаются свидетельством о госпроверке, методикой поверки, руководством по эксплуатации на русском языке.
Приборы подлежат ежегодной поверке силами ЦСМ на местах с использованием стандартных поверочных средств.
Технические характеристики
| Технические характеристики | Модель UNICO 2800 |
| 1. Спектральный диапазон, нм | 190 — 1100 |
| 2. Диапазон измерений спектральных коэффициентов направленного пропускания, % | 1-99 |
| 3. Диапазон показаний спектральных коэффициентов направленного пропускания, % | 0 — 200 |
| 4. Диапазон измерений оптической плотности, Б | 0,01 — 3,0 |
| 5. Диапазон показаний оптической плотности, Б | -0,3 — 3,0 |
| 6. Пределы допускаемой абсолютной погрешности спектрофотометров при измерении спектральных коэффициентов направленного пропускания, % | |
| от 400 до 800 нм | ±0,5 |
| 190 до 400 нм и от 800 до 1100 нм | ±1,0< |
| 7. Пределы допускаемой абсолютной погрешности установки длин волн, нм | ±1,0 |
| 8. Выделяемый спектральный интервал, нм | 4 |
| 9. Уровень рассеянного света, %, не более | 0,15 |
| 10. Дрейф показаний, Б/ч, не более | ±0,002 |
| 11. Отклонение нулевой линии от среднего значения (в диапазоне от 300 до 800 нм), Б, не более | ±0,004 |
| 12. Габаритные размеры (Д*Ш*В), мм | 650*540* 390 |
| 13. Масса, кг | 24 |
| 14. Средний срок службы, лет | 8 |
| 15. Потребляемая мощность, В·А | 195 |
| 16. Напряжение питания частотой (50 ± 1) Гц, В | 220 (+15 -20)% |
| 17. Условия эксплуатации: | |
| -диапазон температур окружающего воздуха, 0С | 15 — 30 |
| -диапазон относительной влажности окружающего воздуха (при 25 0С), % | 20 — 80 |
| — диапазон атмосферного давления, кПа | 84 — 106 |
Стандартный комплект поставки
- Спектрофотометр — 1
- Шнур питания — 1
- Чехол от пыли — 1
- Лампа галогеновая запасная — 1
- 4-х позиционный держатель для кювет 10х10 мм — 1
- 3-х позиционный держатель для кювет 10-100мм*24 мм — 1
- Кювета кварцевая 10х10 мм — 2
- Кювета стеклянная 10х10 мм — 4
- Руководство по эксплуатации на русском языке — 1
- Сертификат — 1
- Паспорт — 1
- Методика поверки — 1
- Свидетельство о первичной поверке (либо клеймо поверителя в паспорте) 1
Дополнительные принадлежности (поставляются по заказу).
- Держатель для цилиндрических кювет 8-20 мм.
- 4-х позиционный держатель для кювет 10х100 мм.
- Держатель кюветы 10х10 мм с водяной рубашкой
- Микрокювета для проб до 10 мкл.
- Держатель для измерения отражательной способности
- 8-позиционный автоматический держатель — сменщик кювет
- Контроллер температуры на Пельте-элементах
- Перистальтический насос с проточной кюветой
- Кюветы различных размеров и материалов.
- Пакет обработки и передачи данных (ПО) — Позволяет обрабатывать данные, полученные на автономных сканирующих спектрофотометрах серии SpectroQuest, мод. 2800 – 2804. Поставляется на CD в комплекте с электронным ключом в USB-порт компьютера, описание на русском языке.
- Manuals
- Brands
- Unico Manuals
- Measuring Instruments
- UV-2800
Manuals and User Guides for Unico UV-2800. We have 1 Unico UV-2800 manual available for free PDF download: Service Manual
-
1
Contents
Safety . 2
G e n e r a l . 2
E l e c t r i c a l . . 2
Warning . . 2
P e r f o r m a n c e 3
Radio Interference . . 3
I n t r o d u c t i o n 3
W o r k i n g P r i n c i p l e . . 4
Unpack ing Ins t ruc t ions . 4
Specifications .. 5
Installation . 5
Operation .. 6
Prepare the Spectrophotometer 6
Description of keys 6
Turn on spectrophotometer . . 7
Basic operation . 8
Analyse Sample 12
Basic Mode . . 12
Quantitative . . 15
WL Scan . . . 20
Kinetics . 2 5
DNA/Protein 28
Multi Wavelength .. 31
Set t ing and Cal ibra t ion . 33
Utility 3 3
Defined Tests . . . 4 3
Appendix A . . 4 6
A p p e n d i x B 47
A p p e n d i x C 54
-
2
Safety: The safety statements in this manual comply with the
requirements of the HEALTH AND SAFETY AT WORK ACT, 1974. Read the
following before installing and using the instrument and its
accessories. The UNICO UV-2800 should be operated by appropriate
laboratory technicians. General: The apparatus described in this
manual is designed to be used by properly trained personnel in a
suitable equipped laboratory. For the correct and safe use of this
apparatus it is essential that laboratory personnel follow
generally accepted safe procedures in addition to the safety
precautions called for in this manual. The covers on this
instrument may be removed for servicing. However, the inside of the
power supply unit is a hazardous area and its cover should not be
removed under any circumstances. There are no serviceable
components inside this power supply unit. For UNICO UV-2800, avoid
touching the high voltage power supply at all times. Some of the
chemicals used in spectrophotometry are corrosive and/or
inflammable and samples may be radioactive, toxic, or potentially
infective. Care should be taken to follow the normal laboratory
procedures for handling chemicals and samples. Electrical: Before
switching on the apparatus, make sure it is set to the voltage of
the local power supply (see Installation). The power cord shall be
inserted in a socket provided with a protective earth contact. The
protective action must not be negated by the use of an extension
cord without a protective conductor. Warning: Any interruption of
the protective conductor inside or outside the apparatus or
disconnection of the protective earth terminal is likely to make
the apparatus dangerous. Intentional interruption is prohibited.
Whenever it is likely that the protection has been impaired, the
apparatus shall be made inoperative and be secured against any
unintended operation. NEVER touch or handle the power supply on
UNICO UV-2800 due to the high voltage. The protection is likely to
be impaired if, for example, the apparatus Shows visible damage
Fails to perform the intended measurements Has been subjected to
prolonged storage under unfavorable conditions Has been subjected
to severe transport stresses -
3
Performance: To ensure that the instrument is working within its
specification, especially when making measurements of an important
nature, carry out performance checks with particular reference to
wavelength and absorbance accuracy. Performance checks are detailed
in this manual. Radio Interference: For compliance with the EMC
standards referred to in the EC Declaration of Conformity, it is
necessary that only shielded cables supplied by us are used when
connecting the instrument to computers and accessories.
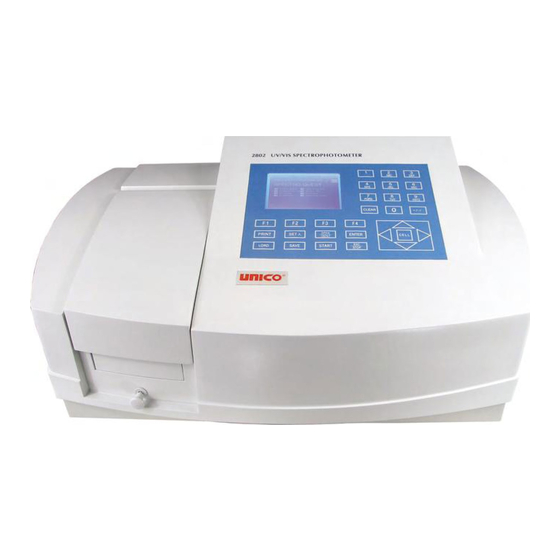
Introduction: The UNICO UV-2800 model spectrophotometer (Fig 1) is
a single beam, general purpose instrument designed to meet the
needs of the Conventional Laboratory, The UNICO UV-2800 model
spectrophotometer is ideal for various applications, such as:
Chemistry, Biochemistry, Petrochemistry, Environmental Protection,
Food and Beverage Labs, Water and Waste Water Labs and other fields
of quality control and research. The UNICO UV-2800 model
spectrophotometer incorporates a 320240 dot matrix LCD display for
photometric results, easy operation and wavelength range of 190nm
to 1100nm. This instrument is ideal for measurements in the visible
and ultraviolet wavelength region of the electromagnetic
spectrum.Sample Compartment Lid
Keypad
LCD Display
Rod
-
4
PowerSupply Fan
PowerSocket
PrinterInterface
Contrast Adjusterof LCD
PowerSwitch
110V/220VSelect Switch
SerialComm.
Fig1
Working Principle: The spectrophotometer consists of five parts:
1) Halogen or deuterium lamps to supply the light; 2) A
Monochromator to isolate the wavelength of interest and eliminate
the unwanted second order radiation; 3) A sample compartment to
accommodate the sample solution; 4) A detector to receive the
transmitted light and convert it to an electrical signal; and 5) A
digital display to indicate absorbance or transmittance. The block
diagram (Fig 2) below illustrates the relationship between these
parts. Block diagram for the SpectrophotometerLight Mono- Sample Detector Display Source chromator
CompartmentFig 2
In your spectrophotometer, light from the lamp is focused on the
entrance slit of the monochromator where the collimating mirror
directs the beam onto the grating. The grating disperses the light
beam to produce the spectrum, a portion of which is focused on the
exit slit of the monochromator by a collimating mirror. From here
the beam is passed to a sample compartment through one of the
filters, which helps to eliminate unwanted second order radiation
from the diffraction grating. Upon leaving the sample compartment,
the beam is passed to the silicon photodiode detector and causes
the detector to produce an electrical signal that is displayed on
the digital display. Unpacking Instructions: Carefully unpack the
contents and check the materials against the following packing list
to ensure that you have received everything in good condition.100%T 0 A
-
5
Packing List Description Quantity
Spectrophotometer…………………………………………………
1 Mains
Lead…………………………………………………………….
1
Cuvettes…………………………………………………………………
Set of 4, glass…………………………………………………………..
Set of 2, quartz Dust
Cover……………………………………………………………..
1 Manual
…………………………………………………………………..
1 Specifications: Wavelength Range: 190-1100nm Spectral Bandpass:
4nm Wavelength Accuracy: 0.8nm Wavelength Repeatability: 0.05nm
Stray Radiant Energy: 0.15%@220nm&340nm Photometric Range:
0-200%T,-0.3-.2.8A Noise: -
6
Operation: Prepare the spectrophotometer Fig 3 is the control
panel. User can perform all operations by pressing the keys and all
the results and operation information are displayed on the LCD.6MNO +/-/.
9WXYZ 0
8TUV
7PQRS
PRINT 0Abs100%T
SET ESCSTOP
ESCSTOP
LOAD SAVE START ENTER
CELL
F1 F2 F3 F4
1CLEAR
4GHI
5JKL
3DEF
2ABC
LCD
Functionkeys
Numerickeys
Controlkeys
Fig 3
Description of keys LOAD Load data or curve saved before; SAVE
Save data or curve; SET Set wavelength; 0Abs/100%T Blank or scan
the base line; PRINT Print test results or screen START Start
testing or scanning sample; ESC/STOP Exit to previous screen or
cancel the operation; ENTER Confirm the inputted data or selected
item; Go into nextsetup or screen; F1-F4 Function based on the information on the
screen; 0-9 Input number or letter, consecutively press a numeric
keyto select a character; +/-/. Input +,- or dot; CLEAR Clear all
characters when you are inputting or clear curvedisplays on the screen;
-
7
, Change x scale; Search point after scan; clear a
character;, Change y scale; Search peak after scan; Scroll items for
selecting; Change capital/small letter last typed in; Browse the
items for selection;CELL Set cell position. Turn on spectrophotometer Turn on
spectrophotometer by pressing the Power Switch (IO)(see Fig1). The
instrument starts to initiate and the steps are as below:1.The instrument will check memory first (Fig 4), please wait or
press any key to skip this step ,after positioning filter,
auto-cell changer(if installed) and D2/W lamps,the screen display
as Fig 4A. 15 minutes pass or pressESC, the screen display as Fig
5,Select No to skip to main menu( Fig 7) and select
Yes(recommended) to calibrate system (Fig 6).The calibrating
process include get dark current, searching 656.1nm and check
energy.After finish the calibration system,go to main menu too (Fig
7).2.If the data in memory has been lost, the instrument will
directly calibrate system without any choice for you.3.If no auto-cell changer installed cell #1 will disappear in
Fig7Fig 4
D2W
Wait until EasyRTOS booted:Check memory . . . . . . . .Init
Printer . . . . . . . . . . .Init Comm Port . . . . . . . .Start
Kernel . . . . . . . . . .Positioning . . . . . . . . . .Warm up 15
minutes . . .Press ESC to skip …
WL : 656.1nm 16:20:05
Fig 4A
United Products & Instruments Inc.
D2W
Wait until EasyRTOS booted:Check memory . . . . . . . .
WL : 656.1nm RAM Checked: 16kb
-
8
D2W
Wait until EasyRTOS booted:Check memory . . . . . . . .
WL : 656.1nm 16:20:18
Init Printer . . . . . . . . . . .Init Comm Port . . . . . . .
.Start Kernel . . . . . . . . . .Positioning . . . . . . . . .
.System calibrating? No
Warm up 15 minutes. . . .
Fig 5
D2W
Wait until EasyRTOS booted:Check memory . . . . . . . .
United Products & Instruments Inc.
WL : 656.1nm 16:28:03
Init Printer . . . . . . . . . . .Init Comm Port . . . . . . .
.Start Kernel . . . . . . . . . .Positioning . . . . . . . . . .
Init AD Converter . . . . . .Search 656.1nm . . . . . .Check Energy
. . . . . .Fig 6
WL : 656.1nm 16:31: 35
D2WCell #1
123
87
4
56
Basic mode Quantitative WL scan Kinetics
DNA/Protein Multi WL Utility Defined test
United Products & Instruments Inc.
UNICO SPECTROPHOTOMETER
SPECTRO-QUEST
Fig 7
Basic operation Blank
Push the blank cuvette into the lightpath. Press the key
0Abs/100%Tfor blankingNote:1. If the reference solution is too thick, Energy Low will
appear following the Blankingon the screen (Fig 8).If Energy too
Low appears following the Blanking,the test will be paused and
Warning will appear on the screen.(Fig 9).2.If no automatic changer installed cell #1 and Max E will
disappear in Fig8 -
9
WL : 656.1nm Energy Low. . .
BlankingD2WCell #1
Max E
F1:Unit F2:Mode F3: F Factor F4: Standard
Fig 8 NOTE: 1.Blanking is automatic after a wavelength
changeDO NOT OPEN SAMPLE COMPARTMENT LID DURING BLANKING.
2.The dark current dont be taken after power on,if you bypass
the calibrating system. It is recommended to take the dark current
after warm up.See page 38.Warning …D2WCell #1
Max E
F1:Unit F2:Mode F3: F Factor F4: Standard
WL : 656.1nm Energy too Low. . .
Fig 9
Set wavelength (Example: set wavelength in Basic mode)
PressSET(Fig 10).
WL : 656.1nm 12: 35: 27
0.001 AbsD2WCell #1
Max E
F1:Unit F2:Mode F3:F Factor F4:Standard
Fig 10
-
10
Use numeric keypad to input wavelength (Fig 11).
WL : 656.1nm 12: 35: 27
0.001 AbsD2WCell #1
Max E
Please input wl: 450
Fig 11 Press ENTER to change the wavelength from 656.1nm to
450.0nm,and then blank; after blanking, the screen displays as
Fig 12.WL : 450.0nm 12: 35: 27
0.000 AbsD2WCell #1
Max E
F1:Unit F2:Mode F3:F Factor F4:Standard
Fig 12 Load or delete data or curve (Take the WL scan test For
example)Press 3 in Fig.7 go into WL scan.AfterLOADbeing pressed,the
first file (ABC.wav)in memory will appear on the bottom line of
screen .Showed as Fig 13. Press or to browse the files stroed in
memory. Then if : 1. The key.ENTERbe pressed,the file selected will
be loaded anddisplays on the screen.Fig 14. Note(1).The file selected must
match WL scan tests type.if not thefile type error will appear on the right of top line.
(2).Different test has different file type.Refer to table 1 on
page12. 2. The key CLEARbe pressed the file selected will be deleted
byselecting Yes.
-
11
D2WCell #1
WL : 680.0nm %T: 12: 35: 27
200.0 Wavelength (nm) 680.0
From: 200.0To: 680.0Step: 1.0nm
XScaleYScale
F1:Setup F2:Mode F3:Search
0
%
T
1
20.0
Fig 13
D2WCell #1
WL : 680.0nm %T: 12: 35: 27
200.0 Wavelength (nm) 680.0
From: 200.0To: 680.0Step: 1.0nm
XScaleYScale
F1:Setup F2:Mode F3:Search
0
%
T
1
20.0
Fig 14
Table 1 Test File Type
Quantitative Curve ***.fit Quantitative Test Result ***.qua
WL Scan ***.wav Kinetics ***.kin
DNA/Protein ***.dna Multi WL ***.mul
WL Validity ***. wlv Accu. Validity ***.phv
Save data or curve (Example: Save curve in WL scan)
Press the key SAVE in Fig14 to save curve. Name the curve by
pressing the numeric keypad (Fig 15), pressthe keyENTER to comfirm.
. Note(1). Pressing numeric key continually to scroll characters
and pressing , to alter capital letter to miniscule.Table 2 shows
all characters built in.(2) If the name already exists in memory, the warning duplicated
name, are you sure will appear . Yesfor overwrite andNofor
Exit.(3) The length of filename is less than 4.
-
12
D2WCell #1
WL : 680.0nm %T: 12: 35: 27
200.0 Wavelength (nm) 680.0
From: 200.0To: 680.0Step: 1.0nm
XScaleYScale
Please input File Name:2
0
%
T
1
20.0
Fig 15
Table 2 key representing key representing key representing 0
0,+,-,* ,/ 1 1,#,?,:,I 2 2,A,B,C,= 3 3,D,E,F,% 4 4,G,H,I,{ 5
5,J,K,L,} 6 6,M,N,O,~ 7 7,P,Q,R,S, 8 8,T,U,V, 9 9,W,X,Y,Z +/-/.
-,.,Print test report (For example: Print the report in Basic
mode,Fig16) Press the keyPRINTto print the report (curve or data
you have loaded or tested, Fig 17).Fig 16
Fig 17
Before measurement Make a blank reference solution by filling a
clean cuvette (or test tube) halffull with distilled or de-ionized water or other specified
solvent. Wipe the cuvette with tissue to remove the fingerprints
and droplets of liquid.Fit the blank cuvette into the 4-cell linear changer and place
the cuvette in the slot nearest you. For the UNICO UV-2800, push
the changer so thatWL : 546.0nm 12: 35: 27
0.221 AbsD2WCell #1
Max E
F1:Unit F2:Mode F3:F Factor F4:Standard
-
13
the cuvette is in the light path (Push the rod in). Close the
lid. Analyze Sample For different user requirements, we have
provided different test methods. Basic Mode Push the blank cuvette
into the light path. In main menu (Fig7),press1 to enter Basic mode
test . After automatically blanking, it will display as Fig 18
(automatic changer installed) or Fig 19 ( automatic changer
uninstalled) and wait for the operator. ESC/STOPto exit.Note: .If no automatic changer installed cell #1 andMax E will
disappear in Fig18WL : 656.1nm 12: 35: 27
0.000 AbsD2WCell #1
Max E
F1:Unit F2:Mode F3:F Factor F4:Standard
Fig18
WL : 656.1nm 12: 35: 27
0.000 AbsD2W
Max E
F1:Unit F2:Mode F3:F Factor F4:Standard
Fig19 J Test
There are three modes (T%,Abs,conc/factor) for you to select by
pressing F2to make choice.WL : 656.1nm 12: 35: 27
0.104 AbsD2WCell #1
Max E
F1:Unit F2:Mode F3:F Factor F4:Standard
Fig 20
-
14
1. Abs mode Push the blank cuvette into the light path.Press F2
to select Abs mode ,Press 0Abs/100%Tfor Blanking , and then Push
the sample into lightpath to take reading(Fig 20) 2. T% mode The
operation is the same as Abs test mode but pressingF2 to select T%
mode . 3. Conc/Factor modePress F1 to select a concentration unit (Fig 21). If no unit is
suitable for your test, please select the item Other, press enter
and input a new unit by pressing the numeric keypad (Fig 22).WL : 656.1nm 12: 35: 27
D2WCell #1
Max E
Please select unit: %
0.000 mg/ml
F factor 2.000
Fig 21
WL : 656.1nm 12: 35: 27
D2WCell #1
Max E
Please input self defined unit: c
0.000 mg/ml
F factor 2.000
Fig 22
4. Push the blank cuvette into the light path and press
0Abs/100%TforBlanking. There are now two choices for you to take: 4.1
PressF3to input known F value, Fig 23. Then push the sample
intolightpath to take reading of concentration 4.2 Push sample of
known concentration into the lightpathPressF4to input known Conc value, Fig 24. Then push the sample
into lightpath to take reading of concentration. Note:1.You can
select wavelength at any time by pressingSET. After your selection,
instrument always blanks automatically.2.If F value is more than 9999,the out of range will display on
screen. -
15
WL : 656.1nm 12: 35: 27
D2WCell #1
Max E
Please input F factor: 4
0.000 mg/ml
Fig 23
WL : 656.1nm 12: 35: 27
0.000 mg/mlD2WCell #1
Max E
F1:Unit F2:Mode F3:F Factor F4:Standard
F=4.000
Fig 24
J Print Test Report
Press PRINTto print test results (Fig 25).
Fig 25
Quantitative Press2in Main Menu for Quantitative Test (Fig 26).
PressESC/STOPto exit.Note: .If no automatic changer installed cell #1 will disappear
in Fig26. WL : 700.0nm Abs: 12: 35: 27D2WCell #1
Search
F1:Unit F2:Standard Curve
Quantitative TestID Abs Conc. (mg/L)
WL(nm) 700.0
C=1.000*A^1 r=1.000
Scroll
Fig 26
-
16
J How to operation 1. Press F1to select unit of concentration
(Fig 27).WL : 700.0nm Abs: 12: 35: 27
D2WCell #1
Please select unit: g/L
Quantitative TestID Abs Conc. (mg/L)
WL(nm) 700.0
C=1.000*A^1 r=1.000
SearchScroll
Fig 27
2 Press SET to select correction methods and enter the
wavelength. There are three correction methods (single,
Isoabsorbance and 3 point, Fig 28) . Note: Please refer to the
Appendix C for the correction method.WL : 700.0nm Abs: 12: 35: 27
D2WCell #1
Quantitative TestID Abs Conc. (mg/L)
WL(nm) 700.0
C=1.000*A^1 r=1.000
Correction method: Single WL
SearchScroll
Fig 28
3.Press F2in Fig 26 for more items to select .See Fig 29.
WL : 700.0nm Abs: 12: 35: 27
D2WCell #1
Calibration tableNo Conc. (mg/L) Abs
WL(nm) 700.0
C=1.000*A^1 r=1.000
F1:Method F2: Params F3: Standard F4: Curve
Fig 29 3.1 Press F1in Fig 29 to select fitting method. There are
4 methods foryou to choose: Linear fit, linear fit through zero, square fit
and cubic fit. 3.2 Press F2in Fig 29 to enter directly a known
standard curve.Fig29A. -
17
WL : 700.0nm Abs: 12: 35: 27
D2WCell #1
Calibration tableNo Conc. (mg/L) Abs
WL(nm) 700.0
C=1.000*A^1 r=1.000
Input K1=1.033
Fig 29A The constants to be entered are depending on which
fitting method selected.The table below lists the their
relation:Fitting Method Fitting Equation constants linear fit through
zero C=K1A K1, r* Linear fit C=K0+K1A K0,K1,r* square fit
C=K0+K1A+K2A2 K0,K1,K2 cubic fit C=K0+K1A+K2A2+K3A3 K0,K1,K2,K3* r : regression co-efficients, default=1 3.3 Press F3in Fig 29
to establish a standard curve by measuring agroup of standard samples. See Fig 30.
3.3.1 Enter standard concentrations of samples by pressing the
Numeric keypad followed byENTER. Press or to modify the inputted
data Fig31. PressESC/STOPto finish inputting and to exit Fig
32.WL : 700.0nm Abs: 12: 35: 27
D2WCell #1
Setup Standard Conc.
C=1.000*A^1 r=1.000
Edit the number . . .
No Conc. (mg/L) Abs 1 0.000 2 -more-
WL(nm) 700.0
Fig 30
WL : 700.0nm Abs: 12: 35: 27
D2WCell #1
Setup Standard Conc.
C=1.000*A^1 r=1.000
Input Standard Conc: 3
No Conc. (mg/L) Abs 1 2.000 2 3.000 3 -more-
WL(nm) 700.0
Fig 31
-
18
3.3.2 Push the blank cuvette into the light path,
press0Abs/%100T,the instrument will step to the wavelength and
blank. See Fig 32.D2WCell #1
F1:Method F2:Params F3:Standard F4:Curve
Calibration table
C=1.000*A^1 r=1.000
No Conc. (mg/L) Abs 1 2.000 2 3.000 3 4.000 4 5.000 5 6.000
WL : 700.0nm Abs: Blank ..
WL(nm) 700.0
Fig 32
3.3.3 Pull the first sample cuvette of known concentration into
the light path, Press the keySTARTto get values of standard curve
one by one (Fig 33).Note:If auto-cell changer is installed,the vary samples are
measured by pressingCELLfollowing numbers(1-8)and pressingENTERto comfirm. 3.3.4 PressF4to draw the curve. You
can get a different curve bypressingF1 to select a different fitting method. See Fig
34-Fig37.For linear fits, r represent fitting coefficient of linear
regression .r=1 is best fitting.usually r is very close to 1.Note:If there are few standard samples,it is not suitable for
selecting square fitting,especially cubic fitting,otherwise invalid
fitting result will be obtained.D2WCell #1
F1:Method F2:Params F3:Standard F4:Curve
Calibration table
C=1.000*A^1 r=1.000
No Conc. (mg/L) Abs 1 2.000 0.247 2 3.000 0.375 3 4.000 0.532 4
5.000 0.603 5 6.000 0.764WL : 656.1nm Abs: 12: 35: 27
WL(nm) 700.0
Fig 33
D2WCell #1
Press (ESC) to return . . .
WL : 656.1nm Abs: 12: 35: 27
-1.0 Abs 4.0
0
C
onc.
7
6
Fig 34 linear through zero fit
-
19
D2WCell #1
Press (ESC) to return . . .
WL : 656.1nm Abs: 12: 35: 27
-1.0 Abs 4.0
0
C
onc.
7
6
Fig 35 square fit
D2WCell #1
Press (ESC) to return . . .
WL : 656.1nm Abs: 12: 35: 27
-1.0 Abs 4.0
0
C
onc.
91
438
Fig 36 cubic fit
D2WCell #1
Press (ESC) to return . . .
WL : 656.1nm Abs: 12: 35: 27
-1.0 Abs 4.0
0
C
onc.
7
6
Fig 37 linear fit
3.3.5 Press SAVE to save calibration if required 3.3.6
PressESC/STOPto exit 4.Quantitative TestBefore test,the standard curve must be obtained.There are three
ways for you to obtained it (a, b or c).a) Standard curve built up and saved in the instrument.
In Fig 33 pressLoad and then pressor to select the file with
type ***.fit. At last pressENTERTO comfirm.b) Known standard curve, which is not saved in the instrument.
See 3.2. For Fig 29 enter a known standard curve directly.c) Use the standard samples for the test. First the standard
curve must be established using the method shown in 3.3. Note: All
sample results must be taken in screen Fig26. -
20
4.1 Push the blank cuvette into the light path and press
0Abs/100%Tfor blanking.4.2 Pull the sample cuvette into the light path, press the
keySTART, the results will be displayed on the screen (Fig 38).WL : 700.0nm Abs: 12: 35: 27
D2WCell #1
F1:Unit F2:Standard Curve
Quantitative Test
WL(nm) 700.0
C=1.000*A^1 r=1.000
SearchScroll
ID Abs Conc. (mg/L) 1 0.062 0.062 2 0.061 0.061 3 0.062 0.0614
0.061 0.061Fig 38
4.3 If there is more than one sample, repeat step 4.2 for the
next sample 4.4 Press (SAVE) to save the results and fitting
parametersJ Print Test Report Press the keyPRINTto print the test report
(Fig 39).Fig 40
WL Scan Press3in main menu for WL Scan test (Fig 41). ESC/STOPto
exit. To load a previous curve, p ressLOADand select a previously
stored curve (.wav) -
21
D2WCell #1
WL : 656.1nm Abs: 12: 35: 27
200.0 Wavelength (nm) 680.0
From: 200.0To: 680.0Step: 1.0nm
F1:Setup F2:Mode F3:Search
0
%
T
1
20.0
XScaleYScale
Fig 41
J Scan sample
1. Press F1 to setup, input the start wavelength, and end
wavelength by pressing the numeric keypad (Fig 42). Note: The
UV-2800 scans from high to low wavelength. Browse and select the
items of scan step and scan speed by pressing or.D2WCell #1
WL : 656.1nm Abs: 12: 35: 27
200.0 Wavelength (nm) 680.0
From: 200.0To: 680.0Step: 1.0nm
Scan from: 680
0
%T
120
.0
XScaleYScale
Fig 42
Note: Scan step allows the selection of 0.1nm, 0.2nm ,0.5nm,1nm
,2nm and 5nm. Scan speed allows the selection of HI, MEDIUM and
LOW. For survey scan we suggest 5nm, HI. For detailed scan we
suggest 0.5nm, HI2. Press F2to select the test mode, Abs , %T or E (Fig 43).
D2WCell #1
WL : 656.1nm Abs: 12: 35: 27
200.0 Wavelength (nm) 680.0
0
%
T
1
20.0
From: 200.0To: 680.0Step: 1.0nm
Please select mode: Abs
XScaleYScale
Fig 43
3. Push the blank cuvette into the light path, press 0Abs/100%T
to scan the base line (Fig 44). Press the key ESC/STOPto stop -
22
scanning;
D2WCell #1
200.0 Wavelength (nm) 680.0
From: 200.0To: 680.0Step: 1.0nm
Press (ESC) to stop . . .
WL : 520.0nm Scan to 200.0nm
0
%
T
1
20.0
XScaleYScale
Fig 44
4. Pull the sample cuvette into the light path, press STARTto
scan thesample(Fig 45) ESC/STOP to stop scanning. When scan has finished
the beeper beeps 3 times (Fig 46).D2WCell #1
200.0 Wavelength (nm) 680.0
From: 200.0To: 680.0Step: 1.0nm
XScaleYScale
Press (ESC) to stop . . .
WL : 417.0nm %T: 36.73 Scan to 200.0nm
0
%
T
1
20.0
Fig 45
D2WCell #1
WL : 680.0nm %T: 12: 35: 27
200.0 Wavelength (nm) 680.0
From: 200.0To: 680.0Step: 1.0nm
XScaleYScale
F1:Setup F2:Mode F3:Search
0
%
T
1
20.0
Fig 46
5 If you want to change the scale, p ress or to change x scale
(Fig 47), input upper limit and lower limit by pressing the numeric
keypad . To change y scale press or.After these inputs the instrument will redraw the curve (Fig
48). -
23
D2WCell #1
WL : 680.0nm %T: 12: 35: 27
200.0 Wavelength (nm) 680.0
From: 200.0To: 680.0Step: 1.0nm
XScaleYScale
Min X:300
0
%
T
1
20.0
Fig47
D2WCell #1
WL : 680.0nm %T: 12: 35: 27
300.0 Wavelength (nm) 500.0
From: 200.0To: 680.0Step: 1.0nm
XScaleYScale
F1:Setup F2:Mode F3:Search
0
%
T
1
00.0
Fig 48
6 Press F3 to search the Abs/%T value of the scan. There are
twoways for you to search (Fig 49).
D2WCell #1
WL : 680.0nm %T: 12: 35: 27
200.0 Wavelength (nm) 680.0
From: 200.0To: 680.0Step: 1.0nm
PointPeak
F1:Set Peak Height
0
%
T
1
20.0
Fig 49
a) Peak to peak, press F1 to set peak height and input value
bypressing the numeric keypad (Fig 50). Press to search the peak
from left to right and pressto search from right to left. The value
of every peak found will be displayed on the screen one at a time
(Fig 51). -
24
D2WCell #1
WL : 680.0nm %T: 12: 35: 27
200.0 Wavelength (nm) 680.0
From: 200.0To: 680.0Step: 1.0nm
Please input peak height: 0.100
0
%
T
1
20.0
PointPeak
Fig 50
D2WCell #1
WL : 452.0nm %T:22.38 12: 35: 27
200.0 Wavelength (nm) 680.0
From: 200.0To: 680.0Step: 1.0nm
F1:Set peak Height
0
%
T
1
20.0
PointPeak
Fig 51
b) Point to point, Press to search the point from left to right
andpress ) to search from right to left. The search step interval
is the same as the scan step. The value of every point searched
will be displayed on the screen.J Save Curve Press SAVEto save the curve. Note: Load/Save
requires the first scan display page Fig. 48. Press ESC if in
Search to return to the required page J Print Test Report Press
PRINTto print the curve you have loaded or scanned (Fig 52). Note:
The report always is printed in Fig 46 -
25
Fig 52
Kinetics
Press4in main menu for Kinetics (Fig 53). ESC/STOPto exit. To
load a previous kinetics result, press (LOAD) and select a
previously stored result (.kin) -
26
D2WCell #1
Tim : 60s Abs: 12: 35: 27
0 Time(s) 180
Total T 180s Inteval 1.0s
0
Abs
3.
000
XScaleYScale
F1:Setup F2:Mode F3:Process F4:Search
Fig 53 J Test
1. Press F1 to set Total Time, Delay Time, Time interval, and
input the value by pressing the numeric keypad (Fig 54).D2WCell #1
Tim : 60s Abs: 12: 35: 27
0 Time(s) 180
Total T 180s Inteval 1.0s
0
Abs
3.
000
XScaleYScale
Total Time:180
Fig 54 2. Select the test mode (Abs or %T) by pressingF2(Fig
55).D2WCell #1
Tim : 60s Abs: 12: 35: 27
0 Time(s) 180
Total T 180s Inteval 1.0s
0
Abs
3.
000
XScaleYScale
Please select mode:Abs
Fig 55 3. Set wavelength by pressingSET .Pull the blank cuvette
into thelight path, press 0Abs/100%Tfor blanking 4. Pull the sample
cuvette into the light path, pressSTART to scan thesample. After the delay time, the beeper beeps 3 times and time
-scan starts. At the end of the time-scan, the beeper also beeps 3
times (Fig 56); -
27
D2WCell #1
Tim : 180s Abs: 12: 35: 27
0 Time(s) 180
Total T 180s Inteval 1.0s
0
Abs
1.
000
XScaleYScale
F1:Setup F2:Mode F3:Process F4:Search
Fig 56
5. Press F3to process the data, and enter Begin Time, End Time
and Factor (Fig 57) and the value in I.U. will be calculated and
displayed (Fig 58). The average straight line between the Begin
Time and End Time will be calculated. The gradient of this line
gives the rate of change of ?A/min. Note: I.U.=FactorA/minD2WCell #1
Tim : 60s Abs: 12: 35: 27
0 Time(s) 180
Total T 180s Inteval 1.0s
0
Abs
3.
000
XScaleYScale
Begin Time:0
Fig 57
D2WCell #1
Tim : 180s Abs: 12: 35: 27
0 Time(s) 180
Total T 180s Inteval 1.0sI.U.= +0.364
0
Abs
1.
000
XScaleYScale
F1:Setup F2:Mode F3:Process F4:Search
Fig 58
6. If you want to change the scale, please refer to step 5 of WL
scan. 7. PressF4to search the Abs/%T value in relation to the time
axis.Search point to point by pressing the keyor. Please refer to
step 6 of WL scan. -
28
J Save Curve Press the key SAVE to save curve. Note: Load/Save
requires the first kinetics display page Fig. 56. Press ESC if in
Search to return to the required page. J Print Test Report Press
the keyPRINTto print the curve you have loaded or scanned (Fig
59).Fig 59 DNA/Protein Press5in main menu for DNA/Protein (Fig 60).
ESC/STOPto exit. Note:The algorithm of the test refer to Appendix A
please. -
29
D2WCell #1
F1:Coeff F2:Mode F3:Unit F4:Default
DNA/Protein measurementNo Items Result Unit
WL : 900.0nm 12: 35: 27
WL(nm) 260.0 280.0 320.0
SearchScroll
Fig 60
To load previous DNA results, press (LOAD) and select a
previously stored result (.dna) J Test1. To use a simpler or different algorithm, you can enter your
own values for f1-f4. PressF1to set f1-f4. Input the value by
pressing the numeric keypad (Fig 61).D2WCell #1
Input f1=62.90
DNA/Protein measurementNo Items Result Unit
WL : 900.0nm 12: 35: 27
WL(nm) 260.0 280.0 320.0
SearchScroll
Fig 61
2. PressF2to select test mode. Absorbance difference 1 is
fortesting at the wavelength 260nm,280nm and 320nm (optional),and
the Absorbance difference 2 is for testing at the wavelength
260nm,280nm and 320nm (optional,Fig 62). Then select with/without
reference. If selected with reference (no), the A ref. will be 0
(Fig 63).D2WCell #1
Measument: Absorbance difference 1
DNA/Protein measurementNo Items Result Unit
WL : 900.0nm 12: 35: 27
WL(nm) 260.0 280.0
SearchScroll
Fig 62
-
30
D2WCell #1
With reference: Yes
DNA/Protein measurementNo Items Result Unit
WL : 900.0nm 12: 35: 27
WL(nm) 260.0 280.0
SearchScroll
Fig 63
3. Press F3to select the unit of concentration (Fig 64).
D2WCell #1
Please select unit: mg/mL
DNA/Protein measurementNo Items Result Unit
WL : 900.0nm 12: 35: 27
WL(nm) 260.0 280.0
SearchScroll
Fig 64
4. Push the blank cuvette into the light path, then press
0Abs/100%Tfor blanking .
5. Pull the sample cuvette into the light path, press START to
test the sample. The test result will be displayed on the screen
(Fig 65).D2WCell #1
F1:Coeff F2:Mode F3:Unit F4:Default
DNA/Protein measurementNo Items Result Unit 1 A1 2.947 Abs A2
2.842 Abs Aref 0.638 AbsC-DNA 65.91 mg/mL C-Pro 1672 mg/mL Ratio 1.048
WL : 900.0nm Abs: 12: 35: 27
WL(nm) 260.0 280.0 320.0
SearchScroll
Fig 65
6. If there is more than one sample, repeat step 5 for the next
sample.7. Press the key )orfor searching. Input the sample number
(Fig 66), the result will be displayed on the screen. Press the
key orto browse the test results one by one. -
31
D2WCell #1
DNA/Protein measurementNo Items Result Unit 1 A1 2.947 Abs A2
2.842 Abs Aref 0.638 AbsC-DNA 65.91 mg/mL C-Pro 1672 mg/mL Ratio 1.048
WL : 900.0nm Abs: 12: 35: 27
WL(nm) 260.0 280.0 320.0
SearchScroll
Search sample:3
Fig 66 J Recall the default Press the keyF4to recall the default
of the f1-f4. J Save Data Press the key SAVE to save data. J Print
Test Report Press the keyPRINTto print the test result (Fig
67).Fig 67
Multi Wavelength Press6in main menu for Multi WL (Fig 68).
ESC/STOPto exit.D2WCell #1
F1:WL setup F2:Mode
Multi Wavelength TestNo WL(nm) Abs
500.0
WL : 900.0nm Abs: 12: 35: 27
1 WL
SearchScroll
Fig 68
To load previous Multi Wavelength results, press (LOAD) and
select previously stored results (.mul) -
32
J Test 1. Press F1to setup a group of wavelengths for testing by
pressing thenumeric keypad followed byENTER. ( ) or (` ) to modify the
inputted data Fig. 69. PressESC/STOPto finish setup and exit. Note:
It is recommended to enter the highest wavelength first.D2WCell #1
Multi Wavelength TestWL : 900.0nm Abs: 12: 35: 27
2 WL
SearchScroll
Please input wl:500
No WL(nm) Abs500.0400.0546.0
Fig 69
2. Press F2to select mode (Fig 70).
D2WCell #1
Multi Wavelength TestWL : 900.0nm Abs: 12: 35: 27
3 WL
SearchScroll
No WL(nm) Abs500.0400.0300.0
Please select mode: Abs
Fig70
3. Push the blank cuvette into the light path, then press
0Abs/100%Tfor Blanking .4. Pull the sample cuvette into the light path, pressSTART to
test.The test results will be displayed on the screen (Fig 71).
-
33
D2WCell #1
F1:WL setup F2:Mode
Multi Wavelength TestNo WL(nm) Abs 1 500.0 0.87
400.0 0.42300.0 0.81
WL : 500.0nm Abs: 12: 35: 27
3 WL
SearchScroll
Fig 71
5. If there is more than one sample, repeat step 4 for the next
sample.Note: When the test has finished, the wavelength will go to the
first WL.6. Press )orfor searching. Input the sample number, the
resultwill be displayed on the screen. Press or to browse the test
results one by one.J Save Data Press SAVE to save data. J Print Test Report
PressPRINTto print the test results (Fig 72).Fig 72
Setting and Calibration Utility Press7in Main menu for Utility
(Fig 73). ESC/STOPto exit. -
34
WL : 656.1nm 08: 04: 35
UNICO SPECTROPHOTOMETER
SPECTRO-QUEST
D2WCell #1
123
98
4
67
WL Reset Printer Lamp Clock
Accu Validity WL Validity Connect to PC Beeper on/off
United Products & Instruments INC.
5 Dark current
F1 Delete entire saved filesF2 Restore default
Fig 73
J WL Reset Press1to reset wavelength (Fig74).
UNICO SPECTROPHOTOMETER
SPECTRO-QUEST
D2WCell #1
123
98
4
67
WL Reset Printer Lamp Clock
Accu Vaidity WL Vaidity Connect to PC Beeper on/off
United Products & Instruments INC.
5 Dark current
F1 Delete entire saved filesF2 Restore default
WL : 482.0nm Step to 900.0nm . . .
Fig 74
J Printer Press2to set printer (Fig 75). ESC/STOPto exit.
WL : 656.1nm 08: 04: 35
UNICO SPECTROPHOTOMETER
SPECTRO-QUEST
D2WCell #1
1234
Reset printer Select print port Select printer Print report
United Products & Instruments INC.
Fig 75 1. Press1in Fig 75 to Reset Printer. 2. Press2in Fig 75
to select print port (LPT or Comm., Fig 76). -
35
WL : 656.1nm 08: 04: 35
UNICO SPECTROPHOTOMETER
SPECTRO-QUEST
D2WCell #1
1234
Reset printer Select print port Select printer Print report
Select the print port: LPT
Fig 76 3. Press3 in Fig 75 to select printer (HP PCL (1 colour
cartridge), PCL(black mode), Epson ESC/P or Epson/P2 or above, Fig77).
WL : 656.1nm 08: 04: 35
UNICO SPECTROPHOTOMETER
SPECTRO-QUEST
D2WCell #1
1234
Reset printer Select print port Select printer Print report
Printer : HP PCL (1 color cartridge)
Fig 77 4. Press4in Fig 75 to select print mode. If you select
Print screen mode,a little icon will be displayed on the top line of the screen
(Fig 78), if you select Print report mode, the little icon will
disappear.WL : 656.1nm 08: 04: 35
UNICO SPECTROPHOTOMETER
SPECTRO-QUEST
D2WCell #1
1234
Reset printer Select print port Select printer Print screen
United Products & Instruments INC.
Fig78 J Lamp Press3to set lamp (Fig 79). ESC/STOPto exit.
-
36
WL : 656.1nm 08: 04: 35
UNICO SPECTROPHOTOMETER
SPECTRO-QUEST
D2WCell #1
1234
Reset D2 lamp usage time Switch W:
United Products & Instruments INC.
Reset W lamp usage time5 Switch point
Switch D2: ON
ON
Fig 79
1. Press1in Fig 79 to switch on/off D2. Fig 80.
WL : 656.1nm 08: 04: 35
UNICO SPECTROPHOTOMETER
SPECTRO-QUEST
D2WCell #1
1234
Reset D2 lamp usage time Switch W:
United Products & Instruments INC.
Reset W lamp usage time5 Switch point
Switch D2: OFF
OFF
Fig 80
2. Press2in Fig 79 to reset usage time of D2(Fig 81). Press
orto select Yes or No, and then press ENTER.
WL : 656.1nm 08: 04: 35
UNICO SPECTROPHOTOMETER
SPECTRO-QUEST
D2WCell #1
1234
Switch D2: Reset D2 lamp usage time Switch W:
5 hrs used.Are you sure?
Reset W lamp usage time5 Switch point
ON
ON
NO
Fig 81
3. Press3in Fig 79 to switch on/off W. The indication is also on
the topright corner of the screen (Fig 82).
-
37
WL : 656.1nm 08: 04: 35
UNICO SPECTROPHOTOMETER
SPECTRO-QUEST
D2WCell #1
1234
Reset D2 lamp usage time Switch W:
United Products & Instruments INC.
Reset W lamp usage time5 Switch point
Switch D2: ON
OFF
Fig 82
4. Press 4in Fig 79 to reset usage of W (Fig 83). Press or
to select Yes or No, and then press ENTER.
WL : 656.1nm 08: 04: 35
UNICO SPECTROPHOTOMETER
SPECTRO-QUEST
D2WCell #1
1234
Switch D2: Reset D2 lamp usage time Switch W:
5 hrs used.Are you sure?
Reset W lamp usage time5 Switch point
ON
ON
NO
Fig 83
5. Press5 in Fig 79 to set the switch usage point of D2 and W
lamp (Fig84).
WL : 656.1nm 08: 04: 35
UNICO SPECTROPHOTOMETER
SPECTRO-QUEST1234
Switch on/off D2 Reset D2 lamp usage time Switch on/off W
Input the D2/W switch point:340.0
Reset W lamp usage time5 Switch point
D2WCell #1
84
J Clock Press 4In Fig73 to set the display mode and modify the
clock (Fig 85). ESC/STOPto exit. -
38
WL : 656.1nm 08: 04: 35
UNICO SPECTROPHOTOMETER
SPECTRO-QUEST1234
Set Time Set Date Show Time mode
United Products & Instruments INC.
Show Date mode
D2WCell #1
Fig 85
1. Press 1in Fig 85 to modify time by pressing the numeric
keypad (Fig86).
WL : 656.1nm 08: 04: 35
UNICO SPECTROPHOTOMETER
SPECTRO-QUEST1234
Set Time Set Date Show Time mode
Please input the time:08.04.35
Show Date mode
D2WCell #1
Fig 86
2. Press 2in Fig 85 to modify date by pressing the numeric
keypad. 3. Press3in Fig 85 to set the date display on the top right
corner of thescreen. 4. Press4in Fig 85 to set the time display on the top
right corner of thescreen (Fig 87).
WL : 656.1nm 08: 04: 35
UNICO SPECTROPHOTOMETER
SPECTRO-QUEST1234
Set Time Set Date Show Time mode
United Products & Instruments INC.
Show Date mode
D2WCell #1
Fig 87
J Dark Current Press 5In Fig73 to get dark current (Fig 88).
-
39
SPECTRO-QUEST
D2WCell #1
123
98
4
67
WL Reset Printer Lamp Clock
Accu Validity WL Validity Connect to PC Beeper on/off
United Products & Instruments INC.
5 Dark current
F1 Delete entire saved filesF2 Restore default
WL : 656.1nm Get dark current
UNICO SPECTROPHOTOMETER
Fig 88
J Accu Validity Press 4In Fig73 to do accu validity (Fig 89).
ESC/STOPto exit.D2WCell #1
Photometric Validity TestNo WL(nm) Abs(Std) Abs Result
WL : 900.0nm Abs: 12: 35: 27
F1: Standard F2: Mode F3: Tolerance
Fig 89 1. Press SET to set the wavelength. Press ENTERto edit
andinput wavelength by pressing the numeric keypad (Fig 90).
ESC/STOPto finish inputting and exit.D2WCell #1
Photometric Validity TestWL : 900.0nm Abs: 12: 35: 27
Please input wl:546
No WL(nm) Abs(Std) Abs Result 1 440.0
2 546.0 3 -more-
Fig 90
2. PressF1to set the standard value, Press ENTERto edit and
inputby pressing the numeric keypad (Fig 91). ESC/STOPto finish
inputting and exit. -
40
D2WCell #1
Photometric Validity TestWL : 900.0nm %T: 12: 35: 27
Input the standard:0
No WL(nm) %T(Std) %T Result 1 440.0 9.28 2 546.0 0.000 3 635.0
0.000Select
Fig 91
3. Press F2to select test mode (Abs or %T, Fig 92).
D2WCell #1
Photometric Validity TestWL : 900.0nm %T: 12: 35: 27
No WL(nm) %T(Std) %T Result 1 440.0 9.28 2 546.0 8.45 3 635.0
5.66Please select mode: %T
Fig 92 4. Press F3to set tolerance (Fig 93).Input the value by
pressing thenumeric keypad.
D2WCell #1
Photometric Validity TestWL : 900.0nm %T: 12: 35: 27
No WL(nm) %T(Std) %T Result 1 500.0 9.28 2 600.0 8.45 3 700.0
5.66Input tolerance:0.005
Fig 93
5. Press0Abs/100%Tfor Blanking. 6. Put the sample (calibrated
neutral density filter) into the light path. PressSTARTto check. The results will be displayed on the screen (Fig
94). If the discrepancy between the results and the calibrated
standards is not more than the tolerance, pass will be displayed
after the test result. Otherwise, fail will be displayed.7. The result can be saved,loaded and printed by pressingSAVE,
LOADand PRINT. -
41
D2WCell #1
Photometric Validity TestWL : 900.0nm %T: 12: 35: 27
No WL(nm) %T(Std) %T Result 1 500.0 9.28 9.28 pass 2 600.0 8.45
8.45 pass 3 700.0 5.66F1: Standard F2: Mode F3: Tolerance
Fig 94 J WL Validity Press7in Fig 73 to WL validity (Fig 95).
ESC/STOPto exit.D2WCell #1
Wavelength Validity TestWL : 900.0nm Abs: 12: 35: 27
No WL(nm) Peak(nm) T% Result
F1: Set peaks F2: Mode F3: Tolerance
Fig 95
1. Press F1to set the standard peak. Press ENTERto edit and
input wavelength by pressing the numeric keypad (Fig96). ESC/STOPto
finish inputting and exit.D2WCell #1
Wavelength Validity TestWL : 900.0nm %T: 12: 35: 27
Input the standard:0
No WL(nm) Peak(nm) %T Result 1 241.4 2 361.0 3 417.0 4 537.6 5
641.4 6 807.4Select
Fig 96
2. Press F2to select test mode (Abs or %T, Fig 97).
-
42
D2WCell #1
WL : 900.0nm %T: 12: 35: 27
Please select mode: %T
Wavelength Validity TestNo WL(nm) Peak(nm) %T Result 1 241.4 2
361.0 3 417.0 4 537.6 5 641.4 6 807.4Fig 97
3. Press F3 to set tolerance (Fig 98). Input the value by
pressing thenumeric keypad.
D2WCell #1
Wavelength Validity TestWL : 900.0nm %T: 12: 35: 27
Input tolerance:0.8
No WL(nm) Peak(nm) %T Result 1 241.4 2 361.0 3 417.0 4 537.6 5
641.4 6 807.4Select
Fig 98
4. Press 0Abs/100%Tfor blanking.
5. Put the sample (calibrated holmium liquid) into the light
path. Press START to check. The results will be displayed on the
screen (Fig 99). If the discrepancy between the results and the
calibrated values is not more than the tolerance, pass will be
displayed after the test results. Otherwise, fail will be
displayed.D2WCell #1
WL : 900.0nm %T: 12: 35: 27
F1: Standard F2: Mode F3: Tolerance
Wavelength Validity TestNo WL(nm) Peak(nm) %T Result 1 241.4
239.7 40.06 pass 2 361.0 360.4 42.82 pass 3 417.0 416.9 37.63 pass
4 537.6 537.2 16.50 pass 5 641.4 641.3 24.33 pass 6 807.4 807.7
92.38 passFig 99
6.The result can be saved,loaded and printed by
pressingSAVE,LOADand PRINTJ Connect to PC Press8in Fig 73 to connect to PC (Fig 100), if
the instrument is on-line with -
43
the PC.The screen displays as Fig 100A. PressESC/STOPto
exit.WL : 656.1nm 08: 04: 35
UNICO SPECTROPHOTOMETER
SPECTRO-QUEST
United Products & Instruments INC.
D2W
Connecting to computer. . .
Fig 100
WL : 656.1nm 08: 04: 35
UNICO SPECTROPHOTOMETER
United Products & Instruments INC.
D2W
Controlled by PC . . .
SPECTRO-QUEST
Fig 100A
J Beeper on/off Press9in Fig 73 to turn on/off the beeper J
Delete entire saved files PressF1in Fig 73 to delete entire saved
files. After the delete the files, double confirm need to do. J
Restore default PressF2in Fig 73 to restore the default parameters.
Defined test ( auto-cell changer required) Press8in main menu for
defined test (Fig 101). ESC/STOPto exit.D2WCell #1
F1: Methord F2:Mode
1 Ref, 1 SampleNo. Abs1
WL : 900.0nm 12: 35: 27
0.000 Abs
Fig 101
-
44
1. Press F1 to setup method (Fig 102). There are 8 items (1 ref.
1 sample, 1 ref. 2 samples, 1 ref. 3 samples, 1 ref. 4 samples, 1
ref. 5 samples, 1 ref. 6 samples, 1 ref. 7 samples, N refs. N
samples) for selecting. We take 1 ref. 4 samples for example,Fig
102D2WCell #1
Select define test: 1 Ref.,4 samples
1 Ref, 4 SamplesNo. Abs1234
WL : 900.0nm 12: 35: 27
0.000 Abs
Fig 102
2. Press F2to select test mode (Abs or %T, Fig 103).
D2W
Please select mode: Abs
4 Ref, 4 SampleNo. Abs1234
WL : 900.0nm 12: 35: 27
0.000 Abs
Fig 103
3. Put the reference into cell NO.1 and 4 samples into cell NO.2
-NO.5.Setwavelength. 4. Press START.Automatically the reference is taken
in cell NO.1,the 4samples are taken in cell NO.2-NO.5. The results are displayed
as Fig 104.D2WCell #1
1 Ref, 1 SampleNo. Abs1 0.2272 0.2893 0.3384 1.106
0.000 Abs
F1: Methord F2:Mode
WL : 900.0nm 12: 35: 27
Fig 104
5. Select N refs. N samples,Take 8 refs. 8 samples for example.
6. After setup wavelength and mode(%T or Abs),put 8 references into
CELLNO.1-NO.8.
-
45
7. PressSTART,the screen display as Fig105,thePlace 1st group
appear on the right of top line, Press0Abs/100%T, the 8 references
are taken automatically and the screen change to Fig 106.D2WCell #1
1 Ref, 1 SampleNo. Abs12345678
0.000 Abs
F1: Methord F2:Mode
WL : 900.0nm Place 1st group . .
Fig 105
D2WCell #1
1 Ref, 1 SampleNo. Abs12345678
0.000 Abs
F1: Methord F2:Mode
WL : 900.0nm Place 2nd group . .
Fig 106
8. Remove 8 references and put 8 samples into CELL
NO.1-NO.8,Press the START,the results are taken automatically . Fig
107.D2WCell #1
1 Ref, 1 SampleNo. Abs1 0.1272 0.1893 0.2384 0.8065 1.4426
1.5677 1.6698 1.7410.000 Abs
F1: Methord F2:Mode
WL : 900.0nm 12: 45: 57
Fig 107
-
46
Appendix A
DNA/Protein Test Algorithm Test Name Method Wavelength(s)
Calculations Parameters DisplayedUnits DNA MEASUREMENT
Absorbance difference (260,280)
A1=A260nm A2=A280nm Aref=A320nm (optional)
DNA concentration: (A1-Aref)f1-(A2-Aref)f2 Protein concentration
(A2-Aref)f3-(A1-Aref)f4f1=62.9 f2=36.0 f3=1552 f4=757.3
Absorbance difference (260,230)
A1=A260nm A2=A230nm Aref=A320nm (optional)
DNA concentration: (A1-Aref)f1-(A2-Aref)f2 Protein concentration
(A2-Aref)f3-(A1-Aref)f4f1=49.1 f2=3.48 f3=183 f4=75.8
DNA: g/ml Protein:g/ml
DNA/Protein Concentration and DNA purity
Absorbance ratio
A1=A260nm A2=A280nm or A230nm Aref=A320nm (optional)
Ratio= A1-Aref
A2-Aref
None No units(ratio)
-
47
Appendix B Lamp Replacement A. TO REPLACE DEUTERIUM LAMP 1. Turn
off and unplug the instrument (VERY IMPORTANT: HIGHVOLTAGE). 2. Remove the cuvette holder rod by unscrewing the
rodcounterclockwise. 3. Remove the all screws around the sides of
the spectrophotometer.See Fig A1
Fig A1 4. Very carefully remove the cover of the instrument and
place in rightside of the instrument. Fig A2
-
48
Fig A2 HINT: If it is necessary to remove the cover from the
right side of the instrument, carefully remove 3 connectors (CZ6,
CZ4 and J3)on PCB marked SST8.417.100 . Be sure to reconnect after
replacing the lamp! Fig A3CZ6 Fig A3
5. Remove the grey metal protection cover. Using screwdrivers
remove the two top screws and the two bottom screws, and thenJ3
CZ4
-
49
place the protective cover to the side. See Fig A4
Fig A4
6. Disconnecting the connector J7 on the PCB marked
SST8.411.128. Unscrew the screw that holds the lamp bracket to the
instrument base. Pull the entire lamp and lamp holder assembly out.
See Fig A5 -
50
J7
Fig A5 7. Replace the pre-aligned lamp with a lamp (Fig A6)
provided byUNICOor an authorized UNICOService Provider . This comes
pre-assembled with lamp socket.Fig A6 CAUTION: THE LAMP MAY BE HOT! TAKE PRECAUTIONS TO PREVENT
POSSIBLE BURNS.8. Reconnect the connector J7 to the PCB marked
SST8.411.128. -
51
9. Re-fit the grey metal protection cover, Fig. A4. Temporarily
re-fit the main cover and fix with two screws, one each side.
Switch on and remove the grommet from the middle of the rear panel.
You can now look through the hole and view the image of the lamp on
the slit. Check the lamp alignment Fig. A7. If the image is not
covering the slit, the lamp alignment needs adjustment. This
requires running the UV-2800 without the covers, with high voltages
accessible, and so should only be performed by a suitably qualified
engineer. If adjustment is required, remove the cover and grey
protection cover, put on UV protection glasses and turn on the
instrument. Adjust to make the image central on the slit, Fig. A7.
Install the grey metal protection cover and cover of
instrument.Fig A7
CAUTION: Wear UV protection glasses when replacing deuterium
lamp. 10. Re-fit all the screws around the sides of the
spectrophotometer, Fig. A1. 11. Re-set the lamp usage time. Select
Utility, lamp, and re-set D2 usagetime.
Focus on the slit
-
52
B. TO REPLACE TUNGSTEN-HALOGEN LAMP 1. The step 1- step 5 are
the same as the REPLACING DEUTERIUM. 2. Remove the lamp from the
ceramic base. 3. Insert the new lamp (Fig A8), pushing it in as far
as it will go. 4. Re-fit the grey metal protection cover, Fig. A4.
Temporarily re-fit themain cover and fix with two screws, one each side. Switch on and
remove the grommet from the middle of the rear panel. You can now
look through the hole and view the image of the lamp on the slit.
Check the lamp alignment Fig. A9. If the image is not covering the
slit, the lamp alignment needs adjustment. This requires running
the UV-2800 without the covers, with high voltages accessible, and
so should only be performed by a suitably qualified engineer. If
adjustment is required, remove the cover and grey protection cover
and turn on the instrument. Adjust to make the image central on the
slit, Fig. A9. Install the grey metal protection cover and
instrument cover.Fig A8
-
53
Fig A9 CAUTION: DO NOT HANDLE THE LAMP WITH BARE FINGERS. USE
TISSUE OR CLOTH WHEN HANDLING LAMP. The oil from your fingers can
cause the lamp to burn out prematurely. 5. Re-fit all the screws
around the sides of the spectrophotometer, Fig. A1 6. Install the
gray metal protection cover and cover of instrument. 7. Re-set the
tungsten lamp usage time. Select Utility, lamp and re-setW lamp usage time.
Focus on the slit
-
54
Appendix C A number of correction techniques can be used to
eliminate or reduce interference errors. In general, if the source
of the error is known and is consistent from sample to sample, the
error can be eliminated. On the other hand, if the source is
unknown and varies from sample to sample, the error can be reduced
but not eliminated. Correction techniques can always require data
from at least two wavelengths. The more sophisticated correction
techniques require multiwavelength or spectral data. A.1
Isoabsorbance When a known interfering component with a known
spectrum is present, the error introduced by this component at the
analytical wavelength for the target analyte can be eliminated by
selecting a reference wavelength at which the interfering compound
exhibits the same absorbance as it does at the analytical
wavelength. The absorbance at this reference wavelength is
subtracted from the absorbance at the analytical wavelength, as
shown in Figure A1.The residual absorbance is the true absorbance
of the analyte. This technique is less reliable when the spectra of
the analyte and of the interferent are highly similar. Moreover, it
can correct for only one interferenceFig A1 Isoabsorbance correction
A.2 Three-point correction The three-point, or Morton-Stubbs
correction uses two referencewavelengths, usually those on either side of the analytical
wavelength. -
55
The background interfering absorbance at the analytical
wavelength is then estimated using linear interpolation (see Figure
A2).This method represents an improvement over the
single-wavelength reference technique because it corrects for any
background absorbance that exhibits a linear relationship to the
wavelength. In many cases, if the wavelength range is narrow, it
will be a reasonable correction for non-linear background
absorbances such as that resulting from scattering of from a
complex matrix.Fig A2
-
Contents
-
Table of Contents
-
Bookmarks
Quick Links
Related Manuals for Unico UV-2802
Summary of Contents for Unico UV-2802
-
Page 2: Table Of Contents
Contents Safety … … … .… … … … … … … … … … … … … … … … … … … … … … … … … . G e n e r a l … … … … … … … … … … … … … … … … … … … … … … … … … … … . E l e c t r i c a l ……
-
Page 3: Safety
Whenever it is likely that the protection has been impaired, the apparatus shall be made inoperative and be secured against any unintended operation. NEVER touch or handle the power supply on UNICO UV-2802 due to the high voltage. The protection is likely to be impaired if, for example, the apparatus Ÿ…
-
Page 4: Performance
Introduction: The UNICO UV-2802 model spectrophotometer (Fig 1) is a single beam, general purpose instrument designed to meet the needs of the Conventional Laboratory, The UNICO UV-2802 model spectrophotometer is ideal for various…
-
Page 5: Working Principle
Fig1 Working Principle: The spectrophotometer consists of five parts: 1) Halogen or deuterium lamps to supply the light; 2) A Monochromator to isolate the wavelength of interest and eliminate the unwanted second order radiation; 3) A sample compartment to accommodate the sample solution; 4) A detector to receive the transmitted light and convert it to an electrical signal;…
-
Page 6: Specifications
Packing List Description Quantity Ÿ Spectrophotometer…………Ÿ Mains Lead…………..Ÿ Cuvettes…………….Set of 4, glass …………..Set of 2, quartz Ÿ Dust Cover…………… Ÿ Manual …………….Specifications: Ÿ Wavelength Range: 190-1100nm Ÿ Spectral Bandpass: Ÿ ±0.8nm Wavelength Accuracy: Ÿ Wavelength Repeatability: ±0.05nm Ÿ…
-
Page 7: Operation
Operation: Prepare the spectrophotometer Fig 3 is the control panel. User can perform all operations by pressing the keys and all the results and operation information are displayed on the LCD. Fig 3 Description of keys Ÿ 【LOAD】 Load data or curve saved before; 【SAVE】 …
-
Page 8: Turn On Spectrophotometer
character; 【∧】,【∨】 Change “ y” scale; Search peak after scan; Scroll items for selecting; Change capital/small letter last typed in; Browse the items for selection; 【CELL】 Set cell position. Ÿ Turn on spectrophotometer Turn on spectrophotometer by pressing the Power Switch (IO)(see Fig1). The instrument starts to initiate and the steps are as below: 1.The instrument will check memory first (Fig 4), please wait or press any key to skip this step ,after positioning filter, auto-cell changer(if installed) and…
-
Page 9: Basic Operation
Search 656.1nm ..√ Check Energy ..√ United Products & Instruments Inc. Fig 6 WL : 656.1nm 16:31: 35 UNICO SPECTROPHOTOMETER Cell SPECTRO-QUEST Basic mode DNA/Protein Multi WL Quantitative WL scan…
-
Page 10
WL : 656.1nm Energy Low. . . Blanking Cell Max E F1:Unit F2:Mode F Factor Standard Fig 8 NOTE: 1.Blanking is automatic after a wavelength change DO NOT OPEN SAMPLE COMPARTMENT LID DURING BLANKING. 2.The dark current don’ t be taken after power on,if you bypass the calibrating system. -
Page 11
² Use numeric keypad to input wavelength (Fig 11). WL : 656.1nm 12: 35: 27 0.001 Abs Cell Max E Please input wl: 450 Fig 11 ² Press 【ENTER】 to change the wavelength from 656.1nm to 450.0nm,and then blank; after blanking, the screen displays as Fig WL : 450.0nm 12: 35: 27… -
Page 12
WL : 680.0nm 12: 35: 27 Cell From: 200.0 680.0 Step: 1.0nm XScale YScale 200.0 Wavelength (nm) 680.0 F1:Setup F2:Mode F3:Search Fig 13 WL : 680.0nm 12: 35: 27 Cell From: 200.0 680.0 Step: 1.0nm XScale YScale 200.0 Wavelength (nm) 680.0 F1:Setup F2:Mode F3:Search Fig 14… -
Page 13
Wipe the cuvette with tissue to remove the fingerprints and droplets of liquid. Ÿ Fit the blank cuvette into the 4-cell linear changer and place the cuvette in the slot nearest you. For the UNICO UV-2802, push the changer so that… -
Page 14: Analyse Sample
the cuvette is in the light path (Push the rod in). Close the lid. Analyze Sample For different user requirements, we have provided different test methods. Basic Mode Push the blank cuvette into the light path. In main menu (Fig7),press【1】 to enter “…
-
Page 15
1. Abs mode Push the blank cuvette into the light path.Press 【F2】 to select Abs mode ,Press 【0Abs/100%T】 for Blanking , and then Push the sample into lightpath to take reading(Fig 20) 2. T% mode The operation is the same as Abs test mode but pressing【F2】 to select T% mode . -
Page 16: Quantitative
WL : 656.1nm 12: 35: 27 0.000 mg/ml Cell Max E Please input F factor: 4 Fig 23 WL : 656.1nm 12: 35: 27 0.000 mg/ml Cell F=4.000 Max E F1:Unit F2:Mode F3:F Factor F4:Standard Fig 24 J Print Test Report Press 【PRINT】to print test results (Fig 25).
-
Page 17
J How to operation 1. Press 【F1】to select unit of concentration (Fig 27). WL : 700.0nm Abs: 12: 35: 27 Quantitative Test Conc. (mg/L) Cell WL(nm) 700.0 Search Scroll C=1.000*A^1 r=1.000 Please select unit: g/L Fig 27 2 Press 【SETλ】 to select correction methods and enter the wavelength. -
Page 18
WL : 700.0nm Abs: 12: 35: 27 Calibration table Conc. (mg/L) Cell WL(nm) 700.0 C=1.000*A^1 r=1.000 Input K1=1.033 Fig 29A The constants to be entered are depending on which fitting method selected.The table below lists the their relation: Fitting Method Fitting Equation constants linear fit through zero K1, r*… -
Page 19
3.3.2 Push the blank cuvette into the light path, press 【0Abs/%100T】 ,the instrument will step to the wavelength and blank. See Fig 32. WL : 700.0nm Abs: B l a n k … . … … . Calibration table Conc. (mg/L) Cell 2.000 WL(nm) -
Page 20
WL : 656.1nm Abs: 12: 35: 27 Cell -1.0 Press (ESC) to return . . . Fig 35 square fit WL : 656.1nm Abs: 12: 35: 27 Cell -1.0 Press (ESC) to return . . . Fig 36 cubic fit WL : 656.1nm Abs:… -
Page 21: Wl Scan
4.1 Push the blank cuvette into the light path and press 【0Abs/100%T】 for blanking. 4.2 Pull the sample cuvette into the light path, press the key 【START】, the results will be displayed on the screen (Fig 38). WL : 700.0nm Abs: 12: 35: 27 Quantitative Test…
-
Page 22
J Scan sample 1. Press 【F1】 to setup, input the start wavelength, and end wavelength by pressing the numeric keypad (Fig 42). Note: The UV-2802 scans from high to low wavelength. Browse and select the items of scan step and scan speed by pressing 【∧】or【∨】. -
Page 23
scanning; WL : 520.0nm Scan to 200.0nm Cell From: 200.0 680.0 Step: 1.0nm XScale YScale 200.0 Wavelength (nm) 680.0 Press (ESC) to stop . . . Fig 44 4. Pull the sample cuvette into the light path, press 【START】 to scan the sample(Fig 45) 【ESC/STOP】 to stop scanning. -
Page 24
WL : 680.0nm 12: 35: 27 Cell From: 200.0 680.0 Step: 1.0nm XScale YScale 200.0 Wavelength (nm) 680.0 Min X:300 Fig47 WL : 680.0nm 12: 35: 27 Cell From: 200.0 680.0 Step: 1.0nm XScale YScale 300.0 Wavelength (nm) 500.0 F1:Setup F2:Mode F3:Search Fig 48 Press 【F3】 to search the Abs/%T value of the scan. -
Page 25
WL : 680.0nm 12: 35: 27 Cell From: 200.0 680.0 Step: 1.0nm Point Peak 200.0 Wavelength (nm) 680.0 Please input peak height: 0.100 Fig 50 WL : 452.0nm %T:22.38 12: 35: 27 Cell From: 200.0 680.0 Step: 1.0nm Point Peak 200.0 Wavelength (nm) 680.0… -
Page 26: Kinetics
Fig 52 Kinetics Press【4】in main menu for “ Kinetics” (Fig 53). 【ESC/STOP】to exit. To load a previous kinetics result, press (LOAD) and select a previously stored result (.kin)
-
Page 27
Tim : 60s Abs: 12: 35: 27 Cell Total 180s Inteval 1.0s XScale YScale Time(s) F1:Setup F2:Mode F3:Process F4:Search Fig 53 J Test 1. Press 【F1】 to set “ Total Time” , ” Delay Time” , ” Time interval” , and input the value by pressing the numeric keypad (Fig 54). -
Page 28
Tim : 180s Abs: 12: 35: 27 Cell Total 180s Inteval 1.0s XScale YScale Time(s) F1:Setup F2:Mode F3:Process F4:Search Fig 56 5. Press 【F3】to process the data, and e nter “ Begin Time” , ” End Time” and ” Factor” (Fig 57) and the value in I.U. will be calculated and displayed (Fig 58). -
Page 29: Dna/Protein
J Save Curve Press the key 【SAVE】 to save curve. Note: Load/Save requires the first kinetics display page Fig. 56. Press ESC if in Search to return to the required page. J Print Test Report Press the key 【PRINT】to print the curve you have loaded or scanned (Fig 59). Fig 59 DNA/Protein Press【5】in main menu for “…
-
Page 30
WL : 900.0nm 12: 35: 27 DNA/Protein measurement Items Result Unit Cell WL(nm) 260.0 280.0 320.0 Search Scroll F1:Coeff F2:Mode F3:Unit F4:Default Fig 60 To load previous DNA results, press (LOAD) and select a previously stored result (.dna) J Test 1. -
Page 31
WL : 900.0nm 12: 35: 27 DNA/Protein measurement Items Result Unit Cell WL(nm) 260.0 280.0 Search Scroll With reference: Fig 63 3. Press 【F3】to select the unit of concentration (Fig 64). WL : 900.0nm 12: 35: 27 DNA/Protein measurement Items Result Unit Cell… -
Page 32: Multi Wavelength
WL : 900.0nm Abs: 12: 35: 27 DNA/Protein measurement Items Result Unit Cell 2.947 WL(nm) 2.842 260.0 Aref 0.638 280.0 320.0 C-DNA 65.91 mg/mL C-Pro 1672 mg/mL Ratio 1.048 Search Scroll Search sample:3 Fig 66 J Recall the default Press the key【F4】to recall the default of the f1-f4. J Save Data Press the key 【SAVE】 to save data.
-
Page 33
J Test 1. Press 【F1】 to setup a group of wavelengths for testing by pressing the numeric keypad followed by 【 ENTER】 . (´) or (` ) to modify the inputted data Fig. 69. Press【ESC/STOP】to finish setup and exit. Note: It is recommended to enter the highest wavelength first. WL : 900.0nm Abs:… -
Page 34: S E T T I N G A N D C A L I B R A T I O
WL : 500.0nm Abs: 12: 35: 27 Multi Wavelength Test WL(nm) Cell 500.0 0.87 3 WL 400.0 0.42 300.0 0.81 Search Scroll F1:WL setup F2:Mode Fig 71 5. If there is more than one sample, repeat step 4 for the next sample. Note: When the test has finished, the wavelength will go to the first 6.
-
Page 35
WL : 656.1nm 08: 04: 35 UNICO SPECTROPHOTOMETER Cell SPECTRO-QUEST WL Reset Accu Validity Printer Validity Lamp Connect to PC Clock Beeper on/off Dark current Delete entire saved files Restore default United Products & Instruments INC. Fig 73 J WL Reset Press【1】to reset wavelength (Fig74). -
Page 36
WL : 656.1nm 08: 04: 35 UNICO SPECTROPHOTOMETER Cell SPECTRO-QUEST Reset printer Select print port Select printer Print report Select the print port: Fig 76 Press【3】 in Fig 75 to select printer (HP PCL (1 colour cartridge), PCL (black mode), Epson ESC/P or Epson/P2 or above, Fig77). -
Page 37
WL : 656.1nm 08: 04: 35 UNICO SPECTROPHOTOMETER SPECTRO-QUEST Cell Switch D2: Reset D2 lamp usage time Switch W: Reset W lamp usage time Switch point United Products & Instruments INC. Fig 79 1. Press【1】in Fig 79 to switch on/off D2. Fig 80. -
Page 38
WL : 656.1nm 08: 04: 35 UNICO SPECTROPHOTOMETER Cell SPECTRO-QUEST Switch D2: Reset D2 lamp usage time Switch W: Reset W lamp usage time Switch point United Products & Instruments INC. Fig 82 4. Press 【4】in Fig 79 to reset usage of W (Fig 83). Press 【∧】or【∨】… -
Page 39
WL : 656.1nm 08: 04: 35 UNICO SPECTROPHOTOMETER Cell SPECTRO-QUEST Set Time Set Date Show Time mode Show Date mode United Products & Instruments INC. Fig 85 1. Press 【1】in Fig 85 to modify time by pressing the numeric keypad (Fig 86). -
Page 40
WL : 656.1nm Get dark current UNICO SPECTROPHOTOMETER Cell SPECTRO-QUEST WL Reset Accu Validity Validity Printer Lamp Connect to PC Clock Beeper on/off Dark current Delete entire saved files Restore default United Products & Instruments INC. Fig 88 J Accu Validity Press 【4】In Fig73 to do accu validity (Fig 89). 【ESC/STOP】to exit. -
Page 41
WL : 900.0nm 12: 35: 27 Photometric Validity Test WL(nm) %T(Std) Result Cell 440.0 9.28 546.0 0.000 635.0 0.000 Select Input the standard:0 Fig 91 Press 【F2】to select test mode (Abs or %T, Fig 92). WL : 900.0nm 12: 35: 27 Photometric Validity Test WL(nm) %T(Std) -
Page 42
WL : 900.0nm 12: 35: 27 Photometric Validity Test WL(nm) %T(Std) Result Cell 500.0 9.28 9.28 pass 600.0 8.45 8.45 pass 700.0 5.66 Standard Mode Tolerance Fig 94 J WL Validity Press【7】in Fig 73 to WL validity (Fig 95). 【ESC/STOP】to exit. WL : 900.0nm Abs:… -
Page 43
WL : 900.0nm 12: 35: 27 Wavelength Validity Test WL(nm) Peak(nm) Result Cell 241.4 361.0 417.0 537.6 641.4 807.4 Please select mode: Fig 97 3. Press 【F3】 to set tolerance (Fig 98). Input the value by pressing the numeric keypad. WL : 900.0nm 12: 35: 27… -
Page 44: Defined Tests
PC.The screen displays as Fig 100A. Press【ESC/STOP】to exit. WL : 656.1nm 08: 04: 35 UNICO SPECTROPHOTOMETER SPECTRO-QUEST Connecting to computer. . . United Products & Instruments INC. Fig 100 WL : 656.1nm 08: 04: 35 UNICO SPECTROPHOTOMETER SPECTRO-QUEST Controlled by PC . . .
-
Page 45
1. Press 【F1】 to setup method (Fig 102). There are 8 items (1 ref. 1 sample, 1 ref. 2 samples, 1 ref. 3 samples, 1 ref. 4 samples, 1 ref. 5 samples, 1 ref. 6 samples, 1 ref. 7 samples, N refs. N samples) for selecting. -
Page 46
7. Press 【 START】 ,the screen display as Fig105,the“ Place 1 group… ” appear on the right of top line, Press【0Abs/100%T】, the 8 references are taken automatically and the screen change to Fig 106. WL : 900.0nm Place 1st group . . 0.000 Abs Cell 1 Ref,… -
Page 47
Appendix A DNA/Protein Test Algorithm Wavelength(s) Parameters Method Calculations Displayed Test Name Units DNA MEASUREMENT =62.9 DNA: Absorbance 260nm difference μg/ml DNA/Protein concentration: =36.0 280nm (260,280) =1552 Protein:μ 320nm Protein Concentration =757.3 (optional) g/ml concentration DNA purity Absorbance =49.1 260nm difference concentration: =3.48… -
Page 48
Appendix B Lamp Replacement TO REPLACE DEUTERIUM LAMP 1. Turn off and unplug the instrument (VERY IMPORTANT: HIGH VOLTAGE). 2. Remove the cuvette holder rod by unscrewing the rod counterclockwise. 3. Remove the all screws around the sides of the spectrophotometer. See Fig A1 Fig A1 4. -
Page 49
Fig A2 HINT: If it is necessary to remove the cover from the right side of the instrument, carefully remove 3 connectors (CZ6, CZ4 and J3)on PCB marked SST8.417.100 . Be sure to reconnect after replacing the lamp! Fig A3 Fig A3 5. -
Page 50
place the protective cover to the side. See Fig A4 Fig A4 6. Disconnecting the connector J7 on the PCB marked SST8.411.128. Unscrew the screw that holds the lamp bracket to the instrument base. Pull the entire lamp and lamp holder assembly out. See Fig… -
Page 51
Fig A5 7. Replace the pre-aligned lamp with a lamp (Fig A6) provided by UNICOor an authorized UNICOService Provider . This comes pre-assembled with lamp socket. Fig A6 CAUTION: THE LAMP MAY BE HOT! TAKE PRECAUTIONS TO PREVENT POSSIBLE BURNS. 8. -
Page 52
Check the lamp alignment Fig. A7. If the image is not covering the slit, the lamp alignment needs adjustment. This requires running the UV-2802 without the covers, with high voltages accessible, and so should only be performed by a suitably qualified engineer. -
Page 53
Check the lamp alignment Fig. A9. If the image is not covering the slit, the lamp alignment needs adjustment. This requires running the UV-2802 without the covers, with high voltages accessible, and so should only be performed by a suitably qualified engineer. -
Page 54
Focus on the slit Fig A9 CAUTION: DO NOT HANDLE THE LAMP WITH BARE FINGERS. USE TISSUE OR CLOTH WHEN HANDLING LAMP. The oil from your fingers can cause the lamp to burn out prematurely. 5. Re-fit all the screws around the sides of the spectrophotometer, Fig. 6. -
Page 55
Appendix C A number of correction techniques can be used to eliminate or reduce interference errors. In general, if the source of the error is known and is consistent from sample to sample, the error can be eliminated. On the other hand, if the source is unknown and varies from sample to sample, the error can be reduced but not eliminated. Correction techniques can always require data from at least two wavelengths. The more sophisticated correction techniques require multiwavelength or spectral data. A.1 Isoabsorbance When a known interfering component with a known spectrum is present, the error introduced by this component at the analytical wavelength for the target analyte can be eliminated by selecting a reference wavelength at which the interfering compound exhibits the same absorbance as it does at the analytical wavelength. The absorbance at this reference wavelength is subtracted from the absorbance at the analytical wavelength, as shown in Figure A1.The residual absorbance is the true absorbance of the analyte. This technique is less reliable when the spectra of the analyte and of the interferent are highly similar. Moreover, it can correct for only one interference Fig A1 Isoabsorbance correction A.2 Three-point correction The three-point, or Morton-Stubbs correction uses two reference wavelengths, usually those on either side of the analytical wavelength. … -
Page 56
The background interfering absorbance at the analytical wavelength is then estimated using linear interpolation (see Figure A2).This method represents an improvement over the single-wavelength reference technique because it corrects for any background absorbance that exhibits a linear relationship to the wavelength. In many cases, if the wavelength range is narrow, it will be a reasonable correction for non-linear background absorbances such as that resulting from . scattering of from a complex matrix Fig A2…
Однолучевой спектрофотометр ЮНИКО модель 2800, работающий в спектральном диапазоне 190-1100 нм, является самой экономичной разработкой в серии однолучевых приборов ЮНИКО 280X. Эта модель, имеющая спектральную щель 4 нм и скорость сканирования до 1000 нм/мин специально адаптирована для отечественных условий и выпускается с учетом российских лабораторных требований. Прибор отличается высокой точностью определения процента пропускания/ оптической плотности, установки длины волны, разрешением 0,1 нм и прекрасной временной стабильностью.
Спектрофотометр ЮНИКО 2800 является настольным прибором, оснащенным большим информативным жидкокристаллическим экраном.(320х240 точек), 29-знаковой клавиатурой, встроенным мощным процессором, позволяющим проводить все аналитические измерения без подключения к персональному компьютеру. Режимы измерений, градуировки и полученные спектры хранятся в энергонезависимой памяти. Для вывода информации предусмотрены порты для подключения принтера и компьютера. Для удобства хранения и обработки данных на персональном компьютере разработано специальное программное обеспечение, обеспечивающее перенос данных, составление отчетов, представление результатов измерений.
Вместительное отделение для проб позволяет размещать кюветы длиной до 100 мм. Предлагается широкий ряд держателей проб/кювет и дополнительных принадлежностей. Возможна установка кассеты для программируемой автоматической смены 8-ми квадратных кювет 10х10 мм. Для медико-биологических измерений особенно интересна проточная терморегулируемая (15-40°С) система с собственным перистальтическим насосом и программатором температуры на Пельтье-элементах.
Конструкция спектрофотометров ЮНИКО серии 280Х основана на оригинальных оптических элементах с защитным покрытием, смонтированных на мощной плите. Источниками излучения служат дейтериевая и галогеновая лампы, доступные для самостоятельной смены и юстировки. Программный счетчик времени работы ламп позволяет планировать их эксплуатацию и своевременную замену.
Метрологическая поддержка.
На основании положительных результатов испытаний спектрофотометр ЮНИКО модель 2800 внесен как тип в государственный реестр средств измерений РФ и зарегистрирован под № 38106-08, выдан сертификат Госстандарта РФ № 32007.
Спектрофотометры ЮНИКО 2800 имеют описание типа средств измерений, снабжаются свидетельством о госпроверке, методикой поверки, руководством по эксплуатации на русском языке.
Приборы подлежат ежегодной поверке силами ЦСМ на местах с использованием стандартных поверочных средств.